Vanessa Cristina Tavares da Silva Almeida
Licenciatura em Química Aplicada
Dissertação para obtenção do Grau de Mestre em Bioquímica
Orientador: Doutora Margarida Archer Frazão,
Investigadora principal, ITQB NOVA
Co-orientador: Tânia Filipa Oliveira, Post-Doctoral Fellow, ITQB NOVA
José Artur Brito, Post-Doctoral Fellow, ITQB NOVA
Júri:
Presidente: Doutor Carlos Alberto Gomes Salgueiro Arguente: Doutor Filipe Miguel dos Santos Freire
Vogal: Doutora Margarida Archer Frazão
Setembro 2017
iv
L
O
M
B
A
D
A
Structural Characterization of Serine Protease Complexes with Novel Inhibitors Vanessa Almeida
Structural Characterization of Serine Protease Complexes with Novel Inhibitors
Copyright © Vanessa Cristina Tavares da Silva Almeida, Faculdade de Ciências e Tecnologia, Universidade Nova de Lisboa.
i
Acknowledgments
During this last year I received lots of support from many people, directly and
indirectly, to whom I am very grateful and happy to have been able to count on them.
Trying not to forget anyone, I would like to thank you:
Firstly, to Professor Margarida Archer for allowing me to be integrated into the
Membrane Protein Crystallography Laboratory (MPX), the opportunity to work on this
project and all the training that has provided me. Thank you also for your supervision,
support, enthusiasm, availability and friendliness.
To Professor Rui Moreira and his student Luís Carvalho from Instituto de
Investigação do Medicamento, Faculdade de Farmácia, Universidade de Lisboa, for
allowing me to participate in their interesting research project.
To my laboratory colleagues for the help, support, companionship and good
work environment. In addition, to Tânia Oliveira for her directions, explications,
patience and for believing in me since the beginning. To José Brito for his constructive
criticism, his help, supervision, accompaniment, availability and good disposition. To
Márcia Alves, Diogo Athayde, José Rodrigues and Ana Coxixo for the patience,
sympathy, good disposition, motivation and support.
To all members of ITQB's Macromolecular Crystallography unit, for good
reception, knowledge sharing and help.
To my college classmates for fellowship, joy, strength and support.
To my friends for giving me strength, confidence, encouragement, support and
patience.
To my boyfriend for his patience, understanding, affection, encouragement and
for believing in me.
And finally, to my family (mainly mother, father and grandmother Clara) for the
opportunity to hold this master's degree, for all the unconditional love, support,
strength and patience, for helping me to overcome my obstacles, for always believing
in me and in what I do.
iii
Abstract
Human Neutrophil Elastase (HNE) is a serine protease responsible for cleavage
of peptide bonds conferring elasticity to the connecting tissues. For this reason, this
enzyme is mainly found in the lungs, arteries and ligaments [1-2]. In case of
over-expression, HNE enables the appearance of some diseases, such as Chronic Obstructive
Pulmonary Disease (COPD), Rheumatoid Arthritis, Psoriasis and Arteriosclerosis [3-4].
Currently, diseases affecting the respiratory tract are one of the major causes of death
in the world, so HNE is a potential drug target of considerable interest [4].
Porcine Pancreatic Elastase (PPE) is commonly used as a model for HNE, sharing
37% of amino acid sequence identity [5]. According to previous studies, the catalytic
serine performs a nucleophilic attack on a carbonyl group present in the inhibitors [6].
The focus of this work was the three-dimensional structure determination of
elastases (PPE and HNE) in complex with inhibitors by X-ray crystallography to
characterize their interactions at atomic level. The rational is to correlate structure and
function and contribute to the design of more potent and specific inhibitors. These
newly synthetic compounds were provided by the group of Prof. Rui Moreira, Instituto
de Investigação do Medicamento, Faculdade de Farmácia, Universidade de Lisboa.
X-ray diffraction data of PPE crystals were collected at a synchrotron source and
three 3D-structures of PPE in complex with inhibitors were determined at resolutions
around 1.4 Ǻ. Analysis of the electron density maps revealed that the nucleophilic
attack occurred at the sulfonyl group of the inhibitors, contrary to what was initially
expected (which would be in the carbonyl group).
In silico energy minimization studies of the docked ligand structure into the
active site of HNE, show no relevant structural modifications of the protein structure
upon ligand binding.
Finally, crystals of HNE have already been obtained and experiments are
v
Resumo
Elastase Neutrófila Humana (HNE) é uma protease de serina responsável pela
clivagem das ligações peptídicas que conferem elasticidade aos tecidos de conexão. Por
esta razão, esta enzima é encontrada principalmente nos pulmões, artérias e ligamentos
[1-2]. Em casos de sobre-expressão, esta permite o aparecimento de algumas doenças,
como Doença Pulmonar Obstrutiva Crónica (DPOC), Artrite Reumatóide, Psoríase e
Arteriosclerose [3-4]. Atualmente, as doenças que afetam o trato respiratório são uma
das principais causas de morte no mundo, sendo então a HNE um potencial alvo
terapêutico de considerável interesse [4].
A Elastase Pancreática Suína (PPE) é normalmente usada como modelo para
HNE, compartilhando 37% de identidade de sequência primária [5]. De acordo com
estudos anteriores, a serina catalítica realiza um ataque nucleofílico ao grupo carbonilo
presente nos inibidores [6].
O foco deste trabalho foi a determinação por cristalografia de raios-X da
estrutura tridimensional de elastases (HNE e PPE) complexadas com inibidores, de
modo a caracterizar as respetivas interações a nível atómico. O racional é correlacionar
a estrutura com a função e contribuir para o desenho de inibidores mais fortes e mais
específicos. Estes novos compostos sintéticos foram fornecidos pelo grupo do Prof. Rui
Moreira, Instituto de Investigação do Medicamento, Faculdade de Farmácia,
Universidade de Lisboa.
Os dados de difração de raios-X dos cristais de PPE foram recolhidos numa fonte
de sincrotrão e três estruturas 3D de três complexos da PPE com inibidores foram
determinadas com resoluções em torno dos 1,4 Å. A análise dos mapas de densidade
eletrónica revelaram que o ataque nucleofílico ocorreu no grupo sulfonilo dos
inibidores ao contrário do que era inicialmente esperado (que seria no grupo
carbonilo).
A minimização de energia in silico da estrutura do ligando acoplado no centro
ativo da HNE não mostra modificações relevantes na estrutura da proteína após a
ligação do ligando.
Finalmente, já foram obtidos cristais de HNE, estando já em curso experiencias para o
vii
Index
Acknowledgments ... i
Abstract ... iii
Resumo v List of Figures ... ix
List of Tables ... xi
List of Equation ... xi
Abbreviations ... xiii
1. Introduction ... 1
1.1 Enzymes ... 2
1.2 Proteases ... 4
1.3 Serine proteases ... 8
1.4 Elastases ... 10
1.5 Crystallography ... 12
1.6 X-ray diffraction ... 17
1.7 Synchrotron ... 22
2. Materials and Methods ... 25
2.1 Crystallization of PPE in the native state ... 25
2.2 Crystallization of HNE in the native state... 26
2.3 Biochemical characterization ... 27
2.3.1 Bradford method ... 27
2.3.2 Electrophoresis (SDS-PAGE) ... 28
2.4 Micro-seeding with native crystals ... 29
2.5 Soaking of the native crystals with the Inhibitors ... 29
2.6 Co-crystallization with the inhibitors ... 30
2.7 X-ray diffraction Data Collection and Processing ... 30
3. Results and Discussion ... 33
3.1 Structural analysis of PPE complexes ... 33
3.1.1 Crystallography, Data collection and Processing ... 33
3.1.2 Model building and refinement ... 42
3.2 Structural analysis of HNE complexes ... 47
3.2.1 Energy Minimization ... 47
3.2.2 Protein Crystallization ... 49
viii
5. Bibliography ... 55
ix
List of Figures
Figure 1.1- Structure levels of a protein. ... 1
Figure 1.1.1 - Energetic profile of enzymatic and non-enzymatic reactions. ... 2
Figure 1.2.1 - Statistical results of the identification of each protease family in the total number of proteases. ... 8
Figure 1.3.1 - Catalytic mechanism of serine proteases. ... 9
Figure 1.4.1 - Action of catalytic serine on peptide bonds. ... 10
Figure 1.4.2 - Amino acid sequence alingment: PPE vs. HNE. ... 11
Figure 1.4.3 - Structure superposition of PPE and HNE, with an expansion of the active sites. ... 12
Figure 1.5.1 - Representation of the vapour diffusion hanging drop and sitting drop methods. ... 13
Figure 1.5.2 - Phase diagram for crystallization. ... 14
Figure 1.5.3 - Illustration of the streak seeding technique. ... 14
Figure 1.5.4 - Illustration of the Microseeding technique by Seed Bead®. ... 15
Figure 1.5.5 - Illustration of the Macroseeding technique. ... 15
Figure 1.5.6 - Illustration of the Soaking technique. ... 15
Figure 1.5.7 - Illustration of the Co-crystallization technique. ... 16
Figure 1.6.1 - Illustration of a data collection. ... 17
Figure 1.6.2 - Conditions for diffraction. ... 17
Figure 1.6.3 - Crystal Packing. ... 18
Figure 1.6.4 - Expected result in a crystallographic data collection for a three-dimensional analysis. ... 19
Figure 1.7.1 – General scheme of operation of a Synchrotron. ... 23
Figure 1.7.2 - Photographs of synchrotrons. ... 23
Figure 2.3.2.1 - PageRuler Plus Prestained Protein Ladder (marker). ... 28
Figure 2.5.1 - Ligands synthesized by the group of Rui Moreira, Faculdade de Farmácia, for Pancreatic Porcine Elastase, used in the technique of soaking. ... 29
x
Figure 2.6.2 - All the ligands synthesized by the group of Rui Moreira, Faculdade de
Farmácia, for Human Neutrophil Elastase. ... 30
Figure 3.1.1.1 - Native PPE crystals obtained in a screen of conditions. ... 33
Figure 3.1.1.2 - Precipitant percentage optimization assay. ... 34
Figure 3.1.1.3 – Native crystals obtain in Condition 5 by Streak seeding. ... 34
Figure 3.1.1.4 - Soaking experiments. ... 35
Figure 3.1.1.5 - Crystals obtained by co-crystallization. ... 36
Figure 3.1.1.6 - Electronic density map around the active site with co-crystallized LMC188. ... 38
Figure 3.1.1.7 - Electronic density map around the active site of the putative complexes formed by Co-crystallization. ... 40
Figure 3.1.1.8 - Streak seeding in the Sodium Acetate Conditions. ... 41
Figure 3.1.1.9 - Crystals of condition 1 obtained by co-crystallization. ... 42
Figure 3.1.2.1 -Inhibitor β-Sultam ring. ... 43
Figure 3.1.2.2 - Mechanism of action 1 - With nucleophilic attack on the carbonyl group. ... 43
Figure 3.1.2.3 - Illustration of the blobs obtained around the catalytic center. ... 43
Figure 3.1.2.4- Fit of the ligand resulting from the mechanism of action 1 at the resulting Fo-Fc density, near the catalytic center of the enzyme. ... 44
Figure 3.1.2.5 - Mechanism of action 2 - With nucleophilic attack on the sulfur group. 44 Figure 3.1.2.6 - Fit of the ligand resulting from the mechanism of action 2 at the resulting Fo-Fc density, near the catalytic center of the enzyme. ... 45
Figure 3.1.2.7 - Electron density (2Fo-Fc) around the ligands after refinement at 1 sigma level. ... 46
Figure 3.2.1.1 - PPE and HNE structure alignment. ... 47
Figure 3.2.1.2 - Minimization models overlaid with the electronic density maps of the final refinement of the PPE complexes. ... 48
Figure 3.2.2.1 - HNE crystal obtained in condition 4. ... 49
Figure 3.2.2.2 - SDS-PAGE for the HNE ... 50
Figure 3.2.2.3 - Crystals of HNE obtained in ShotGun screen. ... 51
xi
List of Tables
Table 1.1.1 - Classes of enzymes. ... 3
Table 1.2.1 - Protease classification according to their place of action. ... 5
Table 1.2.2 - Protease families. ... 7
Table 2.1.1 - Summary of Porcine Pancreatic Elastase (PPE) crystallization conditions. ... 25
Table 2.2.1 - Summary of Human Neutrophilic Elastase (HNE) crystallization conditions. ... 26
Table 3.1.1.1 - Data collection and processed data of ESRF (ID23-1) ... 37
Table 3.1.1.2 - Data collection and reprocessed synchrotron data (Diamond - Beamline I03). ... 39
Table 3.1.1.3 - Data collection and reprocessed synchrotron data (ESRF - Beamline ID30A-3). ... 39
Table 3.1.2.1 - Validation parameters obtained in the final refinement. ... 46
Table A. 1 - Total data collection and Processing ESRF (ID23-1) ... 61
Table A. 2 -Total data collection Diamond (Beamline I03) and ESRF (ID30A-3) ... 63
List of Equation
Equation 1.6.1 - Mathematical equation to obtain the structural factors amplitude from the intensities. ... 19xiii
Abbreviations
Å Angstrom
BSA Bovine Serum Albumin Da Dalton
ddH2O Bidestilated water DMSO Dimethylsulfoxide
E.C. Enzymatic Comission EM Electron Microscopy
ESRF European Synchrotron Radiation Facility HD Hanging drop
HNE Human Neutrophil Elastase HPE Human Pancreatic Elastase
IUBMB International Union of Biochemistry and Molecular Biology MAD Multiple wavelength Anomalous Dispersion
MIR Multiple Isomorphous Replacement MPD 2-methyl-2,4-pentanediol
MR Molecular Replacement NMR Nuclear Magnetic Resonance
PDB Protein Data Bank PEG Polyethylene glycol
PPE Porcine Pancreatic Elastase rpm Revolutions per minute
SAD Single wavelength Anomalous Dispersion SAXS Small-angle X-ray Scattering
SD Sitting drop
SDS Sodium Dodecyl Sulfate
SIR Single Isomorphous Replacement Tris Tris(hidroxymethyl)-aminomethane
1
1.
Introduction
Since the XVIII century, with the development of the knowledge on the biological cell,
biochemical reactions proved to be quite important in the functioning of the living organism.
Such reactions were shown to be involved in many biological processes like regulation of the
cellular growth and division, energy generation and storage, catalysis, stimuli response,
transport of small biomolecules, etc.
These reactions occur through the action of macromolecules known as proteins, which
comprise 20-30% of the cytoplasm mass and 60-80% of the dry weight of the cellular
membrane [7]. Its production starts with transcription and translation of a gene present in
the cell genome, resulting in a polypeptide chain (primary structure of the protein, Figure
1.1). In order to achieve stability, the amino acids of this chain organize themselves
structurally, being this three-dimensional arrangement intimately connected with the
protein’s function [8].
Figure 1.1.1- Structure levels of a protein [9].
Due to their great importance at the biological level, these macromolecules are often
the main research target of several scientific areas (pharmaceutical, medical, agricultural,
food, cosmetic and technological sciences). Lately, for the development of new products,
these areas use structural biology and biochemical techniques to understand the function,
activity and affinities of the target proteins [10–12]. These studies can be accomplished
through some techniques, namely X-ray diffraction (macromolecular crystallography),
nuclear magnetic resonance (NMR), small angle X-ray scattering (SAXS), cryo-electron
2
(MST), thermal shift assays (TSA), surface plasmon resonance (SPR) and dual polarization
interferometry (DPI) [13- 15]. Typically, the most commonly used technique is X-ray
diffraction which, as the name implies, results from the diffraction of incident X-ray
radiation, when it interacts with the electron cloud of the atoms of a crystallized
macromolecule (see details below) [15], [16].
1.1
Enzymes
As explained above, the proteins can exhibit various functions, depending on their
three-dimensional structure.
Proteins that catalyze the biochemical reactions present in organisms are called
enzymes. Their purpose is to accelerate the chemical reaction (by decreasing its activation
energy, Figure 1.1.1), controlling its equilibrium and specifying the products that are formed,
without being consumed by the reaction [17], [18].
Figure 1.1.1 - Energetic profile of enzymatic and non-enzymatic reactions [17].
The blue diagram corresponds to the non-enzymatic reaction and the orange diagram to the enzymatic reaction.
The origin of its production may be intercellular [inside the cell) or extracellular
(excreted into the outer environment), depending on its target. According to their mode of
action, these types of proteins can be divided into two categories: Endoenzymes or
3 regions of the target molecule, whereas Exoenzymes only act on chemical bonds at the
extreme of the molecule of interest, generating dimers or trimers. Because of their high
specificity to the substrate and the promotion of a particular reaction, each enzyme is only
able to recognize and act on a specific chemical group as well as to produce a specific
product without the formation of co-products [19]. The efficiency of its activity is dependent
on the optimization of two major factors: Temperature and pH [17].
Initially, the name of the enzymes derived from the name of their substrate with the
addition of the suffix "-ase" (eg urease, an enzyme that catalyzes the hydrolysis of urea,
resulting from the name urea with the suffix "ase"). With the advancement of the enzymatic
discoveries, it was necessary to create a classification system capable of differentiating even
better the various types of biological enzymes. In 1961, a numerical classification system was
created by the Enzymatic Commission of the International Union of Biochemistry and
Molecular Biology (IUBMB). In this system, each enzyme receives a classification number
(known as "E.C.") composed of four digits. The first digit refers to the number of the 6 main
classes (Table 1.1.1) to which the enzyme belongs. The next two numbers are associated,
respectively, with the class and subclass of the substrate. Finally, the fourth number
represents the serial number of the respective enzyme [17].
Table 1.1.1 - Classes of enzymes [17].
Class Reaction Enzymes
1. Oxidoreductases 𝐴𝑟𝑒𝑑+ 𝐵𝑜𝑥 → 𝐴𝑜𝑥+ 𝐵𝑟𝑒𝑑 Dehydrogenases, peroxidases
2. Transferases 𝐴 − 𝐵 + 𝐶 → 𝐴 + 𝐵 − 𝐶 transaminases Hexokinase,
3. Hydrolases 𝐴 − 𝐵 + 𝐻2𝑂 → 𝐴 − 𝐻 + 𝐵 − 𝑂𝐻 Alkaline phosphatase, trypsin
4. Liases (synthase) 𝑋 − 𝐴 − 𝐵 − 𝑌 → 𝐴 = 𝐵 + 𝑋𝑌 Fumarase, dehydratase
5. Isomerases 𝐴 ⇌ 𝑖𝑠𝑜𝐴
Triose phosphate isomerase, phosphoglycerone 6. Ligases
(synthetases) 𝐴 + 𝐵 + 𝐴𝑇𝑃 → 𝐴 − 𝐵 + 𝐴𝐷𝑃 + 𝑃𝑖
4
1.2
Proteases
Proteases, as the name infers, are enzymes that break down proteins by hydrolyzing
their peptide bond. These type of enzymes can also be named as Proteolytic enzymes and its
general term are coded by EC 3.4.X.X [20].
These enzymes are ubiquitous in nature because of their involvement in various
physiological processes of living organisms. For this reason, they are present in a wide
variety of sources (such as plants, animals and microorganisms) [20], [21].
Its action at the extracellular level essentially consists of promoting the breaking of
large proteins into small molecules in order to make them more absorbable by the cell. At the
intracellular level, the main goal is to regulate cell metabolism.
Like all enzymes, proteases are divided into two major groups, according to their place
of action: Exopeptidases (exoenzymes) and Endopeptidases (endoenzymes).
Since exopeptidases act at the ends of proteins, they can be classified as
aminopeptidases (proteases that attack the N-terminal of the protein) or carboxypeptidases
(proteases that attack the C-terminal of the protein) [21].
In the aminoprotease group there are enzymes capable of removing a dipeptide or a
tripeptide from the protein (EC 3.4.14) as well as enzymes capable of removing only one
amino acid from the protein (EC 3.4.11).
In contrast, the carboxypeptidase group can only remove a dipeptide (EC 3.4.15) or
only an amino acid from the protein. The grouping enzymes that enter into the release
reactions of only one amino acid are differentiated according to the nature of their catalytic
center (Serin-type EC 3.4.16; Cysteine-type EC 3.4.18 and metallocarboxypeptidase EC
3.4.17).
However, there are exopeptidases that are not specific to one end of the protein (eg:
Dipeptidases EC 3.4.13 and Omega EC 3.4.99).
In the major group of endopeptidases, also known as proteinases, there is only
differentiation between enzymes according to the nature of the active center of the same,
composing 5 different families: Aspartic, Cysteine, Metallo, Threonine and serine
endopeptidases (Table 1.2.1). Nowadays, there are still endopeptidases whose catalytic
5 There are also proteases with an unspecific activity (Mixed proteases). As the name
implies, they can act as endopeptidases as well as exopeptides (eg: pronase) [22].
Table 1.2.1 - Protease classification according to their place of action [23].
Protease Enzyme
commission (EC) code
Mechanism
Aminopeptidases 3.4.11 Release N-terminal amino acid residues from polypeptides and protein
Dipeptidyl peptidase 3.4.14 Release of an N-terminal dipeptide from a polypeptide
Tripeptidyl peptidases 3.4.14 Release of an N-terminal tripeptide from a polypeptide
Peptidyl dipeptidases 3.4.15 Release of free C-terminus liberate a dipeptide
Serine-type
carboxypeptidases
3.4.16 Release of a single residue C-terminal from a polypeptide and have an active center serine involved in the catalytic process
Metallocarboxypeptidases 3.4.17 Release of a single residue C-terminal from a polypeptide using a metal ion in the catalytic mechanism
Cysteine-type carboxypeptidases
3.4.18 Release of a single residue C-terminal from a polypeptide and have a cysteine in the active center
Omega peptidases 3.4.19 Remove terminal residues that are linked by isopeptide bonds
Dipeptidases 3.4.13 Exopeptidases specific for dipeptides
6
Cysteine endopeptidases 3.4.22 Cleave internal bonds in polypeptide chains. Have a cysteine in the active center
Metalloendopeptidases 3.4.24 A metal ion (often, but not always, Zn2+)
is involved in the catalytic mechanism for cleaving internal bonds in polypeptide chains
Threonine endopeptidases 3.4.25 Cleave internal bonds in polypeptide chains having a threonine residue for their catalytic activity
Serine endopeptidases 3.4.21 Cleave internal bonds in polypeptide chains. Have an active center serine involved in the catalytic process
Endopeptidases of unknown catalytic mechanism
3.4.99 Acting on peptide bonds (peptide hydrolases)
As there are structural similarities between proteolytic enzymes, a new classification
emerged in 1993, the MEROPS classification, which takes into account the homology
between proteases and their molecular structures, dividing them by families and clans (Table
1.2.2).
Each family brings together the enzymes which show homology according to a
comparison of their amino acid sequence. Its MEROPS ID is initialized by a letter that
represents the catalytic type (S for serine, C for cysteine, T for threonine, A for aspartic, G for
glutamic, M for metallo, N for asparagine, P for mixed and U for unknown) followed of an
arbitrary number.
A clan assembles the enzymes with similar three-dimensional structures (taking into
account the arrangement and similarities in the amino acid sequence around the active
center). The only difference in its MEROPS ID, compared to the ID of families, is that the
letter that represents the active center instead of being followed by a random number is
7 The graphic in Figure 1.2.1 was constructed according to the total grouping of
proteases identified until 2017, according to the entries in the PDB (Protein Data Bank). In the
same case, serine proteases were the proteases that presented the highest number of entries
in the PDB, according to the MEROPS ID classification (37%) [20].
Table 1.2.2 - Protease families [25].
Family Example Catalytic center Favorable pH
Serine protease I Chymotrypsin
Trypsin
Elastase
Asp102,Ser195,His57 Neutral
Serine protease II Subtilisin Asp32,Ser221,His158
Cysteine protease Papain Cys25,His159,Asp158
Aspartic protease Penicilopepsin
Renin
Chymosin
Asp33,Asp213 Acidic
Metalloprotease I Carboxypeptidase A bovine
Zn,Glu270,Try248 Neutral or
alkaline
8
Figure 1.2.1 - Statistical results of the identification of each protease family in the total number of proteases, according to the entries of the PDB (Protein Data Bank) by 2017 [20].
1.3
Serine proteases
Serine proteases are a set of enzymes present in various biological processes, which
presents an active site with an aspartic acid, a histidine and a serine (catalytic triad) [17], [20].
After several inhibition studies, it was found that, out of the three amino acid residues of the
active site, serine would be the most reactive, naming this type of enzymes as serine
proteases[26].
With the approach of the carbonyl group of the peptide bond to the serine of the
catalytic center of the enzyme, the catalytic mechanism of the enzyme is started (Figure
1.3.1).
This mechanism is divided into two stages: acylation and deacylation.
The first stage (acylation) occurs through a nucleophilic attack of the catalytic serine
oxygen on the carbon of the carbonyl group of the peptide bond. Through it, a covalent bond
is formed between both elements which in turn causes the breaking of the peptide bond with
the release of an amino acid or a small peptide. The final complex of this stage is called
acyl-enzyme intermediate.
After the breakdown of the peptide bond, to separate the substrate from the enzyme,
the second phase (deacylation) is carried out. This results from a nucleophilic attack, this
time by a water molecule on carbon which at this stage is bound to the serine. In this way the
9 As can be seen in Figure 1.3.1, all reactions of the mechanism are reversible, so they can
occur in both directions [20], [27].
10
1.4
Elastases
Elastases are Serine proteases whose main function is the cleavage of peptide bonds of
many proteins (Figure 1.4.1) such as elastin, which is responsible for the elasticity of the
connective tissues, being mainly located in the lungs, arteries and ligaments [1], [2], [28].
Figure 1.4.1 - Action of catalytic serine on peptide bonds [29].
Neutrophilic elastases (HNE) and pancreatic elastases (HPE) are the most abundant
serine proteases in humans. As the names indicate, pancreatic elastases are stored in the
pancreas in their inactive zymogenic form, being only activated by the action of trypsin
when they are released into the intestine, improving the digestive process; neutrophil
elastases are produced in neutrophils with the main objective of defending the organism
against invasive microorganisms that cause infections, facilitating phagocytosis [28].
Under normal conditions, both elastases are well regulated through specific inhibitors
present in plasma (α1-antitrypsin for HPE and α2-macroglobin for HNE). However, in cases of deregulation by over-expression, severe permanent damages are observed like liver
failure, rheumatoid arthritis, psoriasis, arteriosclerosis, emphysema, cystic fibrosis and
asthma [11], [26], [27]. At present, several diseases affecting the respiratory tract are one of
the major causes of death in the world, so HNE is a therapeutic target with considerable
interest [30].
Great efforts have been applied over the last three decades to the development of
innovative elastase inhibitors. As can be seen from the various structures of
elastase-inhibitor complexes present in PDB, a number of novel synthesized compounds (peptidic
and peptidic derivatives) have been studied. However, there is currently only one
non-peptidic drug available in Japan and Korea used for the treatment of acute lung injury (ALI)
and adult respiratory distress syndrome (ARDS). As promising drugs, AZD9668 (Alveltat,
11 already in Phase II of the clinical trials for patients with bronchiectasis, cystic fibrosis, COPS
and lung diseases [31]. However, the synthesis of new compounds that have more specificity
and more efficacy for elastase is still being studied.
Because of its difficult purification and crystallization processes, it is usual to use
Porcine Pancreatic Elastase (PPE) as a model protein for HNE. PPE is a serine protease with
240 amino acids that shares 37% amino acid sequence identity (Figure 1.4.2) with HNE (218
amino acids) [5]. As explained above, since they are from the same protease family (serine
proteases), they both share the same catalytic center constituted by Ser-195, His-57 and
Asp-102 (catalytic triad, Figure 1.4.4). Despite the similarity, HNE is more hydrophobic and more
basic than PPE (Figure 1.4.3). This is because its amino acid sequence has a greater number of
hydrophobic components (> 40% compared to 30% of PPE) and its surface is constituted by a
greater number of basic than acidic amino acids (19 arginines versus 9 acidic residues). One
of the structural advantages of PPE is that its catalytic center is more accessible than HNE,
which is surrounded by 18 arginines, making it difficult for non-linear ligands to enter [28].
Figure 1.4.2 - Amino acid sequence alingment: PPE (PDB:3EST) vs. HNE (PDB: 3Q76) [5].
Figure 1.4.3 -Electrostatic potential map of HNE (Figure a, PDB: 3EST) vs PPE (Figure b, PDB:3EST)
12
Figure 1.4.4 - Structure superposition of PPE (PDB: 3EST, green) and HNE (PDB: 3Q76, orange), with an expansion of the active sites (rmsd=1.2774Å), [32], [33].
1.5
Crystallography
X-ray diffraction analysis by macromolecular crystallography requires the
presence of a vast number of molecules of the protein under study in the crystalline
state in order to amplify the generated signal [15].
The crystallization of a protein is based on the slow precipitation of each
individual molecule, in order to facilitate its ordering into a crystalline lattice. During
this procedure, there is the formation of hydrogen bonds between the side chain of
surface amino acids, and sometimes with water molecules/ions present in the
solvent, keeping most of the molecules (>
10
15) in the same orientation. By presenting
20-80% of the volume in the form of solvent channels, the crystal is shown to be a
sensitive structure but, on the other hand, it allows the interaction between the
protein and small molecules by the soaking technique (see details below) [15], [17],
[18].
Serine
195
Aspartate
102
13
Of all the crystallization methods (vapour diffusion, microbatch, free-interface
diffusion and microdialysis), vapour diffusion is the most commonly used. It consists
in the equilibrium of concentrations between two solutions in a closed system,
through evaporation of water from the less concentrated solution (drop) to the more
concentrated solution (reservoir). In this method, there are various possible
techniques having as a variant the shape of the drop. This variation will alter the
drop’s superficial area and tension, which will ultimately affect the equilibrium of
the system and the number of nuclei formed. Hanging and sitting drop are two of the
most widely used systems of the Vapor Diffusion method (Figure 1.5.1) [15].
Figure 1.5.1 - Representation of the vapour diffusion hanging drop and sitting drop methods [15].
For the formation of good quality crystals (large, single and with well-defined faces), it
is necessary to optimize the crystallization condition, in order to reach the Supersaturation
State. This state is divided into three zones: the Metastable Zone, the Nucleation Zone and
the Precipitation Zone (Figure 1.5.2). In the crystallization process, the drop needs to form
the first ordered aggregates in the Nucleation Zone (also known as Labile Zone), by the
increase of protein and precipitate concentration in the drop, during the evaporation. Then,
by the decrease of free protein concentration in the drop solution, crystal growth occurs in
the Metastable Zone [34].
At an initial stage, a crystallization screening is performed, varying the parameters of
the crystallization solutions that influence the appearance of crystals like: protein
concentration, precipitant type and concentration, pH and temperature. Commonly used
solutions as precipitants are salts, low molecular weight alcohols and polyethylene glycol
14
Figure 1.5.2- Phase diagram for crystallization [35].
When the crystallization conditions are not optimal, the time required for the
equilibrium between concentrations will be different than ideal. Lower equilibration times
tend to form amorphous precipitate, while longer equilibration times tend to form
micro-crystals[36].
In cases of clear drops (where the nucleation does not occur spontaneously), it is
necessary to promote nucleation by adding nuclei from protein crystals of previous assays
under similar conditions, that are already in the metastable state [15]. This technique is called
seeding and can be performed in three different ways:
Streak seeding: Based on touching the crystal already formed with a cat mustache, passing it quickly by at least three protein:precipitant clear drops(without crystals or precipitate), promoting this way nucleation (Figure 1.5.3)[15]
.
Figure 1.5.3 - Illustration of the streak seeding technique [37].
Microseeding: For this technique (Figure 1.5.4), previous grown crystals are
crushed in a crystallization solution, to generate a solution of microseeds. Then, this
same solution, or one of its dilutions (1:10, 1:100, 1:1000 or even 1:10000), is added to
15 Macroseeding: Although it is a technique to promote the nucleation of the
drop, the main objective of this one is the increase of the crystal size. For that, a
protein crystal is collect and directly added to a new clear drop (Figure 1.5.5).
Figure 1.5.5 - Illustration of the Macroseeding technique.
After knowing the optimized crystallization conditions of a protein, it is possible to
advance with studies of complexes. There are two possible techniques for the crystallization
of complexes:
Soaking: It is based on the diffusion of small ligands (size usually varies
between 20 and 100 Å) through the solvent channels in the crystal of the native
protein (Figure 1.5.6) [15].
Figure 1.5.6 - Illustration of the Soaking technique.
Drop with Native Protein Crystals
Drop With Complex Crystals Ligand Solution
Drop with Native Protein Crystals
Microseeds Solution
Drop with Native Protein Crystals
Drop of Crystallization Solution
Seed Bead Drop of Crystallization
Solution
16
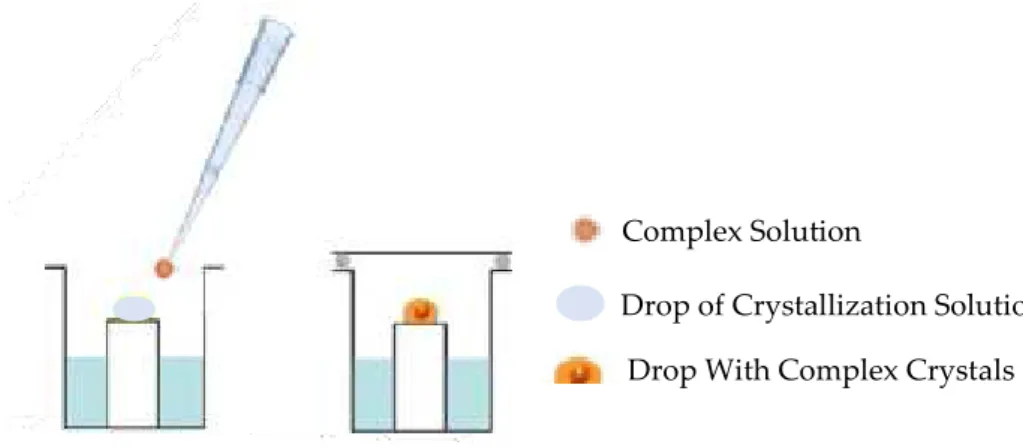
Co-crystallization: This technique requires the pre-incubation of the protein
with the ligand, in order to promote the formation of the complex prior to crystal
formation (Figure 1.5.7) [15]. This technique is most useful when the ligand of
interest is too big to diffuse through the solvent channels and its binding promotes
structural arrangements that might disrupt the crystals lattice or access to the active
site is limited by crystals contacts.
Figure 1.5.7 - Illustration of the Co-crystallization technique.
With the growth of a crystal from the macromolecule of interest, one essential step for
its structural analysis by X-ray diffraction is overcome.
The drying of the crystal causes the loss of the three-dimensional structure of the
macromolecule, which in turn affects its diffraction. There are several ways to prevent crystal
drying by keeping it surrounded with crystallization solution, right after its acquisition: in
quartz capillary (at room temperature), with a flash-cooled in liquid nitrogen (77K), in liquid
propane (150K) or with cryogenic nitrogen gas stream (100K) [15].
Keeping the crystal at low temperatures is one way to prevent the degradation by the
free radicals formed by the interaction of the X-ray beam with the crystal in the data
collection, which makes freezing techniques more advantageous [15].
To avoid the destruction of the internal order of the crystal by freezing the water
molecules present in the buffer solution, the crystal needs to be involved in a solution
containing cryo-protectors such as glycerol, PEG, sucrose or salts in an appropriate
concentration, so that a vitrification, rather than freezing, process occurs [13, [34].
Drop of Crystallization Solution Complex Solution
17
1.6
X-ray diffraction
Electromagnetic radiation is diffracted when it intersects with an object larger than its
wavelength. This is what happens when X-rays (0.1-100Ǻ) interact with electron clouds from
the atoms of a molecule (1 Ǻ) in their crystalline state, resulting in a diffraction pattern
(Figure 1.6.1).
Figure 1.6.1 - Illustration of a data collection [34].
All spots in a diffraction pattern (reciprocal space lattice) are characterized by an intensity
(Ihkl), a direction (Miller Indices: h,k,l) and a phase (α). Each spot corresponds to a Fourier
summation of the scattered waves with constructive interference, in phase with each other
(Bragg’s Law, Figure 1.6.2). Within this mathematical formulation, only a few directions of the diffracted beams are detected, which makes the diffraction pattern dependent on the
orientation of the crystal and the unit cell dimensions [34].
The unit cell (Figure 1.6.3) is the subunit that repeats along the crystal through
translational processes, maintaining the number and the arrangements of the asymmetric
unit (smaller fraction of the crystal) [15].
A B
Detector
Figure 1.6.2 - Conditions for diffraction [67]-[68].
18
Figure 1.6.3 - Crystal Packing [34].
This way, to start a data collection it is necessary to first characterize an orientation
matrix, by the determination of the parameters and the direction of the reciprocal unit cell
axes. For this, two or more images are indexed at 0 ° and 90°, relative to the axis
perpendicular to the X-ray beam. Through the resulting information, it is possible to identify
the Laue symmetry and the space group, which determine the three-dimensional
arrangement of the crystal (Bravais Lattice). After obtaining the orientation matrix, it is
possible to calculate the best strategy to collect a complete dataset with the smallest crystal
rotation avoiding radiation damage by overexposing the crystal.
Once calculated, the best strategy obtained is applied (Figure 1.6.4). The resulting
images from the diffraction patterns of all the unique orientations of the crystal are then
integrated and scaled together (data processing). Through the following parameters obtained
in this step, it is possible to perform a first analysis of data quality:
Resolution: Associated with the level of detail reached in the electron density
maps.
Completeness: Percentage of the unique reflections (theoretically estimated)
that were obtained experimentally.
Multiplicity: Estimation of the number of independent measurements for each
reflection.
Signal to noise ratio (σ(I)I ): Percentage of intensity obtained above noise level.
Merging R-factor (Rmerge): Agreement between the several independent
observations of the same reflection.
At this stage, we can obtain the information about the directions, the intensities and
hence calculate the amplitude of the structure factors (Equation 1.6.1). Translation of the unit cell
Assymetric Unit
Unit Cell
19 |𝐹𝑜𝑏𝑠|2= 𝐼ℎ𝑘𝑙
Equation 1.6.1 - Mathematical equation to obtain the structural factors amplitude from the intensities [34].
Figure 1.6.4 - Expected result in a crystallographic data collection for a three-dimensional analysis [34]. By measuring the diffraction in more than one orientation, it is possible to obtain a sphere of results, obtaining
three-dimensional coordinates for each reflection (h, k and l).
The equation to calculate an electronic density map is obtained by applying a Fourier
Transform to the structure factors equation (Equations 1.6.2). But for this, in addition to the
intensities, it is necessary to measure the phases of individual diffracted X-ray waves,
information which is lost during the data collection process (the so-called “Phase Problem”)
[34].
ρ(x, y, z) =
1V∑ |Fhkl| × e
hkl −2πi(hx+ky+lz−αhkl)⇔
⇔ ρ(x, y, z) =
1
V ∑ √I
hkl× e
−2πi(hx+ky+lz−αhkl) hklEquation 1.6.2 - Mathematical equation used to calculate the electronic density map [34].
In order to solve this problem, there are several methods for the estimation, or close
inference, of the phases. The choice of method to be used depends on the protein under
study:
In cases where an available structure of a homologous or similar protein
already exists in the PDB, a Molecular Replacement (MR) procedure may be used;
this method is based on the initial phase estimation of a new structure from a
known structure model. For this, it is necessary to perform the best match between
observed diffraction and the calculated diffraction, by testing all possible positions
20
molecule is defined by six parameters (a, b and c related to rotation and d, and
related to the translation), in order to make this search less exhaustive, most of the
programs divides this process into two steps: first, the best solutions for the rotation
function are search and then with these results, the search for solutions to the
translation function. After obtaining the best possible parameters, the resulting
phases of the known structure model and the amplitudes obtained in the data
collection are used to calculate the initial electronic density map.
In cases where the phases of some reflections already have starting values
associated or are already known, ab initio phase determination is used to deduce the
phases of the remaining reflections. For this method, widely used as a complement
to other methods to find the atomic substructures of heavy atoms, it is necessary to
obtain an atomic resolution better than 1.2 Å.
For the cases of proteins without known struturally homologous proteins, the
Multiple Isomorphous Replacement (MIR) and the Single Isomorphous
Replacement (SIR) are methods that can be used. These ones require the isomorphic
addition of heavy metals (Hg, Pt, Au, Pb or Ag) to the protein of interest, that is,
without interfering with neither its three-dimensional structure nor the dimensions
of the unit cell. Through the difference in the intensity of the diffracted beams in the
presence of heavy atoms compared to the native protein, it is possible to perform a
phase angles estimation.
In the case of metalloproteins or proteins with added metals (e.g. Fe, Cu, Mo,
Zn, or Ni), the methods of phase determination through anomalous scattering are
the most advisable. These include the single wavelength anomalous dispersion
(SAD) and the multiple wavelength anomalous dispersion (MAD). These use a
radiation with one (SAD) or more (MAD) wavelengths near the absorption edges of
the metal present in the protein, which causes a breakdown in Friedel's law (same
intensity for reflections with symmetric miller indices, hkl and –h-k-l), but also an
anomalous X-ray diffraction (with different phase and amplitude). From these
differences it is possible to determine the atomic substructure, from which the phase
can be estimated computationally for all the amplitude factors of the whole
21 anomalous dispersion can overcome the problems presented by the isomorphous
replacement methods. But on the other hand these have as a disadvantage the decay
of the crystal due to radiation damage. After obtaining the phases, the electron
density map is calculated (through Equation 1.6.3), followed by the model building
process.
ρ (x, y, z) =
1
V ∑ ∑ ∑ F
hkle
−2πi(hx+ky+lz) lk h
Equation 1.6.3 - Equation for the calculation of the electron density maps [34].
In the case of proteins whose phase was determined by the MR method, a previous
model is already available and model building is carried out to adjust/fit it into the electron
density maps.
If the obtained phases were obtained by one of the other methods (Anomalous
Scattering or Isomorphous replacement), the model has to start from scratch, according to
the electronic density map, since it has no model structure to follow.
After its construction by either methods, the model needs to be refined in order to
make it more consistent with the experimental data.
The refinement programs serve to optimize the agreement between the observed and
calculated structural factors amplitudes by the following parameters: three dimensional
coordinates, scaling factor, atomic occupation (fraction of crystal molecules in which a
certain atom occupies the position determined by the model) and atomic displacement
parameters, or B-factor, which correlates with the degree of mobility of an atom.
After each refinement cycle several validation parameters are obtained and used to
analyze the results:
RWork: percentage of the general relative discrepancy between the structure
factor amplitudes (observed and calculated).
Rfree: percentage of the relative discrepancy between the structure factor
amplitudes (observed and calculated), in a set that have never participated in the
calculation of the refinement (test set).
Model geometry: error identification related to stereochemistry, chemical
22
angles (Ramachandran plot), rotamer collection, among others, based on
comparison with dictionaries of standard geometrical data.
With the refinement process we intend to see an improvement of the model, which in
turn improves the phases and consequently the electronic density map. When, after the
application of several iterative refinement cycles, there are no longer significant changes for
the improvement of the model and the parameters of validation are of good quality (e.g. by
benchmarking with statistics of known structures with similar resolution), the
three-dimensional structure of the protein under study is terminated and then the structural
analysis of the protein can be started.
1.7
Synchrotron
There are currently several sources of X-rays: the sealed tube, rotating anode, liquid
anode, micro-source and synchrotron radiation source [7].
In comparison to the other sources, the synchrotron source (Figure 1.7.1) uses a very
small beam in an ultra-high vacuum environment with less divergence, more intensity,
highest polimerization and more brightness [38]. With these characteristics, the data
collection process is faster and more efficient, which makes it possible to analyze small
and/or weakly scattering crystals. Another advantage of this source is the possibility of
selecting a specific wavelength of the incident X-rays, which allows the application of more
specific studies such as anomalous dispersion experiments. As a disadvantage, by using a
more intense X-ray beam one has a greater chance of causing radiation damage in the sample
23 Figure 1.7.2 - Photographs of synchrotrons from where data were collected for this work [69], [70].
Figure 1.7.1 – General scheme of operation of a Synchrotron [39].
25
2.
Materials and Methods
2.1
Crystallization of PPE in the native state
Before initiating the structural characterization of elastase with inhibitors, it is
necessary to optimize the crystallization conditions in order to ensure that good quality
crystals of protein are obtained. For this, six different crystallization conditions, based on
previous reports ([30], [41]–[47]), were tested with the protein in the native state.
PPE (lyophilized) was purchased from SERVA Electrophoresis GmbH (Heidelberg,
Germany), and dissolved in double-distilled water to a concentration of 40 mg/mL, without
further purification. Since not all the reported conditions used the same concentrations of
protein, it was necessary to dilute the sample to the concentrations mentioned in Table 2.1.1.
All conditions were tested with both techniques (hanging and siting drop). In each well
500 µL of crystallization solution were added and a drop of 1 μL of PPE mixed with 1μL of
reservoir solution was dispensed using the hanging and sitting drop techniques.
Technique Hanging drop and Siting drop Vapour diffusion
Temperature (°C) 20
Protein Protein Buffer ddH2O ( Bidestilated water)
Reservoir Volume ( µL) 500
Crystallization
Solution 1
100 mM Sodium Acetate pH 5.2 200 mM Sodium Sulfate
Protein concentration (mg/mL) 20, 30 and 40
2
100 mM Sodium Acetate pH 5.2 50 mM Sodium Citrate
5 mM Calcium Chloride
Protein concentration (mg/mL) 12 and 30
3 50 mM Sodium Citrate Buffer pH 6 Protein concentration 40
4
300 mM Sodium Chloride 50 mM Tris-HCl pH 7
Protein concentration (mg/mL) 30 and 40
5
70% (v/v) 2-Methyl-2,4-pentanediol (MPD) 10 mM Sodium Phosphate Buffer pH 5.9 Protein concentration (mg/mL) 20
6
17% (w/v) PEG 3350 200 mM Bicine pH 8.1 60 mM Sodium Citrate
Protein concentration (mg/mL) 12, 20 and 30
Drop ratio ( µL) 1 protein + 1 reservoir
26
2.2
Crystallization of HNE in the native state
Similar to PPE, five crystallization conditions, inferred from previous reports ([6], [48]–
[50]), were tested with the protein in its native state, in order to obtain an initial
crystallization condition. HNE (lyophilized) purchased from Elastin Products Company
(Owensville, Missouri, USA) was dissolved in 20 mM Tris-HCl (pH 7.5) with 50 mM Sodium
Chloride (again based on the same literature information), for a concentration of 20 mg/mL,
without further purification. During this test, the concentrations of protein used (10-20 mg
/mL), the ratios of the drops (1:1 and 2:1) and the technique used (hanging or sitting drop),
were varied as mentioned in Table 2.2.1.
Table 2.2.1 - Summary of Human Neutrophilic Elastase (HNE) crystallization conditions.
Temperature (°C) 20
Protein
Protein Buffer 20 mM Trid-HCl (pH 7.5)
50 mM Sodium Chloride
Reservoir Volume ( µL) 500
Crystallization Solution
1
1.5 M Ammonium Phosphate (pH 7)
Protein concentration (mg/mL) 10, 15 and 20
Technique HD
Drop Ratio (µL) : 0.5 protein + 0.5 reservoir and 1 protein + 0.5 reservoir
2
20% (w/v) PEG8000 0.1 M HEPES (pH 7.5)
Protein concentration (mg/mL) 10, 15 and 20
Technique HD
Drop Ratio (µL) : 0.5 protein + 0.5 reservoir and 1 protein + 0.5 reservoir
3
2 M Sodium Formate (pH 4.5)
Protein concentration (mg/mL) 10, 15 and 20
Technique HD
Drop Ratio (µL) : 0.5 protein + 0.5 reservoir and 1 protein + 0.5 reservoir
4
28% (w/v) PEG4K 0.1 M Tris-HCl (pH 8.2) 0.7 M Lithium chloride
Protein concentration (mg/mL) 20
Technique HD and SD
Drop Ratio (µL) : 1 protein + 0.5 reservoir
5
Drop: 0.6 M Sodium Phosphate (pH 5) 70 mM Sodium Chloride
Reservoir: 1.5 M Sodium Phosphate (pH 5) Protein concentration (mg/mL) 20
Technique HD
27 In order to increase the stability of the protein,reducing the possibility of undergoing
inactivation by autolysis and / or proteolysis, another protein batch was dissolved in 20 mM
Bis-Tris (pH 6) with 50 mM sodium chloride, to a concentration of 15 mg /ml. With this
sample, four crystallization screens were carried out: Salt Rx (from Hampton Research),
ShotGun, PACTPremier and BCS (all from Molecular Dimention).
2.3
Biochemical characterization
Determination of the final concentration of HNE was performed by the Bradford
method and analysis of its purity by SDS-PAGE.
2.3.1
Bradford method
This procedure was started with the determination of a calibration curve. For this,
several dilutions of a standard protein (Bovine Serum Albumin, BSA) were performed in the
buffer of the protein under study. For each of them triplicates were prepared in a 96-well
immune flat-bottom plate, each with 150 μl Coomassie plus (Bradford) assay reagent (from
Thermo Fisher Scientific) and 5 μl of the respective dilution. After 30 minutes of incubation,
the absorbances of the resulting samples from each well were measured at 595 nm using a
BMG FluoSTAR Optima plate reader. Data were processed in the equipment's data analysis
software (MARS Data Analyse Software version 2.10), obtaining, with the averages of the
triplicates of each solution, the calibration curve.
At the same time, similar procedure was applied to the dilutions of the protein under
study (dilution of 1:5, 1:10 and 1:100). Using the average of the three results obtained for each
dilution, it was possible to estimate, from the calibration curve, the total concentration of the
28
2.3.2
Electrophoresis (SDS-PAGE)
In the sample preparation process, the HNE solution was centrifuged for 15 minutes at
15000 rpm in a 5424 R centrifuge (Eppendorf). As a result the formation of a pellet was
observed.
For the SDS-PAGE procedure it was prepared: one sample of 20 µL with 0.15 mg/ml of
HNE in 1x Loadding Buffer solution (50 mM Tris-HCL, pH 6.8; 2% SDS; 0.025%
Bromophenol Blue; 10% Glycerol and 12.5% β-mercaptoethanol) and one sample of 20 µL
with 1uL of the pellet dissolution (in 50 µL of protein buffer) in 1x Loading buffer solution.
Before being loaded onto Amersham ECL Gel 8-16%, (of 10 wells), both solutions were
subjected to 6 minutes of incubation at 95° C.
In addition, the same gel was also loaded with 5 μl of PageRuler Plus Prestained
Protein Ladder (marker from Figure 2.3.2.1).
Figure 2.3.2.1 - PageRuler Plus Prestained Protein Ladder (marker) [51].
After loading, the gel was run at a constant voltage of 160 V. Then, two gel washes of
the 10 minute in bi-distilled water were performed, followed by a 30 minute with Coomassie
(from Biorad) staining and another two washes of 10 minutes in bi-distilled water. Finally, a
scanner was run through the ImageScanner III, using the Coomassie filter of LabScan 6.0
29
2.4
Micro-seeding with native crystals
Some native crystals of PPE were collected from crystallization dropplets (Figure
3.1.1.3(a) and 3.1.1.8(a)) with a micro-pipette into 50 μl of crystallization solution in an
eppendorf with a Seed Bead® (Molecular Dimensions), in order to prepare the seeds for
microseeding. Then the solution was vortexed twice for 40 seconds, with an interval of 10
seconds of incubation on ice between them. From the resulting solution, various dilutions
were prepared (1:102, 1:103, 1:104 and 1:105). New drops were prepared in a sitting drop vapor
diffusion experiment, using 1 μL of PPE, 0.8 μL crystallization solution and 0.2 μL of
microseeds dilution solution.
2.5
Soaking of the native crystals with the Inhibitors
The best native crystals of PPE were obtained in condition 5 composed of 70% MPD
and 10 mM Sodium Phosphate Buffer pH 5.9. To some of these drops 1 μL of solution with
100 mM of Ligand (Figure 2.5.1) dissolved in 100% (v/v) Dimethylsulfoxide (DMSO) was
added, to obtain around 5X of molar excess ([PPE] ~7,69 × 10⁻⁴M). After the ligand
addition, the drop was left overnight at room temperature, in order to allow the ligand to
diffuse through the solvent channels present in the crystal.
Figure 2.5.1 - Ligands synthesized by the group of Rui Moreira, Faculdade de Farmácia, for Pancreatic Porcine Elastase, used in the technique of soaking.
30
2.6
Co-crystallization with the inhibitors
In parallel with the soaking experiments, several co-crystallization tests were carried
out for PPE. During these assays two different molar excess (4X and 6X) of ligands (Figure
2.6.1) were incubated with the protein for 45 min at a room temperature (with a final DMSO
concentration of 5%) prior to the crystallization experiments.
For the assays with HNE, only a molar excess of 7X was tested with the ligand
displayed in Figure 2.6.2. Here, the ligand solution (final concentration around 5 mM in 5%
DMSO) was added to 20 mg/mL HNE solution.
After an incubation of approximately one hour, at room temperature, the
crystallization drops were prepared with several ratios between the incubated sample
(protein + ligand) and crystallization solutions (1:1, 1:2 and 2:1) for a hanging and a sitting
drop vapor diffusion experiments.
Figure 2.6.1 - Ligands synthesized by the group of Rui Moreira, Faculdade de Farmácia, for Pancreatic Porcine Elastase, used in the method of co-crystallization.
Figure 2.6.2 - All the ligands synthesized by the group of Rui Moreira, Faculdade de Farmácia, for Human Neutrophil Elastase.
2.7
X-ray diffraction Data Collection and Processing
In this work, the X-ray diffraction experiments were only performed with the crystals
of the PPE complexes.
In order to carry out the data collection process, the crystals were removed from the
crystallization drop with a loop and then frozen and stored in liquid nitrogen (100K). For the
crystals of PPE crystallized under condition 5, no cryoprotective solution was required since
70% MPD is already a cryoprotectant. However, the crystals of condition 1 (100 mM Sodium
Acetate pH 5.2 and 200 mM Sodium Sulfate) required the supplementation of the
31 X-ray data for this study were collected on ID23-1 and ID30A-3 beamlines at the
European Synchrotron Radiation Facility (ESRF) in Grenoble (France) and beamline I03 of
Diamond Light Source in Didcot (Oxforshire - United Kingdom).
The data collected at ESRF were processed through the autoPROC pipeline [52] using
the programs XDS, for the indexing and integration [53], SCALA/AIMLESS for the scaling
[54] and POINTLESS for space-group determination [55]. The data collected at Diamond
were processed with the Xia23dii pipeline [56] which also uses the program XDS to index
each measured reflections, but for scaling uses the XSCALE program [57].
The structures were determined by molecular replacement performed with PHASER
as implemented in the PHENIX suite of programs [58], using the coordinates of the complex
PPE-JM102 (PDB entry 4YM9 [59]) devoid of any solvent or ligand molecules.Iterative cycles
of model building and refinement with COOT [60], [61] and phenix.refine, also from the
same suite of programs, were performed until convergence. MolProbity [47], as implemented
in PHENIX, together with PROCHECK [62], and WHATCHECK [63], from the CCP4 suite
33
3.
Results and Discussion
3.1
Structural analysis of PPE complexes
3.1.1
Crystallography, Data collection and Processing
The crystallization process, as already mentioned in the working methods, started with
the attempt to reproduce six crystallization conditions that had already been reported in the
literature for this protein. Several drops were made under these conditions varying the
method used (hanging or sitting drop), protein concentration (ranging from 12-40 mg/mL),
maintaining the drop ratio (1:1) and the crystallization temperature (20 °C).
After 5 days of incubation, it was possible to observe a crystalline material in condition
5 (70% MPD with 10 mM Sodium Phosphate Buffer pH 5.9, in a sitting drop format using
PPE at 20 mg/mL - Figure 3.1.1.1(a)) and, after 14 days in condition 2 (100 mM Sodium
Acetate pH 5.2 with 50 mM Sodium Citrate and 5 mM Calcium Chloride in Sitting drop with
30 mg/mL of protein – Figure 3.1.1.1(b)).
Figure 3.1.1.1 - Native PPE crystals obtained in a screen of conditions (Vapour Diffusion Sitting Drop).
(a) - Crystal of condition 5 with a drop ratio of 1:1, 20 mg/mL of protein, at 20°C; (b) - Crystal of condition 2 with a drop ratio of 1:1, 30 mg/mL of protein, at 20°C.
After careful analysis, it was decided to purpose the work with condition 5, being the
least aqueous solution of all, facilitating the solubility of the compounds in question
(hydrophobic compounds) for the complex crystallization. Since the parameters of the
protein concentration and the crystallization method had already been optimized with the
first assay, only the optimization of the precipitant percentage of the condition was required.
![Figure 1.1.1 - Energetic profile of enzymatic and non-enzymatic reactions [17].](https://thumb-eu.123doks.com/thumbv2/123dok_br/16476238.732046/20.892.269.664.585.910/figure-energetic-profile-enzymatic-non-enzymatic-reactions.webp)
![Figure 1.3.1 - Catalytic mechanism of serine proteases [27].](https://thumb-eu.123doks.com/thumbv2/123dok_br/16476238.732046/27.892.170.759.176.913/figure-catalytic-mechanism-serine-proteases.webp)

![Figure 1.4.4 - Structure superposition of PPE (PDB: 3EST, green) and HNE (PDB: 3Q76, orange), with an expansion of the active sites (rmsd=1.2774 Å ), [32], [33]](https://thumb-eu.123doks.com/thumbv2/123dok_br/16476238.732046/30.892.112.857.112.508/figure-structure-superposition-green-orange-expansion-active-sites.webp)
![Figure 1.5.2- Phase diagram for crystallization [35].](https://thumb-eu.123doks.com/thumbv2/123dok_br/16476238.732046/32.892.258.681.110.393/figure-phase-diagram-crystallization.webp)

![Figure 1.6.4 - Expected result in a crystallographic data collection for a three-dimensional analysis [34]](https://thumb-eu.123doks.com/thumbv2/123dok_br/16476238.732046/37.892.306.619.201.441/figure-expected-result-crystallographic-data-collection-dimensional-analysis.webp)
![Figure 1.7.2 - Photographs of synchrotrons from where data were collected for this work [69], [70]](https://thumb-eu.123doks.com/thumbv2/123dok_br/16476238.732046/41.892.251.642.112.384/figure-photographs-synchrotrons-data-collected-work.webp)

