Repositório ISCTE-IUL
Deposited in Repositório ISCTE-IUL: 2020-03-10Deposited version: Post-print
Peer-review status of attached file: Peer-reviewed
Citation for published item:
Moro, S., Esmerado, J., Ramos, P. & Alturas, B. (2019). Evaluating a guest satisfaction model through data mining. International Journal of Contemporary Hospitality Management. N/A
Further information on publisher's website: 10.1108/IJCHM-03-2019-0280
Publisher's copyright statement:
This is the peer reviewed version of the following article: Moro, S., Esmerado, J., Ramos, P. & Alturas, B. (2019). Evaluating a guest satisfaction model through data mining. International Journal of Contemporary Hospitality Management. N/A, which has been published in final form at
https://dx.doi.org/10.1108/IJCHM-03-2019-0280. This article may be used for non-commercial purposes in accordance with the Publisher's Terms and Conditions for self-archiving.
Use policy
Creative Commons CC BY 4.0
The full-text may be used and/or reproduced, and given to third parties in any format or medium, without prior permission or charge, for personal research or study, educational, or not-for-profit purposes provided that:
• a full bibliographic reference is made to the original source • a link is made to the metadata record in the Repository • the full-text is not changed in any way
The full-text must not be sold in any format or medium without the formal permission of the copyright holders.
Serviços de Informação e Documentação, Instituto Universitário de Lisboa (ISCTE-IUL) Av. das Forças Armadas, Edifício II, 1649-026 Lisboa Portugal
Phone: +(351) 217 903 024 | e-mail: [email protected] https://repositorio.iscte-iul.pt
Evaluating a guest satisfaction model through data mining
Abstract Purpose
This study proposes a data mining approach to evaluate a conceptual model in tourism, encompassing a large dataset characterized by dimensions grounded on existing literature.
Design/methodology/approach
The approach is tested using a guest satisfaction model encompassing 9 dimensions. A large dataset of 84k online reviews and 31 features was collected from TripAdvisor. The review score granted was considered a proxy of guest satisfaction and was defined as the target feature to model. A sequence of data understanding and preparation tasks led to a tuned set of 60k reviews and 29 input features which were used for training the data mining model. Finally, the data-based sensitivity analysis was adopted to understand which dimensions most influence guest satisfaction.
Findings
Previous user’s experience with the online platform, individual preferences, and hotel prestige were the most relevant dimensions concerning guests’ satisfaction. On the opposite, homogeneous characteristics among the Las Vegas hotels such as the hotel size were found of little relevance to satisfaction.
Originality/value
This study intends to set a baseline for an easier adoption of data mining to evaluate conceptual models through a scalable approach, helping to bridge between theory and practice, especially relevant when dealing with Big Data sources such as the social media. Thus, the steps undertaken during the study are detailed to facilitate replication to other models.
Keywords
Customer satisfaction model; guest satisfaction; online reviews; data mining; model evaluation.
Introduction
Traditionally, empirical research in social sciences is based on primary data collected and analyzed in order to answer research questions and evaluate proposed conceptual models (Gebremedhin and Tweeten, 1994). In tourism and hospitality, a large majority of researchers adopts similar approaches to answer a myriad of research problems. However, the emergence and adoption of the Internet and, particularly, the advent of social media gave rise to a world thriving in Big Data, where consumers become users of online platforms to share their opinions and to read what others have written before making a decision (Schroeder, 2014). Both scholars and practitioners are taking advantage of this new world by using secondary data to answer important research questions. Yet, collecting and analyzing such massive amounts of data raises new challenges that need to be addressed in order to achieve insightful results. Data mining helps both scholars and practitioners in extracting patterns from a large dataset, including not only many occurrences of the problem, but also a large list of features, or variables, related to the problem (Maimon and Rokach, 2005). Thus, data mining assists in understanding a given phenomenon for which there is past data available.
This study brings a systematized guide for adopting data mining to tourist and hospitality researchers. The approach is instantiated through the evaluation of a guest satisfaction model encompassing nine relevant dimensions previously identified in the literature, but which have never been brought together to understand which most influences guest’s satisfaction. The case of hotels located in Las Vegas Strip is addressed, and a total of around 60k online reviews published in TripAdvisor are collected to evaluate the model, using the review score as a proxy of guest’s satisfaction. By illustrating how data mining can be used to evaluate a conceptual model, this study aims to build a straightforward bridge between theory and practice grounded on Big Data.
Background
Social media data in tourism
The Internet revolution and, specifically, the Web 2.0 paradigm has brought a new wave of online platforms, leading to an online social media world, where each individual plays a role as both a contributor and a reader of contents. The tourism industry has been at the
forefront of this revolution by offering and taking advantage of online reviews platforms such as TripAdvisor and Yelp (Yang et al., 2017). Social media results in massive volumes of data from tourists who wish to share their experiences with others, which, in turn, are influenced in their future behavior (Litvin et al., 2018). Social media data can be manually collected since it is often freely available by accessing the platform, and even if in some cases it requires user authentication, those credentials are provided freely. Yet, for effective extraction of loads of data, manual collection is not a viable option. Alternatively, some platforms such as the renowned social networks Facebook and Twitter make available an API (Application Programming Interface) that enables users to effectively extract data. For platforms that do not offer this possibility, the alternative is using web scraping, which consists in developing an automated process (often by implementing a script) that mimics a user by going through a list of URLs to read the available data.
Managers from organizations linked to tourism such as tourist offices and hoteliers have become aware of the importance of analyzing social media data to understand the customer perspective, whether as a guest of an accommodation unit or a visitor to a local attraction (Leung et al., 2013). Therefore, customer relationship management (CRM) solutions are currently extracting insights from social media to enhance their capabilities of providing an integrated tourist perspective (Trainor et al., 2014). Scholars in hospitality and tourism have kept pace by collecting such data to address important challenges related to tourist behavior (Di Pietro et al., 2012) and to brand strategies and positioning in those platforms (Leung et al., 2013). Thus, no key player in tourism can afford to neglect social media data, which is pivotal in the tourism ecosystem.
Tourism organizations and companies aiming to take advantage of social media data need to address important challenges such as data volume and speed. In fact, social media is one of the sources that generates more of what is now called Big Data (Park et al., 2016). This new paradigm raises the need for data storage and processing solutions to a previously unforeseen level, so that organizations can turn raw data into useful knowledge. Specifically, in tourism and hospitality the overflow of information contributed by users worldwide in social media platforms has been adopted to study hotel performance (Kim and Chae, 2018), the influence of managers’ response to online reviews helpfulness (Kwok and Xie, 2016), characterize tourist flows (Chua et al., 2016), and niche tourism destination online reputation management (Cillo et al., 2019). The
large amount of unstructured data in social media demands for computerized approaches that can process and summarize information to be easily interpreted and used by managers for a knowledgeable decision process.
Data mining and tourism
Data analytics includes all tasks aiming to derive patterns of knowledge from large sets of data which can be translated into useful insights to leverage decision making (Tyagi, 2003). Data mining, in turn, is encompassed in data analytics and it is focused on the implementation of the process of data analytics, prescribing a series of steps which include business understanding, data understanding and preparation, modeling and evaluation, and knowledge extraction and implementation (Fayyad et al., 1996). Data mining methodologies such as the CRISP-DM (Cross-industry standard process for data mining) are typically cyclic, involving several iterations to improve the robustness of the knowledge extraction process (Chapman et al., 2000). Although data mining has been around for quite a while, its use has recently been potentiated by the emergence of Big Data.
To identify useful patterns, data mining borrows from both the statistical and artificial intelligence domains to build models where an array of input variables, or features, are used to train a model using a suitable algorithm. If the problem has a known target, i.e., a feature that characterizes the problem (e.g., predicting the number of sales of a product), then it is a supervised learning problem; else, it is an unsupervised learning problem (e.g., identify segments of related customers) (Witten et al., 2016). In supervised learning, if the target feature is categorical, then it is a classification problem; else (for a numerical target feature), it is a regression problem. Yet, as Domingos (2012) noted, there is much more to data mining than just training a model. The data used as input is a key asset and, specifically, the features used to characterize each instance (row of the dataset) of the problem. Thus, feature selection and engineering is regarded by the same author as a pivotal step toward an accurate model.
Tourism researchers acknowledge the value of data mining for leveraging understanding of a myriad of problems within tourism. Thus, the recent years have witnessed a large increase in data mining applications to hospitality and tourism. A decision tree (DT) is a simple yet effective data mining modeling technique that creates a tree-like model where each node represents a decision using the input features until a leaf with a prediction is reached. Shapoval et al. (2018) adopted a DT to analyze secondary data on 4,000 tourists obtained from the Japan Tourism Agency about tourists visiting Japan. Features such as food and nationality were found relevant to explain tourist satisfaction. Alternatively, artificial neural networks (ANN) attempt to mimic the neurons and synapses that form the complexity of the human brain (Heidari et al., 2016). Thus, layers of nodes (neurons) make simple decisions that are combined through connections between nodes, resulting in models that can apprehend non-linear relations and therefore usually have better predictive performance. Phillips et al. (2015) adopted ANN to understand the effects of 60k online reviews in the performance of 235 Swiss hotels using ten features related to hotel characteristics and revenue. Another effective data mining technique that has been applied to tourism is support vector machines (SVM). SVM transforms the complex 𝑥 ∈ 𝑅𝑀 input space into a high m-dimensional feature space by applying a nonlinear mapping. Then it finds the best hyperplane that separates the input feature space by using points which define a support vector (Moro et al., 2017). Trpkovski et al. (2018) used SVM to evaluate photo quality using 9,448 photos posted on TripAdvisor and characteristics such as contrast and brightness. Thus, data mining can help in shaping new horizons in the tourism research landscape by leveraging understanding of problems within tourism based on data.
Despite the recognized usefulness of data mining by tourism researchers, a large majority of the published empirical literature in tourism and hospitality is still built on traditional approaches based on primary data collected through questionnaires and analyzed using statistical techniques (Khoo-Lattimore et al., 2017). The difficulty in understanding the data mining process poses a serious challenge for tourism researchers to overcome. Specifically, advanced artificial intelligence techniques which lead to accurate models have the drawback of being difficult to interpret (Cherkassky and Dhar, 2015). Nevertheless, there are methods to open these black box models such as sensitivity analysis, which assesses the output variability of supervised learning models when the input features are changed through their range of possible values (Cortez and Embrechts,
2013). Thus, by understanding how much each input feature to be tested contributes to the target in terms of percentage relevance, and by assessing how the target is affected by that feature, sensitivity analysis helps in bridging between theory and practice.
Proposed model and data mining approach Guest satisfaction model
Customer satisfaction is an important measure of an organization’s health and its future prospects, providing many benefits such as customer loyalty and increased reputation (Fornell, 1992). There are several dimensions known to influence customer satisfaction, and the tourism literature has already explored them to understand tourists’ perceptions. One of the most effective measures of user satisfaction is to understand customer feedback in social media, given that users express their opinions freely without being induced by third-parties, as it happens with surveys (Schegg and Fux, 2010). Online reviews platforms especially devoted to tourism enable guests to write their opinions and to score the units where they stay during their trips through an integer scale score. The textual comments of online reviews have been extensively analyzed by previous studies. The unstructured nature of text leads to results which depend on what each individual guest has freely chosen to write. For example, Li et al. (2013) unveiled categories of words such as “logistics”, “facilities”, and “reception services” from reviews extracted from daodao.com (TripAdvisor brand in China), whereas Xiang et al. (2015) found that domains such as “deal”, “amenities”, and “family friendliness” have an influence in the perceived guest satisfaction in an analysis of reviews obtained from Expedia. In comparison to text analysis, fewer studies have devoted attention to the influence of quantitative features in the score. Yet, as acknowledged by Moro et al. (2017), the score can be considered a proxy of guests’ satisfaction, whereas other quantitative features also play a role in satisfaction.
Table 1 highlights a list of nine dimensions drawn from quantitative features known to influence customer satisfaction based on previous studies conducted under the context of TripAdvisor. The amenities are known to influence tourist satisfaction from studies confirming common sense, i.e., that hotels delivering more and better amenities have more satisfied guests (Choi and Chu, 2001). Likewise, a higher number of stars is translated into a higher satisfaction, according to Bulchand-Gidumal et al. (2013). Other
factors known to influence guest satisfaction from previous studies include hotel size, guest’s nationality, and seasonality. To add to these factors, the power that social media has on travelers and, particularly, TripAdvisor has recently been proved by scholars, reflected by the experience the user has with the online review platform, including the number of written reviews, and the badges granted by TripAdvisor per accomplishment (Moro et al., 2019). Based on those nine dimensions from Table 1, this study proposes a guest satisfaction model to illustrate a data mining approach within tourism and hospitality research (Figure 1). Nevertheless, it should be noted that this model is based on dimensions for which there is data available in TripAdvisor. Next section is devoted to explaining how a data mining approach can be adopted to evaluate the proposed model.
Methodology
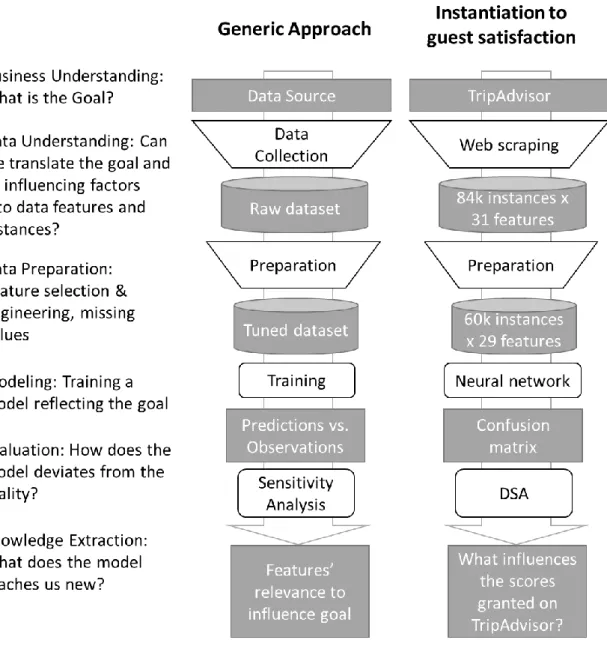
The first step in a data mining procedure is to define the problem and characterize its goal. In this case, the target feature is to model online reviews granted scores, which acts as a proxy for guest satisfaction. Additionally, the input features that characterize the problem and are likely to influence the target feature need to be identified based on the dimensions from the conceptual model (Figure 1). The studies cited on the third column of Table 1 are built upon empirical data analyses and enable to understand how each dimension can be measured (e.g., number of rooms to measure hotel size, according to Radojevic et al., 2017). The challenge of defining and characterizing a problem corresponds to the first stage of a data mining approach. Figure 2 shows the full procedure. In the left column, the six stages prescribed by the CRISP-DM methodology are shown. The last stage is a knowledge extraction, instead of being an implementation stage, as it is indicated in CRISP-DM. This change was done to align the procedure with a research project, where the goal is to understand a phenomenon, instead of a corporative project, where the final goal is the implementation of a system that helps decision makers. The middle column of Figure 2 shows how the generic approach effectively works, while the last column instantiates it to specifically deal with the guest satisfaction problem in hospitality. Considering the nine dimensions from Table 1, the selected features need to translate the problem for a comprehensive characterization according to those dimensions. TripAdvisor, one of the information-richest online reviews platforms, was selected because not only it provides an extensive list of features, but also was the chosen platform
for the empirical studies cited in Table 1. Thus, the data mining goal can be set to model the TripAdvisor granted score. This feature is one of five numbers, and thus it may be regarded as a numeric feature, making of it a regression problem. Nevertheless, it may also be considered a categorical feature composed of five distinct categories. In this study, the latter option was chosen, to enable to distinguish the accuracy in different classes, as it will be shown further ahead.
Since data mining aims at detecting patterns of knowledge from raw data, a larger set can better represent a problem by including more diversity of occurrences of that problem (in this case, online reviews). Thus, this study uses data collected automatically from TripAdvisor for retrieving a large compilation of reviews freely written by guests and which are freely available to readers without the need for authentication on TripAdvisor. Specifically, a web scraping script was developed using the R statistical tool and the “rvest” package. This is an important improvement to previous studies that were restricted to samples collected manually of a few hundred of instances of the problem, in this case, reviews published on TripAdvisor (e.g., Moro et al., 2017). Yet, TripAdvisor holds an immense volume of information about accommodation units, restaurants and attractions. Thus, this study focused on the Las Vegas Strip, an avenue where some of the largest hotels in the world are located. Specifically, the same 21 hotels chosen by Moro et al. (2017) were selected. However, a total of 83,688 reviews were collected, instead of just the 504 reviews collected by the cited study. Also, this study includes a wider range of dimensions. Still, before developing the web scraping script, the dimensions from Table 1 needed to be translated into available features on TripAdvisor. This is a limitation of using secondary data from social media, since only features that are exhibited on the online platform can be used. These tasks are encompassed in the data understanding phase and intend to answer how the problem can be characterized through the available data. Thus, a total of 40 features were collected, including the score granted on TripAdvisor. The next stage is to prepare a dataset that can be directly used as input to train a model. There are several important issues to handle in this stage. First, the relevant features need to be selected. There are several features that were collected but which render useless for data mining, since they do not conceal any real aggregating value. These include identifiers (e.g., TripAdvisor member username) and features which are always the same (e.g., staff fluent in several languages). Another important issue is to deal with missing values. As with features whose values are constant, these also do not hold any significant
value for modeling, and thus need to be dealt with. Although there are several imputation techniques for missing values, these can also amplify the error of the model because they consist of artificially come up with values for those cases where they are missing. The advantage of having collected a large number of instances is that in some cases those containing missing values may be omitted without affecting the algorithm’s capability of training an accurate model. In the collected dataset, one of the features - the visitor’s place of origin - is not mandatory when he/she is writing the review. Thus, it quite often happens that this value was missing. Additionally, outliers were discarded for the quantitative features (e.g., users with TripAdvisor points highly unusual), whereas further data analysis unveiled the inexistence of highly unbalanced categorical features. The result was a dataset with 60,428 instances without missing values.
Still in the data preparation stage, an important issue to be considered is feature engineering (Domingos, 2012). Several features need to be computed to represent meaningful and valuable features in terms of modeling. One of the most usual is date. The member registration date by itself is useless, because it is likely to be different for most members. Likewise, the date when the travel originating the review occurred also renders useless. However, both can be used to compute the number of months since registration on TripAdvisor until the review, i.e., the age as a member. Another example is the date when the review was written, which was used to compute the weekday of the review. Sometimes feature engineering is not so trivial. In this study, the place of origin of the user is a feature resulting from free input text from the user. The problem with it is that it assumes a large number of different values, as each user writes differently the same information (e.g., “USA”, “United States”, “U.S.” are all meant to be the same). Thus, as it is, this feature is useless. A series of regular expressions were computed into an R script to search for this feature’s values and then compute the country and the continent of the user. Still, more than one hundred countries were identified. Therefore, besides continent, an additional value was computed that indicates if the user is a United States resident or not. This was decided after checking that more than half of the reviewers are from the US. Thus, one can hypothesize that foreigners may have a different perception of Las Vegas.
In TripAdvisor, a reviewer can optionally score six distinct aspects besides granting the overall score: service, sleep quality, value, location, rooms, and cleanliness. While those scores cannot be used to model the overall score, which is naturally induced by the
experiences the guests had in specific aspects, one can use such information to understand to which aspects the visitor gave especial attention by scoring them. Thus, six individual new binary features were computed to assess if the aspect was scored by the visitor, considering all aspect scores are optional. The same names of the TripAdvisor aspects were given to the features for easier understanding; yet, the values of these new features are binary: “Y” if the visitor scored that aspect, or “N” otherwise.
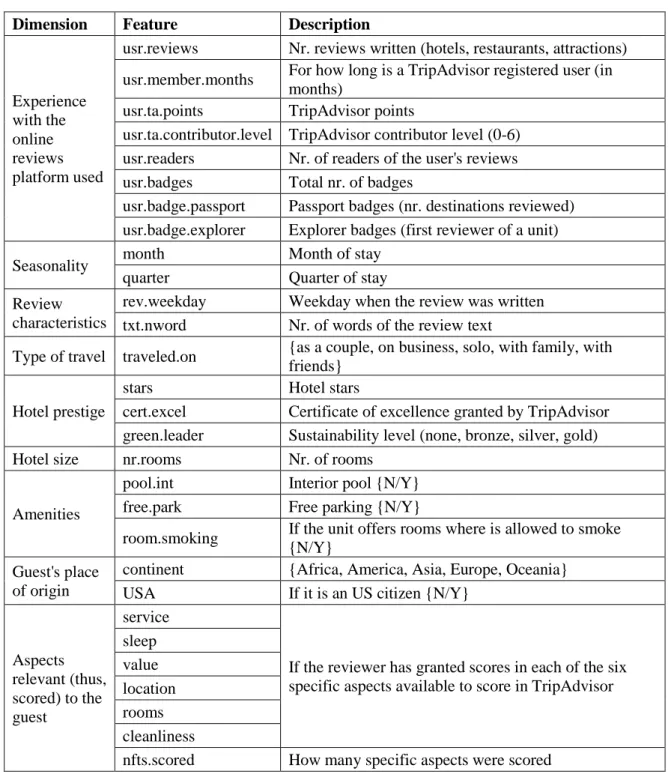
Table 2 shows the final 29 input features used to model the score under the nine dimensions. In practice, both the data understanding, and data preparation stages are the ones that require the most creativity, since there are no straightforward answers, and solutions mostly depend on the problem and the available data, making these two stages the most time consumption ones in a data mining project (Nguyen et al., 2019).
After preparing a tuned dataset, the next stage is to use it for modeling the problem. In this case, the trained model is a classifier, i.e., it classifies the scores granted on TripAdvisor based on the input features (Table 2). A wide range of effective techniques can be used for modeling. In this case, the goal of this study is not to test several modeling techniques and compare them; rather, it is to describe how to test a proposed model using a full data mining procedure. Thus, the multilayer perceptron was adopted, because it is known to train efficient and accurate classification models (Heidari et al., 2016; Moro et al., 2019). This technique is a model grounded on ANN theory using a backpropagation scheme to build a feed forward network. To train the model, the “rminer” package from the R statistical software was adopted, considering it offers a simple and effective set of functions devoted to data mining (Cortez, 2010).
Results and discussion
Previous section showed the proposed model on guest satisfaction and introduced the data mining approach to validating it (Figure 2). It was essentially devoted to the first four stages of the process, i.e., business understanding, data understanding, data preparation, and modeling. In this section, the next two stages, evaluation, and features’ relevance, are described, because these two include analyzing the results.
The evaluation of a data mining model results from testing the model using previously unforeseen instances (in this case, reviews), i.e., that were not used to train the model.
Based on the collected dataset, a k-fold cross validation was adopted. This technique consists in splitting the dataset into k folds of reviews of equal size and, using k iterations (Romão et al., 2019). In the first iteration, the model was trained using the first k-1 folds and leaving out the last fold for assessing the model’s accuracy. In the next iterations, the fold used for testing the model is rotated until all folds have been used k-1 times for training a model and once for testing. Thus, the evaluation metrics are obtained using predictions for all reviews.
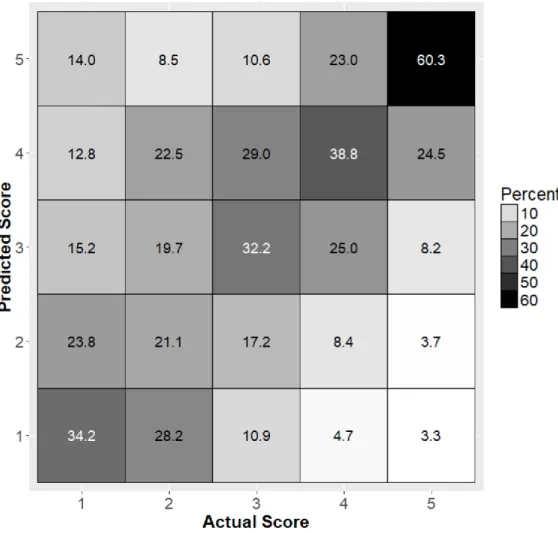
In a classification problem, the model’s output per instance is the probabilities of belonging to each of the output classes. Based on those probabilities, there are several metrics that can be computed to assess model’s performance in modeling the reality. Thus, if, for each instance, the class with the highest probability is chosen as an output prediction, then a confusion matrix can be plotted to show how the predicted values deviate from the real ones. Figure 3 shows that matrix in percentage values related to accuracy in predictions. Thus, the score one was correctly predicted 34.2% times. To facilitate reading, a heat signature was used, with darker tones for higher values (Gonçalves et al., 2018). An ideal model would have the cells in the diagonal mapping the same predicted and real values in black and with 100% values. Nevertheless, the diagonal displayed in Figure 3 is darker than the remaining cells, showing accuracy in approximately predicting the granted score. The area under the receiver operating characteristic (ROC) curve (AUC) is a key metric according to existing literature to evaluate a model’s performance (Bradley, 1997). The ROC curve is computed based on values within the confusion matrix. An AUC of 0.5 represents a random guess model, while 1.0 is the ideal model. The AUC computed for the trained model is of 0.72, which is better than some models reported on data mining literature (e.g., Baecke and Bocca, 2017, obtained an AUC of 0.62).
The last stage of the data mining procedure is knowledge extraction. After assuring that the trained model achieved good accuracy, i.e., that it accurately models the problem being addressed based on the selected input features, it is key to understand how each feature contributes to the model. Thus, by assessing features’ relevance, both scholars and practitioners can discern what influences guest satisfaction, which can leverage decision making. This study proposes using the data-based sensitivity analysis (DSA), which was first introduced by Cortez and Embrechts (2013) and has since been applied to wide number of cases, including tourism (e.g., Moro et al., 2017), civil engineering (Tinoco et
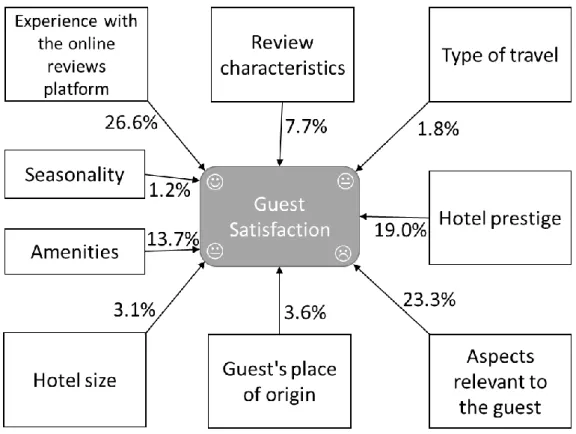
al., 2017), and marketing (Romão et al., 2019). The DSA takes a randomly selected sample of data from the training dataset, and then uses it by simultaneously varying the input features through their range of possible values to assess output sensitivity to such input changes (Cortez and Embrechts, 2013). Therefore, it enables to assess how combinations of changes in input features affect the outcome without the computational weight of testing all possible input features variations, which renders unfeasible even for a small number of features. Using such approach, the model defined in Figure 1 can be disaggregated into the combination of each dimension’s features relevance. Thus, the model can be evaluated by interpreting the results shown on Figure 4 in terms of the percentual relevance of each dimension to guest satisfaction.
All the nine dimensions were found relevant in existing literature to guest satisfaction (Table 1); yet, so far, no study has attempted to measure the weight in terms of influence of each dimension in comparison to the remaining using a single model that encompasses all nine dimensions. The proposed data mining approach enables to accomplish such task through the DSA. Interestingly, the guest's experience with the online platform has shown to be of chief importance, corroborating the findings by Moro et al. (2017), who achieved 38% of relevance when compared to 26.6% in Figure 4. Furthermore, since Moro et al. (2017) analyzed only 504 reviews, the present study extends it by confirming the relevance of online platform experience through a much larger (60k) set of reviews, and not just using a sample as those authors did. As social media data is becoming a dominant source for research in customer satisfaction, one important take away from this study and recommendation for researchers on this important subject is that the experience in using the online review platform also influences the scores granted. Thus, this finding provides evidence of a limitation of using online reviews, i.e., by using the online platform to write reviews, users are already exposed to stimulus inherent to the platform itself and its usage. This is an important limitation that may as well affect other general customer satisfaction model validation using secondary data, a key theme within the Marketing literature. From the practitioners’ perspective, this finding shows that hotel managers can organize their team that reads and responds to reviews into a group dedicated to responding to novice reviewers, and another one that is more capable of responding to expert TripAdvisor reviewers.
Figure 4 shows some important findings that must be analyzed within the context of Las Vegas tourism. One great example is seasonality, a known key factor in the tourism
industry. Yet, this was found to account as little as 1.2% of relevance to guest satisfaction. While high seasons can imply overcrowded hotels, which may deteriorate service and consequently affect guests, the Las Vegas market is shown to have little fluctuation in the different seasons (LVCVA, 2019). Also, the huge hotels are prepared to accommodate the crowds of tourists that flock to Las Vegas (Jin Woo, 2007). Additionally, almost every hotel in the US has air conditioning systems that, in the case of Las Vegas, help in mitigate the hot and dry weather during Summer (Biddle, 2011). These reasons make Las Vegas guests to pay little attention to the season when scoring hotels. Another dimension that has shown little influence in guest satisfaction is hotel size. This finding has its origins on the fact that all hotels in Las Vegas are very large, among the largest in the world. This homogeneity results in this variable affecting little guests’ opinions.
Regarding the type of travel, the results obtained by Liang et al. (2017) for three major China cities (Beijing, Shanghai, and Guangzhou) also using TripAdvisor data suggest it plays a role differently in moderating customer satisfaction, especially when considering leisure versus business travel. Yet, this is not the case for Las Vegas, according to the presented model (less than 2% of relevance to satisfaction). A deeper analysis of the collected data helps in explaining such result by showing that only 16% traveled on business, despite all the analyzed hotels offering convention center services, which is aligned with the “city of pleasure” for which Las Vegas is known. Besides the type of travel, the guest’s nationality also has proven to contribute little (just 3.6%) to modeling satisfaction, as opposite to what Radojevic et al. (2017) discovered. The domestic tourism of Las Vegas sheds light on this issue, by showing that almost 70% of guests are US citizens. When handling with Big Data, dominant categories can overshadow the importance of one variable, such as the nationality, for this case. Thus, researchers focusing specifically on the cultural differences between foreign country and place of destination should consider only comments made by foreigners.
The amenities were considered relevant to guest satisfaction, corroborating previous studies’ findings (e.g., Xie et al., 2016). Obviously, some amenities are more valued by guests than others, depending on the diversity of offer in nearby hotels. Specifically, having an interior pool is the individual amenity most influencing satisfaction, followed by the possibility of booking a room where the guest can smoke. The latter is a big issue in gambling hotels, i.e., with a casino within the hotel, since to gamble triggers emotions which can lead gamblers to smoke more than they are used, and this is a known effect in
Las Vegas, especially since strict non-smoking rules were widely adopted throughout the US (Pritsos et al., 2008). Another highly relevant dimension is related to the guest's preferences, i.e., to which features has the guest paid attention enough so that he/she scored them on TripAdvisor. Until now, these six aspects (service, sleep, value, location, rooms, cleanliness) have only been studied individually, and not in combination with other dimensions. Finally, hotel prestige has also shown a great influence on the granted scores. Although the Las Vegas Strip hotels market seems homogenous, there are hotels ranging from 3 to 5 stars.
Conclusions
This study offers a detailed methodological description of how a data mining approach can be applied to tourism and hospitality to evaluate a conceptual model. Although many social sciences researchers and particularly within tourism are already aware of the importance of analyzing Big Data, the vast majority still sees data mining as related to purely empirical research lacking in properly advancing current state of the art. Thus, the proposed approach is exemplified and detailed through a guest satisfaction model to enable a step by step replication of the sequence of tasks. Both scholars and practitioners can benefit with this approach to leverage knowledge and decision support.
Adopting a data mining approach has several advantages when compared to other data analysis procedures. Specifically, data mining encompasses a set of modeling techniques grounded on machine learning and artificial intelligence which enable to apprehend complex (non-linear) relations between the variables, as opposed to traditional modeling techniques such as a logistic regression, which are more restrictive (Siroosi et al., 2019, Bloom, 2004). Furthermore, the difference in the predictive performance between a neural network model such as the one adopted in this study and a technique such as a logistic regression is amplified for larger datasets containing thousands of instances and several features, with a clear advantage in using a neural network (Eftekhar et al., 2005). The advent of Big Data potentiated by social media demands for easily scalable approaches that enable robust models (i.e., accurately translating the problem from the available data), and the one here presented enables to include any number of features (variables) and any number of occurrences (in this case, reviews) without jeopardizing the methodology, depending solely on the existence of enough computational power
available. Another key characteristic of the presented approach is the use of the data-based sensitivity analysis, which is independent on the modeling technique, and can be virtually applied to any number of features, since it uses a random sample extracted from the training dataset to identify the individual relevance of each feature to the overall model. This is very important nowadays as decision makers are not satisfied with just a working model, they need to understand how the decisions are being performed. Thus, by showing the influence of each dimension to guest satisfaction, the sensitivity analysis is actually taking part in persuading practitioners to adopt data mining by disclosing the knowledge concealed within the model.
From the practitioners’ standpoint, hoteliers can better devise adequate customer strategies if they understand what pleases their guests during their stay. In the studied case, the manager of a hotel located on the Strip avenue can compare her/his unit’s feedback with the overall satisfaction in the same location by looking into the dimensions that hold higher relevance to guests. For example, by understanding that hotel prestige accounts for 19% of relevance in guest satisfaction, the manager may invest in environmental sustainability to obtain recognized awards which may please guests concerned with environmental issues. This can lead to adaptation strategies according to the overall dimensions that are more appreciated in a tourism destination.
Despite the benefits of adopting and analyzing Big Data using sources from the social media domain, there are some important limitations to account for. One of the most relevant is that, as with any secondary data source, a researcher is limited to what is available online. This implies that a conceptual model proposed using such type of source is limited to the dimensions which can be reflected based on data that already exists and can be collected from the online source. For example, Worsfold et al. (2016) highlight that hotel employee satisfaction influences guest satisfaction; however, such information is not available on TripAdvisor and hence we did not include it, revealing a limitation of the proposed model. Yet, social media offers important information from various types and researchers may address such limitation by combining data from different platforms or, additionally, by collecting primary data to complement missing information. For example, a researcher aiming to focus on the well-being provided by the amenities and their contribution to guest satisfaction may need to develop a specific questionnaire, since TripAdvisor may not contain information about all the amenities provided by each hotel. Another example to overcome such limitation and include employee satisfaction in the
model (Worsfold et al., 2016) would be to collect information from the Glassdoor social network (which gathers ratings and comments made by organizations’ employees - Karabarbounis and Pinto, 2018) to complement the data collected from TripAdvisor. Another limitation resides on the inability of dealing with huge numbers of features (or constructs of a model) due to both lack of computational power and to lack of insufficient “intelligence” of data mining modeling algorithms to make clever shortcuts in search of a near optimal model. While forthcoming years are likely to be prolific within the domain of artificial intelligence, helping to overcome these limitations, nowadays it is still a good practice to help human expert knowledge in guiding the data mining process in key steps, such as to aid in the feature selection procedure. Additionally, since the model was applied to the very specific context of Las Vegas, one would guess that the application of the proposed model to different destinations will almost certainly lead to entirely different results, that need to be explained in the light of the specific destination. This can be a future avenue for researchers aiming to focus on other destinations.
References
Baecke, P. and Bocca, L. (2017), “The value of vehicle telematics data in insurance risk selection processes”, Decision Support Systems, Vol. 98, pp. 69-79.
Biddle, J.E. (2011), “Making consumers comfortable: The early decades of air conditioning in the United States”, The Journal of Economic History, Vol. 71 No. 4, pp. 1078-1094.
Bloom, J.Z. (2004), “Tourist market segmentation with linear and non-linear techniques”, Tourism Management, Vol. 25 No. 6, pp. 723-733.
Bradley, A.P. (1997), “The use of the area under the ROC curve in the evaluation of machine learning algorithms”, Pattern Recognition, Vol. 30 No. 7, pp. 1145-1159. Bulchand-Gidumal, J., Melián-González, S. and Lopez-Valcarcel, B.G. (2013), “A social media analysis of the contribution of destinations to client satisfaction with hotels”, International Journal of Hospitality Management, Vol. 35, pp. 44-47.
Chapman, P., Clinton, J., Kerber, R., Khabaza, T., Reinartz, T., Shearer, C. and Wirth, R. (2000), CRISP-DM 1.0 - Step-by-step data mining guide, CRISP-DM Consortium.
Cherkassky, V. and Dhar, S. (2015), “Interpretation of black-box predictive models”, In Measures of Complexity (pp. 267-286), Springer, Cham.
Choi, T.Y. and Chu, R. (2001), “Determinants of hotel guests’ satisfaction and repeat patronage in the Hong Kong hotel industry”, International Journal of Hospitality Management, Vol. 20 No. 3, pp. 277-297.
Chua, A., Servillo, L., Marcheggiani, E. and Moere, A.V. (2016), “Mapping Cilento: Using geotagged social media data to characterize tourist flows in southern Italy”, Tourism Management, Vol. 57, pp. 295-310.
Cillo, V., Rialti, R., Del Giudice, M. and Usai, A. (2019), “Niche tourism destinations’ online reputation management and competitiveness in big data era: evidence from three Italian cases”, Current Issues in Tourism, DOI: 10.1080/13683500.2019.1608918. Cortez, P. (2010), “Data mining with neural networks and support vector machines using the R/rminer tool”, In Industrial Conference on Data Mining (pp. 572-583), Springer, Berlin, Heidelberg.
Cortez, P. and Embrechts, M.J. (2013), “Using sensitivity analysis and visualization techniques to open black box data mining models”, Information Sciences, Vol. 225, pp. 1-17.
Di Pietro, L., Di Virgilio, F. and Pantano, E. (2012), “Social network for the choice of tourist destination: attitude and behavioural intention”, Journal of Hospitality and Tourism Technology, Vol. 3 No. 1, pp. 60-76.
Domingos, P.M. (2012), “A few useful things to know about machine learning”, Communications of the ACM, Vol. 55 No. 10, pp. 78-87.
Eftekhar, B., Mohammad, K., Ardebili, H.E., Ghodsi, M. and Ketabchi, E. (2005), “Comparison of artificial neural network and logistic regression models for prediction of mortality in head trauma based on initial clinical data”, BMC medical informatics and decision making, Vol. 5 No. 1, article no. 3.
Fayyad, U., Piatetsky-Shapiro, G. and Smyth, P. (1996), “From data mining to knowledge discovery in databases”, AI Magazine, Vol. 17 No. 3, pp. 37-54.
Fitchett, J.M. and Hoogendoorn, G. (2019), “Exploring the climate sensitivity of tourists to South Africa through TripAdvisor reviews”, South African Geographical Journal, Vol. 101 No. 1, pp. 91-109.
Fornell, C. (1992), “A national customer satisfaction barometer: the Swedish experience”, Journal of Marketing, Vol. 56 No. 1, pp. 6-21.
Fuchs, M., Höpken, W. and Lexhagen, M. (2014), “Big data analytics for knowledge generation in tourism destinations - A case from Sweden”, Journal of Destination Marketing & Management, Vol. 3 No. 4, pp. 198-209.
Gebremedhin, T.G. and Tweeten, L.G. (1994), Research methods and communication in the social sciences, ABC-CLIO.
Gonçalves, S., Cortez, P. and Moro, S. (2018), “A Deep Learning Approach for Sentence Classification of Scientific Abstracts”, In International Conference on Artificial Neural Networks (pp. 479-488), Springer.
Heidari, E., Sobati, M.A. and Movahedirad, S. (2016), “Accurate prediction of nanofluid viscosity using a multilayer perceptron artificial neural network (MLP-ANN)”, Chemometrics and intelligent laboratory systems, Vol. 155, pp. 73-85.
Jin Woo, K. (2007), “Strategy and Competitive Advantage of Las Vegas Hotels”, International Journal of Tourism Sciences, Vol. 7 No. 1, pp. 79-93.
Karabarbounis, M. and Pinto, S. (2018), “What Can We Learn from Online Wage Postings? Evidence from Glassdoor”, Economic Quarterly, Vol. 4Q, pp. 173-189. Khoo-Lattimore, C., Mura, P. and Yung, R. (2017), “The time has come: a systematic literature review of mixed methods research in tourism”, Current Issues in Tourism, DOI: 10.1080/13683500.2017.1406900.
Kim, W.H. and Chae, B. (2018), “Understanding the relationship among resources, social media use and hotel performance: The case of Twitter use by hotels”, International Journal of Contemporary Hospitality Management, Vol. 30 No. 9, pp. 2888-2907. Kwok, L. and Xie, K.L. (2016), “Factors contributing to the helpfulness of online hotel reviews: does manager response play a role?”, International Journal of Contemporary Hospitality Management, Vol. 28 No. 10, pp. 2156-2177.
LVCVA (2019), “Monthly Las Vegas Convention and Visitors Authority Executive Summary”, Extracted in May 2019 from: https://www.lvcva.com/stats-and-facts/visitor-statistics/
Leung, D., Law, R., Van Hoof, H. and Buhalis, D. (2013), “Social media in tourism and hospitality: A literature review”, Journal of Travel & Tourism Marketing, Vol. 30 No. 1-2, pp. 3-22.
Li, H., Ye, Q. and Law, R. (2013), “Determinants of customer satisfaction in the hotel industry: An application of online review analysis”, Asia Pacific Journal of Tourism Research, Vol. 18 No. 7, pp. 784-802.
Liang, S., Schuckert, M. and Law, R. (2017), “Multilevel analysis of the relationship between type of travel, online ratings, and management response: Empirical evidence from international upscale hotels”, Journal of Travel & Tourism Marketing, Vol. 34 No. 2, pp. 239-256.
Litvin, S.W., Goldsmith, R.E. and Pan, B. (2018), “A retrospective view of electronic word-of-mouth in hospitality and tourism management”, International Journal of Contemporary Hospitality Management, Vol. 30 No. 1, pp. 313-325.
Liu, S., Law, R., Rong, J., Li, G. and Hall, J. (2013), “Analyzing changes in hotel customers’ expectations by trip mode”, International Journal of Hospitality Management, Vol. 34, pp. 359-371.
Maimon, O. and Rokach, L. (2005), Data mining and knowledge discovery handbook. Springer.
Moro, S., Rita, P. and Coelho, J. (2017), “Stripping customers' feedback on hotels through data mining: The case of Las Vegas Strip”, Tourism Management Perspectives, Vol. 23, pp. 41-52.
Moro, S., Ramos, P., Esmerado, J. and Jalali, S.M.J. (2019) “Can we trace back hotel online reviews’ characteristics using gamification features?”, International Journal of Information Management, Vol. 44, pp. 88-95.
Nguyen, G., Dlugolinsky, S., Bobák, M., Tran, V., García, Á.L., Heredia, I., ... and Hluchý, L. (2019), “Machine Learning and Deep Learning frameworks and libraries for
large-scale data mining: a survey”, Artificial Intelligence Review, DOI: 10.1007/s10462-018-09679-z.
O'Connor, P. (2010), “Managing a hotel's image on TripAdvisor”, Journal of Hospitality Marketing & Management, Vol. 19 No. 7, pp. 754-772.
Park, S.B., Ok, C.M. and Chae, B.K. (2016), “Using twitter data for cruise tourism marketing and research”, Journal of Travel & Tourism Marketing, Vol. 33 No. 6, 885-898.
Phillips, P., Zigan, K., Silva, M.M.S. and Schegg, R. (2015), “The interactive effects of online reviews on the determinants of Swiss hotel performance: A neural network analysis”, Tourism Management, Vol. 50, pp. 130-141.
Pritsos, C.A., Pritsos, K.L. and Spears, K.E. (2008), “Smoking rates among gamblers at Nevada casinos mirror US smoking rate”, Tobacco Control, Vol. 17 No. 2, pp. 82-85. Radojevic, T., Stanisic, N. and Stanic, N. (2017), “Inside the rating scores: a multilevel analysis of the factors influencing customer satisfaction in the hotel industry”, Cornell Hospitality Quarterly, Vol. 58 No. 2, pp. 134-164.
Romão, M.T., Moro, S., Rita, P. and Ramos, P. (2019), “Leveraging a luxury fashion brand through social media”, European Research on Management and Business Economics, Vol. 25 No. 1, pp. 15-22.
Schegg, R. and Fux, M. (2010), “A comparative analysis of content in traditional survey versus hotel review websites”, Information and Communication Technologies in Tourism 2010, 429-440.
Schroeder, R. (2014), “Big Data and the brave new world of social media research”, Big Data & Society, 1(2), 2053951714563194.
Shapoval, V., Wang, M.C., Hara, T. and Shioya, H. (2018), “Data mining in tourism data analysis: inbound visitors to Japan”, Journal of Travel Research, Vol. 57 No. 3, pp. 310-323.
Siroosi, H., Heshmati, G. and Salmanmahiny, A. (2019), “Can empirically based model results be fed into mathematical models? MCE for neural network and logistic regression in tourism landscape planning”, Environment, Development and Sustainability, In press, DOI: 10.1007/s10668-019-00363-y.
Tinoco, J., Gomes Correia, A., Cortez, P. and Toll, D.G. (2017), “Stability condition identification of rock and soil cutting slopes based on soft computing”, Journal of Computing in Civil Engineering, 32(2), 04017088.
Trainor, K.J., Andzulis, J.M., Rapp, A. and Agnihotri, R. (2014), “Social media technology usage and customer relationship performance: A capabilities-based examination of social CRM”, Journal of Business Research, Vol. 67 No. 6, pp. 1201-1208.
Trpkovski, A., Vu, H.Q., Li, G., Wang, H. and Law, R. (2018), “Automatic Hotel Photo Quality Assessment Based on Visual Features”, In Information and Communication Technologies in Tourism (pp. 394-406). Springer, Cham.
Tyagi, S. (2003), “Using data analytics for greater profits”, Journal of Business Strategy, Vol. 24 No. 3, pp. 12-14.
Witten, I.H., Frank, E., Hall, M.A. and Pal, C.J. (2016), Data Mining: Practical machine learning tools and techniques, Morgan Kaufmann.
Worsfold, K., Fisher, R., McPhail, R., Francis, M. and Thomas, A. (2016), “Satisfaction, value and intention to return in hotels”, International Journal of Contemporary Hospitality Management, Vol. 28 No. 11, pp. 2570-2588.
Xiang, Z., Schwartz, Z., Gerdes Jr, J.H. and Uysal, M. (2015), “What can big data and text analytics tell us about hotel guest experience and satisfaction?”, International Journal of Hospitality Management, Vol. 44, pp. 120-130.
Xie, K.L., Zhang, Z., Zhang, Z., Singh, A. and Lee, S.K. (2016), “Effects of managerial response on consumer eWOM and hotel performance: Evidence from TripAdvisor”, International Journal of Contemporary Hospitality Management, Vol. 28 No. 9, pp. 2013-2034.
Yang, S.B., Hlee, S., Lee, J. and Koo, C. (2017), “An empirical examination of online restaurant reviews on Yelp. com: A dual coding theory perspective”, International Journal of Contemporary Hospitality Management, Vol. 29 No. 2, pp. 817-839.
Yu, Y., Li, X. and Jai, T.M. (2017), “The impact of green experience on customer satisfaction: evidence from TripAdvisor”, International Journal of Contemporary Hospitality Management, Vol. 29 No. 5, pp. 1340-1361.
Tables
Table 1 - Studies on the dimensions influencing TripAdvisor score. Dimension Effect on customer satisfaction Reference
Amenities
Hotel managers are aware that amenities can impress customers, increasing their satisfaction
(Xie et al., 2016; Radojevic et al., 2017; O'Connor, 2010; Bulchand-Gidumal et al., 2013)
Hotel size Large number of rooms hotels deteriorate the perceived service quality (Radojevic et al., 2017) Guest's place of
origin
Visitor's nationality plays an important role in the ratings granted online
(Radojevic et al., 2017; Yu et al., 2017)
Aspects scored by the guest
Guests give importance to aspects such as cleanliness and location in online reviews
(O'Connor, 2010;
Radojevic et al., 2017; Liu et al., 2013)
Type of travel TripAdvisor score depends on the trip type
(Liu et al., 2013; Moro et al., 2017)
Hotel prestige
Satisfaction of clients increases as the number of stars increases
(Bulchand-Gidumal et al., 2013; O'Connor, 2010) Sustainability recognition influences
guest satisfaction
(Yu et al., 2017) Review
characteristics
Weekday when the review was written influences its score
(Moro et al., 2017; Radojevic et al., 2017) Experience with the online reviews platform used
Nr. of reviews and years as a platform member influence users' scores granted
(Moro et al., 2017; Liu et al., 2013)
Gamification affects the sentiments expressed and the scores granted in reviews
(Moro et al., 2019;
Radojevic et al., 2017; Yu et al., 2017)
Seasonality Seasons and their corresponding weather influence customer satisfaction
(Fitchett and Hoogendoorn, 2019; Moro et al., 2017)
Table 2 - Selected input features for modeling.
Dimension Feature Description
Experience with the online reviews platform used
usr.reviews Nr. reviews written (hotels, restaurants, attractions) usr.member.months For how long is a TripAdvisor registered user (in
months)
usr.ta.points TripAdvisor points
usr.ta.contributor.level TripAdvisor contributor level (0-6) usr.readers Nr. of readers of the user's reviews usr.badges Total nr. of badges
usr.badge.passport Passport badges (nr. destinations reviewed) usr.badge.explorer Explorer badges (first reviewer of a unit) Seasonality month Month of stay
quarter Quarter of stay Review
characteristics
rev.weekday Weekday when the review was written txt.nword Nr. of words of the review text
Type of travel traveled.on {as a couple, on business, solo, with family, with friends}
Hotel prestige
stars Hotel stars
cert.excel Certificate of excellence granted by TripAdvisor green.leader Sustainability level (none, bronze, silver, gold) Hotel size nr.rooms Nr. of rooms
Amenities
pool.int Interior pool {N/Y} free.park Free parking {N/Y}
room.smoking If the unit offers rooms where is allowed to smoke {N/Y}
Guest's place of origin
continent {Africa, America, Asia, Europe, Oceania} USA If it is an US citizen {N/Y}
Aspects relevant (thus, scored) to the guest
service
If the reviewer has granted scores in each of the six specific aspects available to score in TripAdvisor sleep
value location rooms cleanliness
Figures