Identification of superior genotypes and soybean traits by multivariate
analysis and selection index
1Identificação de genótipos superiores e caracteres de soja por meio de análise
multivariada e índice de seleção
Wallace de Sousa Leite2*, Sandra Helena Unêda-Trevisoli3, Fabiana Mota da Silva3, Alysson Jalles da Silva3 and
Antonio Orlando Di Mauro3
ABSTRACT - The selection of superior genotypes of soybean is a complex process, thus exploratory multivariate techniques can be applied to select genotypes analyzing the agronomic traits altogether, increasing the chance of success of a breeding program. Thus, the objective of this study was to select soybean genotypes carrying the RR gene with good agronomical performance through of multivariate analysis and selection index and identify those traits that influence, also verifying the agreement of multivariate techniques and selection index in the selection process. The experiment was conducted in an increased block experimental being evaluated 227 genotypes of F5 generation, which 85 of those were detected to be glyphosate-resistant by PCR. The following traits were evaluated: number of days to maturity, plant height at maturity, lodging, agronomic value, number of branches per plant, number of pods per plant, hundred seeds weight and grain yield. The principal components analysis resulted in the selection of sixteen genotypes with higher grain yield. The traits related to the production of components exerted great influence on grain yield. The clustering by K-means and Ward’s methods were similar because they clustered the specific genotypes for the selected traits in the principal components analysis in the same group. There was an agreement on the results of the multivariate analysis in the selection index of Mulamba and Mock in relation to the selected genotypes. The methodologies applied are efficient for selecting genotypes.
Key words:Glycine max. Clustering analysis. Principal components. Selection gain. Grain Yield.
RESUMO - A seleção de genótipos superiores de soja é um processo complexo; dessa forma, técnicas exploratórias
multivariadas podem ser aplicadas para selecionar genótipos, analisando simultaneamente todos os caracteres agronômicos em estudo, aumentando a chance de êxito em um programa de melhoramento. O objetivo do presente estudo consistiu em selecionar genótipos de soja portadores do gene RR com bons caracteres agronômicos por meio de análise multivariada e índice de seleção, e identificar quais caracteres mais influenciam, além de verificar a concordância das técnicas multivariadas e índice de seleção no processo seletivo. O experimento foi conduzido no delineamento experimental de blocos aumentados, sendo avaliados 227 genótipos de soja de geração F5, sendo 85 destes, detectados pela técnica de PCR, como resistentes ao Roundup. Os caracteres avaliados foram: número de dias para maturidade, altura da planta na maturidade, acamamento, valor agronômico, número de ramos por planta, número de vagens por planta, peso de cem sementes e produtividade de grãos. A análise de componentes principais auxiliou na seleção de dezesseis genótipos, com maior produtividade de grãos. Os caracteres relacionados aos componentes de produção exerceram grande influência sobre a produtividade de grãos. Os resultados das análises de agrupamento pelo método de K-means e pelo o método de Ward quando comparados foram semelhantes, pois agruparam os genótipos específicos para os caracteres selecionados na análise de componentes principais, em um mesmo grupo. Houve concordância dos resultados das análises multivariadas com o índice de seleção de Mulamba e Mock quanto aos genótipos selecionados. As metodologias aplicadas são eficientes no processo de seleção de genótipos.
Palavras-chave:Glycine max. Análise de agrupamento. Componentes principais. Ganho de seleção. Produtividade de grãos.
DOI: 10.5935/1806-6690.20180056 *Author for correspondence
Received for publication on 07/12/2015; approved on 23/08/2017
1Parte da Dissertação de Mestrado do primeiro autor apresentada ao Programa de Pós-Graduação em Agronomia (Genética e Melhoramento de Plantas)
da Universidade Estadual Paulista/UNESP,Campus de Jaboticabal
2Instituto Federal de Educação, Ciência e Tecnologia do Piauí -Campus Uruçuí, Rodovia PI 247, Km 7, s / n - Portal dos Cerrados, Uruçuí-PI,
Brasil, 64.860-000, [email protected]
3Departamento de Produção Vegetal, Faculdade de Ciências Agrárias e Veterinárias, Universidade Estadual Paulista “Júlio de Mesquita Filho”, Via de
INTRODUCTION
The soybean culture is a very important part of Brazilian agriculture. In 2016/17, Brazil produced 113.92 million tons of soybean (CONAB, 2017) and the areas seeded with genetically modified cultivars reached 96.51% of total culture area, corresponding to 32.7 million hectares (CÉLERES, 2016). The emergence of soybean cultivars resistant to the Roundup herbicide significantly changed weed management in these crops by providing benefits, such as efficient control and management
flexibility in the post-emergence stage (MATSUO et al.,
2009; MENEGATTI; BARROS, 2007).
Selecting superior soybean genotypes is a complex process because the economically important agronomic traits are quantitative by nature and are correlated to each other (ALMEIDA; PELUZIO; AFFERRI, 2010;
NOGUEIRA et al., 2012). Promising genotypes should
simultaneously unite a set of positive traits, which could elevate yield to fulfill the market demand (CRUZ, 2013). Taking into consideration the complexity of the most important plant traits, we believe more efficient selection criteria is required.
Multivariate exploratory techniques can be used for selecting superior genotypes, simultaneously analyzing all the agronomic traits and the relationships they have with each other, as well as discriminating which is the most influencing in a selection process. Among the types of multivariate techniques, the analyses that stand out are the principal components analysis, and the hierarchical and non-hierarchical
cluster analysis methods (HAIRet al., 2009).
The main components analysis aims to reduce dataset variability, keeping as much relevant information as possible in the lowest number of components
(BARBOSA et al., 2013; DALLASTRA et al., 2014;
SILVAet al., 2010). The cluster analysis, on the other
hand, aims to classify similar individuals into the same group, while forming a heterogeneous set of groups
(VIANNA et al., 2013). Genotype selection studies
have been performed with these techniques on several
different cultures, according to Bertini et al. (2010);
Dallastra et al. (2014) and Vianna et al. (2013). In
addition, multivariate methods have also been used in
soybean genetic divergence studies (FERREIRAet al.,
2015; PELUZIOet al., 2012; VILLELAet al., 2014).
Selection indexes are methodologies that can identify superior genotypes. They enable researchers to efficiently select a set of economically expressive agronomic traits, increasing the success of the genetic
improvement program (CRUZ, 2013; ROSADO et al.,
2012).
The use of indexes to select soybean genotypes can promote better total gains, distributed among all the available traits, which is adequate for genetic improvement
programs (COSTAet al., 2004). Selection indexes were
used in recent soybean-traits studies (BIZARI et al.,
2017; LEITE et al., 2016). Notably, the Mulamba and
Mock (1978) sum of ranks index consists of classifying the genotypes according to each trait in favorable order of improvement and has the advantage of not needing to establish economic importance and variance and
covariance estimations (REZENDEet al., 2014).
Based on the aforementioned considerations, the present study aims to select Roundup Ready soybean genotypes with positive agronomic traits, using multivariate assessments and selection indexes. Furthermore, it intends to identify which traits influence selection most and evaluate the relationship between these features, as well as verify the correlations between multivariate techniques and selection indexes in a selective process.
MATERIAL AND METHODS
Agronomic analyses
The experiment was conducted in the 2013/2014 agricultural year at the Jaboticabal Campus of UNESP/ FCAV (São Paulo State University), located in the northern region of São Paulo State (21°15’22” S latitude and 48°18’58” W longitude). The genotypes evaluated in this study were obtained by artificial hybridization between conventional genitors (seed-bearing parent), lineages of the FCAV/UNESP Jaboticabal genetic improvement program, and genitors with the RR gene, commercial cultivars (male parent). In total, twenty genetic crossing were assessed.
Treatments consisted of 227 F5 generation soybean
lineages, regardless of having the RR gene or not, since up to the present generation they had not been selected for glyphosate resistance. The augmented block design proposed by Federer (1956) was used, in which the plot was composed by a 5-meter long row with 0.5-meter spacing. Two check cultivars were used as interspersed controls (CD-216 and Vmax).
Molecular analyses
The Roundup Ready (RR) soybean genotypes were detected by the PCR laboratory technique, which distinguishes genotypes through the presence of molecular imprints, resulting from specific transgenic DNA sequences, which are amplified. Genotypes containing the RR gene were identified through specific
oligonucleotides that pair with the Forward sequence
5’TGATGTGATATCTCCACTGACG 3’ and Reverse
5’TGTATCCCTTGAGCCATGTTGT 3’, which encodes the EPSPS region. The RR sequence has a fragment size of 172pb (MARCELINO; GUIMARÃES; BARROS, 2007). The genomic DNA samples were extracted from the tissue of young trefoil, using the CTAB method described by Ferreira and Grattapaglia (1995). The PCR reactions and electrophoresis separation of the amplified fragments in agarose gels were conducted according to Silvaet al. (2015).
Table 1 exhibits a list of the crossings and genitors used to form the segregating populations, as well as the number of soybean genitors that have the RR
Table 1 -Crossings and respective genotypes, the total number of genotypes, number of identified RR genotypes and their codes as a function of the number of identified genotypes per crossing
Crossing Number Conventional Genitor Genitor RR Total Genotypes RR Genotypes RR genotype codes
C1 JAB.00-04-1/5A4D X M 8230 RR 12 5 1 to 5
C2 JAB.00-03-3/1H1D X M 7908 RR 11 8 6 to 13
C3 JAB.00-03-3/1H2D X M 8360 RR 11 6 14 to 19
C4 JAB.00-01-21/4M1D X M 8336 RR 10 7 20 to 26
C5 JAB.00-05-5/4A2D X M 7578 RR 12 1 27
C6 JAB.00-05-5/4A2D X M 7908 RR 9 8 28 to 35
C7 JAB.00-05-5/4A2D X M 8221 RR 13 7 36 to 42
C8 JAB.00-05-1/5C3B X M 7211 RR 12 4 43 to 46
C9 JAB.00-05-1/5C3B X M 7639 RR 13 7 47 to 53
C10 JAB.00-05-1/5C3B X M 8211 RR 12 3 54 to 56
C11 JAB.00-05-1/5C3B X M 8336 RR 12 4 57 to 60
C12 JAB.00-05-1/5C3B X M 8360 RR 11 3 61 to 63
C13 JAB.00-05-8/2D3C X M 7211 RR 8 6 64 to 69
C14 JAB.00-05-8/2D3C X M 7636 RR 12 0
-C15 JAB.00-05-8/2D3C X M 7908 RR 11 0
-C16 JAB.00-05-8/2D3C X M 8336 RR 10 1 70
C17 JAB.00-06-2/3I3D X M 8230 RR 11 5 71 to 75
C18 JAB.00-06-2/3I3D X M 8236 RR 13 4 76 to 79
C19 JAB.00-02-30/1G4A X M 8360 RR 11 2 80 to 81
C20 JAB.00-02-3/6A4D X M 8360 RR 13 4 82 to 85
Total 227 85 1 to 85
gene, characterized and identified in generation F5 for
each crossing. Among all the assessed genotypes, both crossing number 14 and 15 presented no RR gene in their genotypes.
Statistical analyses
The soybean genotypes containing the RR gene were encoded from 1 to 85. Further selection was conducted based on the assessed agronomic traits.
Genotypes were selected by the principal components analyses, establishing criteria in which the scales of the graphs were pre-determined through ellipse on the graph axes to enable precise discrimination of progenies based on their different traits, according
to Dallastra et al. (2014) and Viannaet al. (2013). The
lowest scale is the least stringent and consists of an X-axis varying from 2 to -2 and Y axis from 2 to -2. The second scale, more complex, varies on the X axis from 3 to -3 and on the Y axis from 3 to -3. This pattern goes on for all biplot graphs. Therefore, Plant breeders have to decide on the best level of selection intensity to use in the analysis and, hence, in the number of individuals selected for the interesting traits.
The Ward’s clustering generated a dendrogram to obtain prior information about the number of groups that would be formed by the set of genotypes, based on the established between-group linkage distance. The dissimilarity measurement between the genotypes was
based on the Euclidian distance (HAIRet al., 2009).
In theK-means cluster analysis, we predetermined
that 5 groups of RR soybean genotypes would be formed. The observation on the graphs indicate the “centers” of the groups for the analyzed traits. To determine the number of groups, the prior information created on the dendrogram was considered, based on the number of groups formed according to the adopted group connection distance.
Therefore, with theK-means, we aimed to minimize the
distance between each point and its centroid (HAIRet al.,
2009).
For the RR soybean genotypes, the sum of ranks selection index, described by Mulamba and Mock (1978) with 19% intensity, was used, aiming to select the same number of genotypes discriminated by the
Table 2 -Correlation between the agronomic traits and the principal components (PC) of the 85 soybean genotypes with the
RR gene in generation F5
NDM - Number of day to maturity (days); PHM - Plant height at maturity (cm), L - Lodging (visual score); AV - Agronomic value (visual score); NB - Number of branches (un); NP - Number of pods (un); WHS - Weight of 100 seeds (g) and GY- Grain yield (kg ha-1)
Traits PC1 PC2 PC3
NDM -0.445 0.061 -0.462
PHM -0.868 0.082 0.024
L -0.718 0.355 0.282
AV 0.733 -0.291 0.016
NB 0.420 0.727 -0.389
NP 0.301 0.879 -0.148
WHS 0.445 -0.016 0.468
GY 0.008 0.535 0.658
main components analysis for results comparisons. This analysis was processed by Genes - genetic software (CRUZ, 2013).
RESULTS AND DISCUSSION
In the principal components analysis, three eigenvalues ware higher than one, explaining 67.58% of the variance contained in the eight original variables. Eigenvalues above one (1.0) generate components with significant quantities of information of the original
variables (BERTINI et al., 2010; DALLASTRA et al.,
2014). However, for those below one, the quantity of information retained in the component has no relevance.
The eigenvalue for the first principal component (PC1) was 2.47, which corresponds to 30.92% of total variance. The main variables that explained the variance retention were PHM, L, and AV, with correlation values of PC1 above 0.5 (Table 2), since the values above this magnitude, regardless of the signal, contribute the most to the generated component. The eigenvalue for the second main component (PC2) was 1.81, which retained 22.63% of the total variance, explained especially by the traits NB, NP, and GY. The third main component (PC3) retained 14.03% of the variance, explained mainly by the NB variable. For each principal component, same signals mean that the traits are positively correlated, and opposite signals mean the traits are negatively correlated
(HAIRet al., 2009).
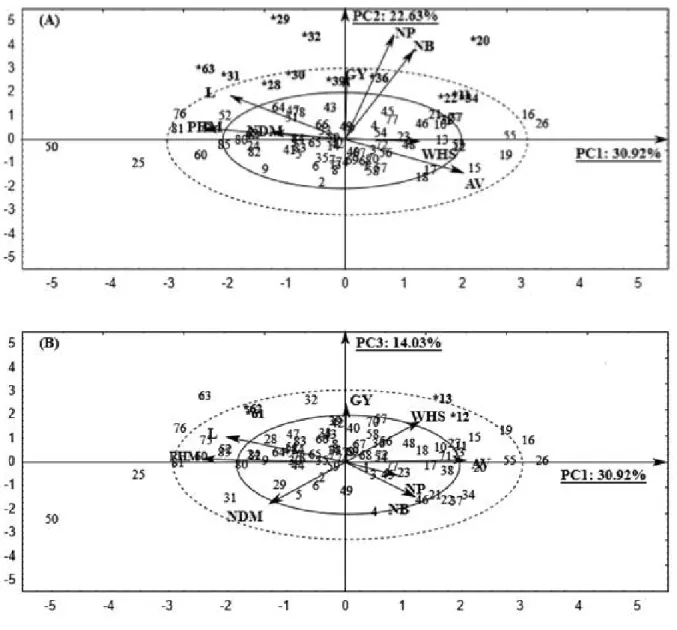
Figure 1 -Biplot graph with 85 RR soybean genotypes dispersed in function to the principal components: PC1 x PC2 (A) and PC1 x
PC3 (B) and projection of the traits vectors: NDM - Number of day to maturity (days); PHM - Plant height at maturity (cm), L - Lodging (visual score); AV - Agronomic value (visual score); NB - Number of branches (un); NP - Number of pods (un); WHS - Weight of 100 seeds (g) and GY - Grain yield (kg ha-1)
This variance is explained by the following traits: PHM, L, AV, NB, NP, and GY and enabled us to choose the specific genotypes 11; 22;28;30;31;34;36; and 63; and the highly specific characters 20; 29; and 32 for the traits NB, NP, and GY. The highly specific genotypes are those that are well discriminated by one or a few traits and are highly superior since each genotype trait exhibits high influence. The specific genotypes, on the other hand, are those discriminated by several traits. The two-dimensional plane formed by the PC1 (30.92%) and PC3 (14.03%) retained 44.95% of remaining variance (Figure 1B) and the genotypes 12, 13, 61, and 62 were selected and discriminated by the traits GY, WHS, NDM, PHM, and
L. Genotypes 12 and 13 exhibited superior GY and WHS, as well as inferior NDM, PHM, and L results, which are important and benign to the selection. Genotypes 61 and 62 exhibited superior GY and PHM, but exhibited and a higher level of L, indicating the intense relationship between PHM and L.
The genotypes located within the established scales are specific for the agronomic traits that influence them (Figure 1A and 1B). On the other hand, regarding the genotypes located in the graph extremities, they exhibit higher performance than the others in some specific traits since they possess very specific traits. Therefore, genotypes 20, 29, and 32 have extremely specific standards for the traits NB, NP, and GY because of their superior phenotypic values.
Figure 1A exhibits dispersion of the traits vectors according to the size proportion of the vectors among each other. Concerning the selected genotypes, the NB and NP traits exhibit a highly positive correlation with GY and are positioned in the same graph quadrant. These results are in agreement with those obtained in other studies
(NOGUEIRAet al., 2012; VIANNAet al., 2013). Thus,
such traits compose the yield components, i.e., the larger their values the higher the soybean yield of that genotype, which facilitates the selection of superior genotypes with better efficiency. According to the projections of the GY, NDM, PHM, and L traits vectors (Figure 1B), genotypes 12 and 13, besides having the highest soybean yield, also exhibit better precocity, smaller size, and non-lodging shape.
Because of the number of pods, mature plant height is a trait that has a great indirect effect on the productivity of the soybeans. Thus, this trait can be used in genetic enhancement for indirectly selecting soybean
yield (ALCANTARA NETO et al., 2011; ALMEIDA;
PELUZIO; AFFERRI, 2010).
Figure 1B shows that the WHS trait was most important to good soybean yield since both are strongly associated and positioned in the same graph quadrant.
This can be explained by the fact that the genotypes present higher WHS when the size of the seeds are larger, because of the smaller quantity produced by the plant, since these genotypes suffered almost no influence from the yield components NB and NP. According to Dallastra
et al. (2014), the lower the number of pods the lower the
number of beans per plant and higher the weight of 100 beans.
Concerning the group of selected genotypes, not all crossings were represented. Therefore, analyzing the parents involved in the crossing, we observed that the female genitors JAB.00-05-5/4A2D and JAB.00-06-2/3I3D were more efficient, with 6 and 5 selected RR genotypes, respectively. Regarding male genitors, M 8230 RR was most effective, with 5 selected genotypes.
According to Gonçalves et al. (2014), in order to form
segregating populations, selecting the genitors is a crucial step in guaranteeing success in genetic enhancement programs, in which the combination capacity with the presence of complementary genes is largely responsible for the success.
Figure 2 exhibits the dendrogram generated by the Ward cluster analysis. In general, it shows two large groups, named groups A and B. In a rougher selection, through the adopted cutoff point, five subgroups were formed, two of which were within Group A (A1 and A2) and three within group B (B1, B2, and B3). In regard to the subgroups, the genetic difference between the genotypes of these populations was verified based on the studied traits. However, individuals of the same subgroup were considered very similar, while those from different subgroups were considered very distinct.
Figure 3 -Line graph of each group’s centroid profiles by the K-means method and Euclidian distance from the agronomic traits: NDM Number of day to maturity (days); PHM Plant height at maturity (cm), L Lodging (visual score); AV -Agronomic value (visual score); NB - Number of branches (un); NP - Number of pods (un); WHS - Weight of 100 seeds (g) and GY - Grain yield (kg ha-1) of 85 RR soybean genotypes
Table 3 -Optimization grouping between 85 RR soybean genotypes, obtained by theK-means method, based on 8 agronomic traits, using the Euclidian distance
Group Genotypes
1 4 10 11 16 19 21 22 23 26 27 34 37 38 45 46 49 53 54 55 71 77
2 24 25 31 41 47 50 51 52 60 61 62 64 75 76 78 80 81 82 85
3 1 2 3 5 6 7 8 9 14 15 17 18 33 35 40 42 44 48 56 57 58 59 65 66 67 68 69 70 72 73 74 79 83 84
4 20 28 29 30 32 36 39 43 63
5 12 13
In subgroup A2, only the genotypes selected in the principal components analysis were classified, since they have similar grain yield traits, number of branches and number of pods. The two genotypes selected by main component analysis were grouped in subgroup B1, representing genotypes with greater precocity, besides showing a great influence of a 100-grain variable on crop yield. This is because these genotypes present high similarity for these traits.
Genotypes 28, 61, and 62, from subgroup A1, exhibited similarly high soybean yield as well as mature plant height, and, consequently, elevated lodging rate. On the other hand, genotypes 11 and 34 from subgroups B2 presented similarly low mature plant heights, low lodging rates, and high soybean yield.
Figure 3 exhibits the cluster graph analysis
generated by the K-means method, with 85 soybean
genotypes for eight agronomic traits, distributed into five groups (clusters). The classification of genotypes is listed in Table 3.
Group 4 (Figure 3) was characterized as above average for NDM, PHM, and L, and below average for agronomic values. Furthermore, significantly high values of NB and NP were found for this same group. Thus, the genotypes placed in this group presented the highest GY results from all the groups formed in this analysis. Therefore, this reemphasizes that the NB and NP combination directly determines the yield potential of a soybean genotype. Highly positive phenotypic correlation results between these two traits were obtained in other
studies (ALCANTARA NETO et al., 2011; ALMEIDA;
PELUZIO; AFFERRI, 2010; LEITEet al., 2016).
for NDM, PHM, L, AV, NP, and GY. This genotype group presented the highest genotype precocity and reduced mature plant height, however, when compared to the other groups, its yield was practically the same, with the exception of group 4, which presented the highest productivity.
Genotypes that presented the lowest values for mature plant height are related to a shorter cycle, because of the shorter interval of time in the vegetative and reproductive stages. Thus, the habit of undetermined growth in soybean genotypes is an extremely important trait, since it aims to reach higher plant height when mature, even in more precocious cycle genotypes (MARQUES; ROCHA; HAMAWAKI, 2008).
Groups 4 and 5 exhibited the most traits dispersion and, consequently, greater genetic variability among genotypes. They can be used in new hybridizations to form segregating populations with the objective of uniting, in one individual, precocity, taller mature plants, as well as larger yield component values. Consequently, the plant would exhibit better total soybean yield. The other genotype groups presented smaller variations since the average soybean yield was similar.
The cluster analysis helps the genetic enhancer to choose a specific group of genotypes according to the desired trait, which enables future use of the same genotypes in commercial cultures or even for composing hybridizations.
Similar results from multivariate analyses
were obtained by Vianna et al. (2013) while studying
the influence of agronomic traits in the selection of genotypes resistant to soybean rust, and by Dallastra
et al. (2014), while studying soybean progenies
selection in segregating populations descending from
RR genitors. Furthermore, Barbosa et al. (2013),
concluded that both multivariate cluster and principal
components analyses are efficient tools for describing seed lots.
Interestingly, the results obtained from the Ward hierarchical grouping method produced by the dendrogram were similar to the results obtained by the
K-means non-hierarchical method (centroid profile). In
addition, the grouping analyses results were similar to those obtained by the principal components analysis, because it classified highly specific genotypes, selected for the aforementioned traits, into the same group. This is proof of the similar results and efficiency of the multivariate exploratory techniques in selecting soybean genotypes with good attributes.
The index developed by Mulamba and Mock (1978) was used on advanced generations of enhancement to predict the gains enabled by selection. Selection intensity of 19% was applied with the intention of selecting 16 soybean genotypes, i.e., the same quantity selected by the principal components analysis, thus, comparing the results of both selection methods.
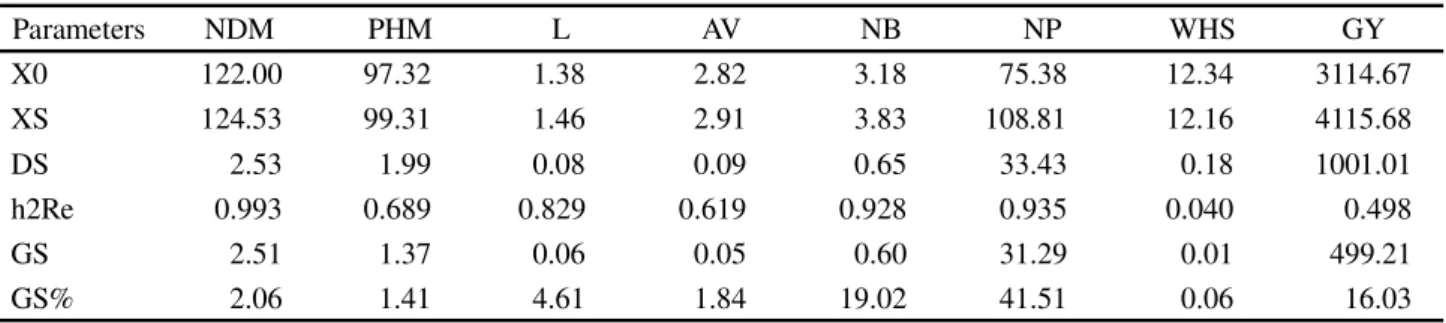
Seven RR soybean genotypes were selected by the Mulamba and Mock index (1978): 11; 20; 22; 23; 28; 29; 30; 32; 36; 64; 65; 78; 82; 83; and 84. These results were in agreement with those obtained by the multivariate analysis for genotypes: 11. 20; 22; 28; 29; 30; 32; and 36, therefore, there is conformity among these methods, which attests to their efficiency in selecting soybean genotypes. The traits that exhibited the greatest gains after the selection were: number of pods (41.51%), number of branches (19.02%), and grain yield (16.03%) (Table 4). Thus, selection based on some soybean production primary components (number of branches and pods) enable the acquisition of genotypes with higher grain yield by means of indirect selection.
The Mulamba and Mock (1978) sum of the rank index is a good method because it contributes to better
Table 4 -Estimations of selection gain (SG) obtained by the Mulamba and Mock method (1978), in F5 RR soybean genotypes for the traits: NDM - Number of day to maturity (days); PHM - Plant height at maturity (cm), L - Lodging (visual score); AV - Agronomic value (visual score); NB - Number of branches (un); NP - Number of pods (un); WHS - Weight of 100 seeds (g) and GY - Grain yield (kg ha-1)
X0 - original average; Xs - selected average; h2Re - restricted heritability between; D
S- selection differential
Parameters NDM PHM L AV NB NP WHS GY
X0 122.00 97.32 1.38 2.82 3.18 75.38 12.34 3114.67
XS 124.53 99.31 1.46 2.91 3.83 108.81 12.16 4115.68
DS 2.53 1.99 0.08 0.09 0.65 33.43 0.18 1001.01
h2Re 0.993 0.689 0.829 0.619 0.928 0.935 0.040 0.498
GS 2.51 1.37 0.06 0.05 0.60 31.29 0.01 499.21
total gains for the evaluated traits regarding soybean yield, thus, this selection strategy was proven to be efficient
in genotype selection. According to Costa et al. (2004),
the index based on the Mulamba and Mock (1978) sum of ranks was proper and had superior soybean gains in
several studied situations. Leiteet al. (2016) and Rosado
et al. (2012) also confirmed that this index was adequate
because it promoted a balanced gain distribution and because it promoted higher total genetic gains by selecting superior genotypes.
Bizariet al. (2017) evaluated the selection indexes
for the agronomic traits in segregating soybean population and concluded again that the Mulanba & Mock sum of ranks index, using the soybean yield and agronomic value as main estimators, provided better gains in their study than the several other applied indexes.
CONCLUSIONS
1. The principal components analysis enabled us to describe and select 16 Roundup Ready soybean genotypes with agronomic superiority;
2. The traits that make up the yield components (number of branches and pods) exert more influence on soybean yield for being positively associated;
3. The K-means and Ward grouping analyses exhibited
similar results since they grouped together the specific genotypes for the traits selected by the principal components analysis and put them into the same group; 4. The multivariate analysis selected the same genotypes
as the Mulamba and Mock selection index.
REFERENCES
ALCANTARA NETO, F.et al. Análise de trilha do rendimento de grãos de soja na microrregião do Alto Médio Gurguéia.
Comunicata Scientiae, v. 2, n. 2, p. 107-112, 2011.
ALMEIDA, R. D.; PELUZIO, J. M.; AFFERRI, F. S. Correlações fenotípicas, genotípicas e ambientais em soja cultivada sob condições várzea irrigada, sul do Tocantins.Bioscience Journal,
v. 26, n. 1, p. 95-99, 2010.
BARBOSA, R. M., et al. Discrimination of soybean seed lots by multivariate exploratory techniques.Journal of Seed Science, v. 35, n. 3, p. 302-310, 2013.
BERTINI, C. H. C. M. et al. Análise multivariada e índice de seleção na identificação de genótipos superiores de feijão-caupi.
Acta Scientiarum. Agronomy, v. 32, n. 4, p. 613-619, 2010. BIZARI, E. H. et al. Selection indices for agronomic traits in segregating populations of soybean. Revista Ciência Agronômica, v. 48, n. 1, p. 110-117, 2017.
CÉLERES. Acompanhamento da adoção de biotecnologia agrícola no Brasil: 2º levantamento grãos safra 2016/17.
Dezembro 2016. Available at: < http://www.celeres.com.br/2o- levantamento-de-adocao-da-biotecnologia-agricola-no-brasil-safra-201617/. Accessed on July 07, 2017.
COMPANHIA NACIONAL DE ABASTECIMENTO.
Acompanhamento da safra brasileira de grãos: 9º
levantamento grãos safra 2016/17. Junho 2017. Available at: <http://www.conab.gov.br/OlalaCMS/uploads/arquivos/17_06_ 08_09_02_48_boletim_graos_junho_2017.pdf>. Accessed on July 07, 2017.
COSTA, M. M. et al. Ganho genético por diferentes critérios de seleção em populações segregantes de soja. Pesquisa Agropecuária Brasileira, v. 39, n. 11, p. 1095-1102, 2004. CRUZ, C. D. Genes: a software package for analysis in experimental statistics and quantitative genetics. Acta Scientiarum. Agronomy, v. 35, n. 3, p. 271-276, 2013. DALLASTRA, A.et al. Multivariate approach in the selection of superior soybean progeny which carry the RR gene.Revista Ciência Agronômica, v. 45, n. 3, p. 588-597, 2014.
FEDERER, W. T. Augmented (or hoonuiaku) designs.Hawaiian Planters Record, v. 55, n. 1, p. 191-208, 1956.
FERREIRA, J. A. et al. Diversidade genética em linhagens avançadas de soja oriundas de cruzamentos biparentais, quádruplos e óctuplos. Revista Ciência Agronômica, v. 46,
n. 2, p. 339-351, 2015.
FERREIRA, M. E.; GRATTAPAGLIA, D. Introdução ao uso de marcadores RAPD e RFLP em análise genética. Brasília:
Emprapa-Cenargen, 1995. 220 p. (EMBRAPA-CENARGEN. Documentos, 20).
GONÇALVES, A. et al. Estimating combining ability in popcorn lines using multivariate analysis. Chilean Journal of Agricultural Research, v. 74, n. 1, p. 10-15, 2014.
HAIR, J. F.et al.Análise multivariada de dados. 6. ed. Porto Alegre: Bookman, 2009. 688 p.
LEITE, W. S. et al. Estimativas de parâmetros genéticos, correlações e índices de seleção para seis caracteres agronômicos em linhagens F8 de soja.Comunicata Scientiae, v. 7, n. 3, p. 302-310, 2016.
MARCELINO, F. C.; GUIMARÃES, M. F. M.; BARROS, E. G. Detecção e quantificação de alimentos geneticamente modificados: o panorama brasileiro.Revista Ceres, v. 54, n. 313, p. 239-249, 2007.
MARQUES, M. C.; ROCHA, J.; HAMAWAKI, O. T. Avaliação do teor de óleo de cultivares de soja da UFU visando a produção de biodiesel.Horizonte Científico, v. 2, n. 1, p. 207-219, 2008. MATSUO, E. et al. Resistance of soybean genotypes to glyphosate. Planta Daninha, v. 27, p. 1063-1073, 2009. Número especial.
do Sul.Revista de Economia e Sociologia Rural, v. 45, n. 1, p. 163-183, 2007.
MULAMBA, N. N.; MOCK, J. J. Improvement of yield potential of the Eto Blanco maize (Zea maysL.) population by breeding for plant traits.Egyptian Journal of Genetics and Cytology, v. 7, n. 1, p. 40-51, 1978.
NOGUEIRA, A. P. O.et al. Análise de trilha e correlações entre caracteres em soja cultivada em duas épocas de semeadura.
Bioscience Journal, v. 28, n. 6, p. 877-888, 2012.
PELUZIO, J. M. et al. Genetic divergence among soybean cultivars in irrigated lowland in the State of Tocantins.Ciência Rural, v. 42, n. 3, p. 395-400, 2012.
REZENDE, J. C.et al. Genetic progress in coffee progenies by different selection criteria.Coffee Science, v. 9, n. 3, p. 347-353, 2014.
ROSADO, L. D. S.et al. Simultaneous selection in progenies of yellow passion fruit using selection indices.Revista Ceres,
v. 59, n. 1, p. 95-101, 2012.
SILVA, F. M. et al. Toothpick test: a methodology for the detection of RR soybean plants.Revista Ciência Agronômica, v. 46, n. 2, p. 436-442, 2015.
SILVA, M. O.et al. Discriminação de diferentes classes de solos irrigados com águas salinas, na região de Mossoró (RN), com o uso de análise multivariada.Ambiência, v. 6, n. 2, p. 261-270,
2010.
STATSOFT. Statistica: data analysis software system,
version 10. Tulsa, 2004. Available at: <http://www.statsoft. com>. Accessed on July 25, 2015.
VIANNA, V. F.et al. The multivariate approach and influence of characters in selecting superior soybean genotypes.
African Journal of Agricultural Research, v. 8, p.
4162-4169, 2013.
VILLELA, O.et al. Genetic divergence of roundup ready (RR) soybean cultivars estimated by phenotypic characteristics and molecular markers.African Journal of Biotechnology, v. 13, n. 26, p. 2613-2625, 2014.