www.ambi-agua.net E-mail: ambi.agua@gmail.com
This is an Open Access article distributed under the terms of the Creative Commons Attribution License, which permits unrestricted use, distribution, and reproduction in any medium, provided the original work is properly cited.
Quality of the water fluoridation and municipal-level indicators in a
Brazilian metropolitan region
ARTICLES doi:10.4136/ambi-agua.2270
Received: 20 Apr. 2018; Accepted: 05 Oct. 2018
Lorrayne Belotti1*; Paulo Frazão1; Carolina Dutra Degli Esposti2;
Jaime Aparecido Cury3; Edson Theodoro dos Santos Neto2;
Karina Tonini dos Santos Pacheco2
1Faculdade de Saúde Pública da Universidade de São Paulo (FSP-USP), São Paulo, SP, Brasil
Departamento de Política, Gestão e Saúde. E-mail: lorraynebelotti@usp.br, pafrazao@usp.br
2Universidade Federal do Espírito Santo (UFES), Vitória, ES, Brasil
Departamento de Medicina Social (DMS). E-mail: carolinaesposti@gmail.com, edsontheodoro@uol.com.br, kktonini@yahoo.com.br
3Faculdade de Odontologia de Piracicaba (FOP/UNICAMP), Piracicaba, SP, Brasil
Departamento de Ciências Fisiológicas (DCF). E-mail: jcury@unicamp.br
*Corresponding author
ABSTRACT
This study explored the relationship between water fluoridation quality and development indicators at municipal level. In addition, fluoride concentrations found were classified based on two criteria for interpreting the samples. A cross-sectional ecological exploratory study was carried out including all municipalities of the metropolitan region of Great Vitória, ES, Brazil. From May to October 2016, 648 samples of water were collected covering water treatment plants responsible for more than 80% of the population of each municipality. The fluoride concentration of each sample was determined using ion-specific electrode and the results were classified according to the federal act and the criterion proposed by the Collaborating Center of the Brazilian Ministry of Health for Oral Health Surveillance. The outcome was the rate of values included in the optimal concentration interval and the independent variables were municipal-level indicators related to demographics, economics, sanitation, health conditions and human development characteristics. The Spearman test and Kappa statistic were used in the analysis. The percentage of samples presenting optimal fluoride concentration ranged from 68.1 to 81.4%, considering the two criteria used. The Kappa statistic between the criteria was 0.671 (p-value = 0.001). Human development, average coverage of supervised toothbrushing, and total population showed a strong positive correlation with the quality of fluoridation while infant mortality and tooth-extraction/dental procedures ratio showed a strong negative correlation. The plausibility of observed correlations encourages further investigations of potential causes.
Rev. Ambient. Água vol. 13 n. 6, e2270 - Taubaté 2018
Qualidade da fluoretação da água e indicadores de nível municipal em
uma região metropolitana Brasileira
RESUMO
O objetivo do estudo foi analisar a relação entre a qualidade da fluoretação da água e indicadores de desenvolvimento em nível municipal. Além disso, a concentração de fluoreto foi classificada de acordo com dois critérios para interpretação das amostras. Foi realizado um estudo exploratório ecológico transversal nos municípios que compõem a Região Metropolitana da Grande Vitória, ES, Brasil. Foram coletadas 648 amostras de água tratada em Estações de Tratamento de Água que abastecem mais de 80% da população de cada município, durante o período de maio a outubro de 2016. A concentração de fluoreto de cada amostra foi determinada através do método do eletrodo específico e os resultados foram categorizados de acordo com a legislação brasileira e o critério proposto pelo Centro Colaborador do Ministério da Saúde em Vigilância da Saúde Bucal. A variável dependente foi a taxa de valores incluídos no intervalo de concentração ideal e as variáveis independentes foram indicadores de nível municipal relacionados às características demográficas, econômicas, saneamento, condições de saúde e desenvolvimento humano. Correlação de Spearman e estatística Kappa foram utilizadas nas análises. O percentual de amostras que apresentou níveis ótimos de fluoreto variou entre 68,1 e 81,4% de acordo com os diferentes critérios. O valor da estatística Kappa entre os critérios foi 0,671 (p<0,001). O nível de desenvolvimento humano, a média de escovação supervisionada e a população total exibiram forte correlação positiva com a qualidade da fluoretação, enquanto, a taxa de mortalidade infantil e a proporção de exodontias apresentaram correlação forte e negativa. A plausibilidade das correlações observadas pode encorajar novas investigações sobre possíveis relações causais.
Palavras-chave: análise da água, indicadores de desenvolvimento, flúor, fluoretação da água, vigilância em saúde.
1. INTRODUCTION
Fluoridation of public water supply is considered one of the ten most important public health measures of the 20th century (CDC, 1999). In addition to reducing tooth-decay rates (rates of cavities), its low cost compared to the high social benefit reduces social inequality in the access to fluoride and can benefit all strata of the population according to the reach of the network of public utilities’ water supply (Kumar, 2008).
Data from British Fluoridation Society showed that water fluoridation had reached about 370 million people worldwide around 2012. Among the ten most populous countries, United States and Brazil have the greatest coverages (Rugg-Gunn and Do, 2012; Frazão and Narvai, 2017). However, there are important within-country differences regarding access to water fluoridation. Generally, the residents in the least-developed least-populated areas do not have access to water fluoridation or the fluoride amount in drinking water is unknown (Gabardo et al., 2008; Peres et al., 2004).
Rev. Ambient. Água vol. 13 n. 6, e2270 - Taubaté 2018
Except for a study that found increasing rates of fluoridation standard compliance according to the scale of the supply systems and the values of the HDI (Daré et al., 2009), information on the relationship between the quality level of fluoridation and municipal-level indicators related to sanitation, health, economic and income inequality variables is scarce.
Considering the dissimilarity showed in the scientific literature regarding the interpretation of data on fluoride concentration (Venturini et al., 2016) and the interest in the qualification of fluoridation systems, Brazilian experts have reached a technical consensus (CECOL, 2011) to classify public water supplies according to fluoride contents. Few studies have compared this new criterion with the conventional one (Brasil, 1976), assessing the differences among the results. Kuhnen et al. (2017) and Peixoto et al. (2012) interpreted the results of water samples using both criteria and observed substantial differences between them.
This study explored the relationship between water fluoridation quality and development indicators at the municipal level. In addition, fluoride concentrations were classified based on two classification criteria for interpreting the samples.
2. MATERIALS AND METHODS
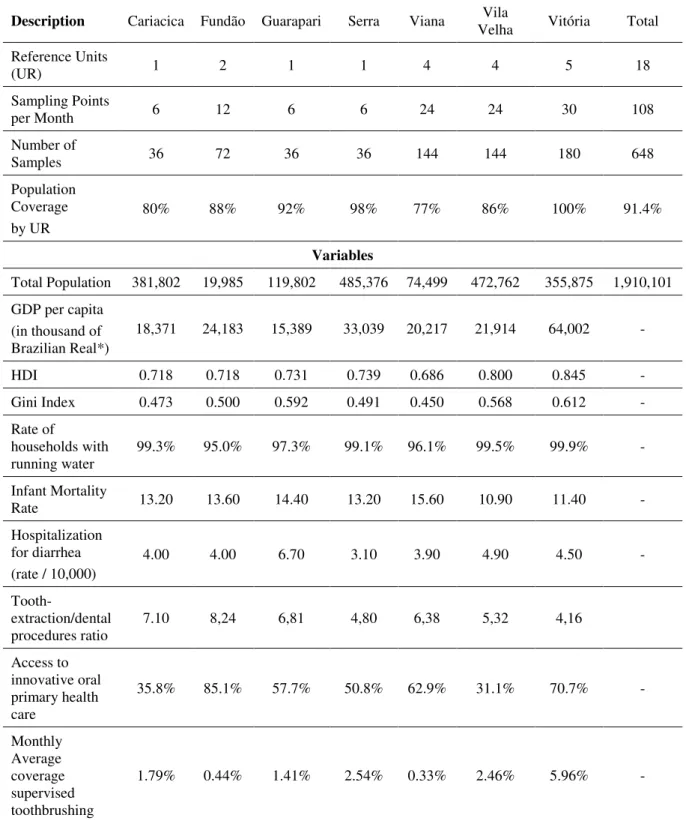
A cross-sectional ecological exploratory study was carried out comprising all municipalities of the Metropolitan Region of Great Vitória (RMGV), Espírito Santo (ES). The RMGV-ES includes 49% of the population of the state (Incaper, 2016). It is comprised of seven municipalities: Cariacica, Guarapari, Fundão, Serra, Viana, Vila Velha and Vitória. There are important socioeconomic and demographic differences among them (Table 1). In 2010, the urbanization rate of the RMGV-ES amounted to 98.3%. The water supply reaches a significant share of the population (98.1%). The value of the Human Development Index (HDI) is high (0.772) and the region ranks eighth among the 20 Brazilian metropolitan regions (PNUD, 2010).
Treated water was collected throughout six consecutive months, from May to October 2016. The quality of fluoridated water was assessed based on optimal fluoride concentration values observed in the distribution network for obtaining the preventive effect, assuming that these values represent the main critical point of a complex chain of events regarding the stages of water supply, from catchment to consumer.
2.1. Setting the location of sampling points
The sampling points were established by taking into account the water-treatment plants (ETS) and treated-water reservoirs (RAT) as reference units (RU) in compliance with the Sampling Guide for Surveillance of Fluoride Concentration in Public Water Supply provided by the Collaborating Center of the Brazilian Ministry of Health for Oral Health Surveillance (www.cecol.fsp.usp.br). The selected ETS were the ones supplying 80% of the population of each municipality. In one municipality where 77% of the population had access to treated water, all ETS were included in the survey (Frazão and Narvai, 2017).
In municipalities where there was no ETS, the RAT supplied by the selected ETS became the RU for sampling. Therefore, 18 UR were selected for the region as a whole, six samples were collected by UR, three at their nearest point and three at the most distant reach from the ETS or RAT. In all, 108 water samples were collected at different points per month, totalling 648 samples at the end of the six months of sampling. The selected points cover 91.4% of the total population of the RMGV-ES (Table 1).
Rev. Ambient. Água vol. 13 n. 6, e2270 - Taubaté 2018
Table 1. Distribution of water samples and the municipal variables that make up the RMGV-ES.
Description Cariacica Fundão Guarapari Serra Viana Velha Vila Vitória Total
Reference Units
(UR) 1 2 1 1 4 4 5 18
Sampling Points
per Month 6 12 6 6 24 24 30 108
Number of
Samples 36 72 36 36 144 144 180 648
Population Coverage by UR
80% 88% 92% 98% 77% 86% 100% 91.4%
Variables
Total Population 381,802 19,985 119,802 485,376 74,499 472,762 355,875 1,910,101 GDP per capita
(in thousand of Brazilian Real*)
18,371 24,183 15,389 33,039 20,217 21,914 64,002 -
HDI 0.718 0.718 0.731 0.739 0.686 0.800 0.845 -
Gini Index 0.473 0.500 0.592 0.491 0.450 0.568 0.612 -
Rate of
households with
running water 99.3% 95.0% 97.3% 99.1% 96.1% 99.5% 99.9% - Infant Mortality
Rate 13.20 13.60 14.40 13.20 15.60 10.90 11.40 -
Hospitalization for diarrhea (rate / 10,000)
4.00 4.00 6.70 3.10 3.90 4.90 4.50 -
Tooth-extraction/dental
procedures ratio 7.10 8,24 6,81 4,80 6,38 5,32 4,16 Access to
innovative oral primary health care
35.8% 85.1% 57.7% 50.8% 62.9% 31.1% 70.7% -
Monthly Average coverage supervised toothbrushing
1.79% 0.44% 1.41% 2.54% 0.33% 2.46% 5.96% -
Note: *The official currency of Brazil. GDP: Gross Domestic Product, HDI: Human Development Index.
2.2. Sampling and Analysis of the Fluoride Content
Rev. Ambient. Água vol. 13 n. 6, e2270 - Taubaté 2018
days, at previously set points. At the end of each week of collection, samples were sent for analysis to the Biochemistry Laboratory from Piracicaba Dentistry School - University of Campinas, São Paulo, Brazil (FOP-UNICAMP).
The content of fluoride in the water samples was determined in duplicate, using an ion specific electrode, coupled to the potentiometer, due to its practicability and sensitivity. This electrode was previously calibrated with standard solutions containing 0.1, 0.2, 0.4, 0.8, 1.6 or 3.2 mg fluoride. Only calibration curves with a maximum variation of 5% were accepted. The reliability of the results were checked with a new reading of 10% of the samples (Frazão & Narvai, 2017).
2.3. Classification of the Samples
Considering that the average annual maximum daily temperatures ranged from 28ºC to 32ºC (Incaper, 2016), the fluoride content of the samples were classified according to two interpretation criteria described below.
Criterion I: according to federal act (Brasil, 1976), the samples were classified as suitable
for content between 0.6 mg F / L and 0.8 mg F / L, inadequate low when < 0.6 mg F / L and inadequate high when > 0.8 mg F / L. The optimum fluoride content for the region is set to be
0.7 mg F / L, with a minimum limit of 0.6 mg F / L and a maximum limit of 0.8 mg F / L (variation of 0.1 mg F / L).
Criterion II: in compliance with the technical consensus document (CECOL, 2011), the samples were classified into six categories according to the prevention of dental caries and the inherent risk of dental fluorosis. The categories are: benefit and negligible risk (0.00 to 0.44 mg F / L); minimal benefit and low risk (0.45 to 0.54 mg F/L); maximum benefit and low risk (0.55 to 0.84 mg F/L); maximum benefit and moderate risk (0.85 to 1.14 mg F/L); questionable benefit and high risk (1.15 to 1.44 mg F/L); and damage and very high risk (>1.45 mg F/L).
2.4. Quality Level of Fluoridation
The quality level of fluoridation was set by the percentage of samples included in the interval of optimal concentration values to obtain the preventive effect as per each criterion of interpretation shown below. Similarly to Pelletier (2004), it was assumed that 80 percent or more of samples within optimal values constituted high quality for water fluoridation supply (Equation 1 and 2).
𝑄𝐿𝐶𝑟𝑖𝑡𝑒𝑟𝑖𝑜𝑛 𝐼 =𝑁𝑜.𝑜𝑓 𝑠𝑎𝑚𝑝𝑙𝑒𝑠 (0.6≤𝑇𝑇𝑜𝑡𝑎𝑙 𝑛𝑢𝑚𝑏𝑒𝑟 𝑜𝑓 𝑠𝑎𝑚𝑝𝑙𝑒𝑠 (𝑛)𝑓𝑙𝑢𝑜𝑟𝑖𝑑𝑒≤ 0.8) 𝑥 100 (1)
𝑄𝐿𝐶𝑟𝑖𝑡𝑒𝑟𝑖𝑜𝑛 𝐼𝐼 =𝑁𝑜.𝑜𝑓 𝑠𝑎𝑚𝑝𝑙𝑒𝑠 (0.55≤𝑇𝑇𝑜𝑡𝑎𝑙 𝑛𝑢𝑚𝑏𝑒𝑟 𝑜𝑓 𝑠𝑎𝑚𝑝𝑙𝑒𝑠 (𝑛)𝑓𝑙𝑢𝑜𝑟𝑖𝑑𝑒≤ 0.84) 𝑥 100 (2)
2.5. Characteristics of the Municipal Development
Demographic, economic, sanitation, health conditions, human development, income inequality and oral health care indicators obtained from official sources (PNUD, 2010; Brasil, 2016; IBGE, 2015) were used in order to explore possible relationships with the quality level of fluoridation, as described below:
- demographic: data of the total population of each municipality estimated for the year 2015 were used, assuming that more populous municipalities would gather conditions and resources that would be reflected in higher quality levels of fluoridation.
- economic: the gross domestic product (GDP) per capita was used, considering that municipalities with higher economic output would have more resources and, consequently, better quality levels of fluoridation.
Rev. Ambient. Água vol. 13 n. 6, e2270 - Taubaté 2018
period from 2010 to 2015, since both indicators reflect municipal-level health conditions, assuming that poorer conditions would be related to low quality levels of fluoridation.
- human development: the HDI was used, assuming that municipalities with the worst indicators of education, longevity and income would also have low quality levels of fluoridation.
- income inequality: the Gini index (which ranges from 0 to 1) was used for the year 2010, considering that higher values of inequality in income distribution would be associated with municipalities with low investment in public policies, reflecting lower levels of fluoridation.
- sanitation: percentage of households with running water in 2010, considering that lower rates of access to treated water would correlate with worse quality levels of fluoridation.
- oral health care: access rate to innovative oral primary health care provided by dental health teams in the Health Family Strategy (WHO, 2008), ratio of the extractions of permanent teeth in relation to the total number of individual dental procedures that were performed, monthly average coverage of supervised toothbrushing related to 2015. These indicators were used assuming that better indicators of oral health care would correlate with better levels of water fluoridation quality.
2.6. Statistical Analysis
Absolute and relative frequencies were calculated according to both sample classification criteria. The quality level of community water fluoridation was measured and Spearman's non-parametric test was used to analyze the correlation between the outcome and the characteristics of the municipalities according to Criterion II. Correlation values were classified as strong for 0.5 or higher, moderate for values ranging from 0.3 to 0.5, and weak for values between 0.1 and 0.244 (Cohen, 1988). Interpretation criteria of fluoride content in water were compared using Kappa statistics. The similarity levels were assessed according to the categories proposed by Landis and Koch (1977). In order to make it possible to compare the values recommended by the legislation with the ones proposed by CECOL, they were sorted out into three categories: negligible benefit / minimum risk; maximum benefit / low risk; and maximum benefit / moderate to very high risk. The level of significance adopted for rejection of the null hypothesis was 5%. Statistical Package for the Social Sciences (SPSS), Version 20.0 was used.
3. RESULTS AND DISCUSSION
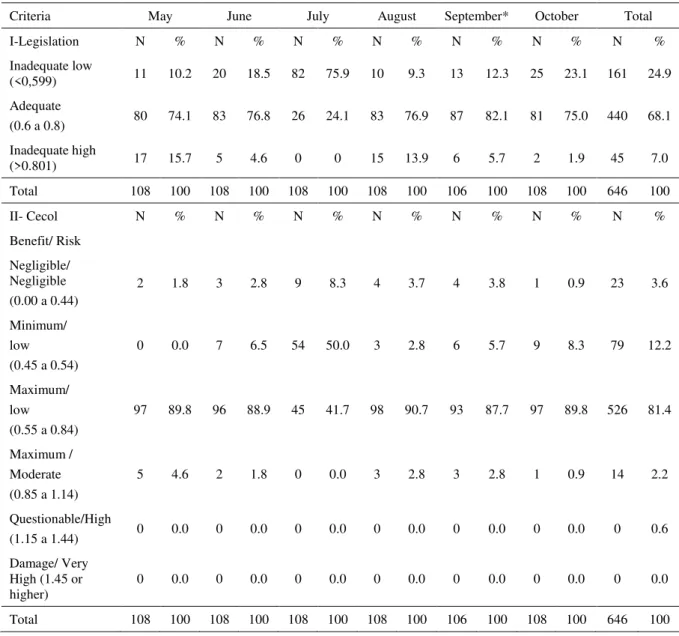
A total of 646 samples were analyzed from May to October 2016, because two samples were lost during the analysis process. Table 2 shows that 68.1% of the samples showed adequate fluoride content in the water according to the Criterion I classification. The percentage of adequate samples according to the Criterion II was 81.4%; therefore, with maximum benefit against tooth decay and low risk of fluorosis. However, the rate of adequate samples decreased considerably in July, 24.1% and 41.7%, respectively for Criteria I and II.
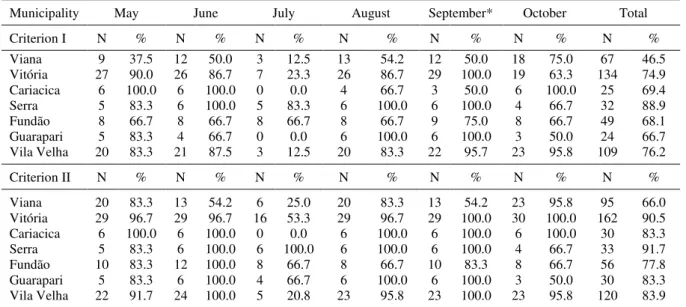
Table 3 illustrates the rates of optimal fluoride levels by municipality throughout the six months of sampling. The differences were remarkable according to the used criterion. As shown in the last column, only the municipality of Serra showed a high level of quality in both criteria. Vitoria and Cariacica would present nonconformity if only Criterion I were adopted. The lowest rates were observed in the city of Viana, according to both criteria (46.5% according to Criterion I and 66% according to Criterion II). In all municipalities, the month of July showed disproportions in the concentration of fluoride. The municipality of Cariacica did not show any optimal value in both criteria in that month. In spite of the observed differences between the criteria, the Kappa statistic was 0.671, showing substantial agreement (p-value <0,001).
Rev. Ambient. Água vol. 13 n. 6, e2270 - Taubaté 2018
observed, when one analyzes each municipality, some irregularities stood out. It is worth noting that all the samples of the municipality of Cariacica in July were inadequate according to both criteria.
Table 2. Classification of samples according to fluoride concentration values (mg F / L) (Criterion I and II) in the RMGV-ES.
Criteria May June July August September* October Total
I-Legislation N % N % N % N % N % N % N %
Inadequate low
(<0,599) 11 10.2 20 18.5 82 75.9 10 9.3 13 12.3 25 23.1 161 24.9
Adequate
(0.6 a 0.8) 80 74.1 83 76.8 26 24.1 83 76.9 87 82.1 81 75.0 440 68.1 Inadequate high
(>0.801) 17 15.7 5 4.6 0 0 15 13.9 6 5.7 2 1.9 45 7.0
Total 108 100 108 100 108 100 108 100 106 100 108 100 646 100
II- Cecol N % N % N % N % N % N % N %
Benefit/ Risk Negligible/ Negligible (0.00 a 0.44)
2 1.8 3 2.8 9 8.3 4 3.7 4 3.8 1 0.9 23 3.6
Minimum/ low (0.45 a 0.54)
0 0.0 7 6.5 54 50.0 3 2.8 6 5.7 9 8.3 79 12.2
Maximum/ low (0.55 a 0.84)
97 89.8 96 88.9 45 41.7 98 90.7 93 87.7 97 89.8 526 81.4
Maximum / Moderate (0.85 a 1.14)
5 4.6 2 1.8 0 0.0 3 2.8 3 2.8 1 0.9 14 2.2
Questionable/High
(1.15 a 1.44) 0 0.0 0 0.0 0 0.0 0 0.0 0 0.0 0 0.0 0 0.6
Damage/ Very High (1.45 or higher)
0 0.0 0 0.0 0 0.0 0 0.0 0 0.0 0 0.0 0 0.0
Total 108 100 108 100 108 100 108 100 106 100 108 100 646 100
*Two samples were lost during the analysis process.
Rev. Ambient. Água vol. 13 n. 6, e2270 - Taubaté 2018
Table 3. Percentage of optimal concentration values according to the month and the municipalities of the RMGV-ES, as per Criterion I and II.
Municipality May June July August September* October Total
Criterion I N % N % N % N % N % N % N %
Viana 9 37.5 12 50.0 3 12.5 13 54.2 12 50.0 18 75.0 67 46.5 Vitória 27 90.0 26 86.7 7 23.3 26 86.7 29 100.0 19 63.3 134 74.9 Cariacica 6 100.0 6 100.0 0 0.0 4 66.7 3 50.0 6 100.0 25 69.4 Serra 5 83.3 6 100.0 5 83.3 6 100.0 6 100.0 4 66.7 32 88.9
Fundão 8 66.7 8 66.7 8 66.7 8 66.7 9 75.0 8 66.7 49 68.1
Guarapari 5 83.3 4 66.7 0 0.0 6 100.0 6 100.0 3 50.0 24 66.7 Vila Velha 20 83.3 21 87.5 3 12.5 20 83.3 22 95.7 23 95.8 109 76.2
Criterion II N % N % N % N % N % N % N %
Viana 20 83.3 13 54.2 6 25.0 20 83.3 13 54.2 23 95.8 95 66.0 Vitória 29 96.7 29 96.7 16 53.3 29 96.7 29 100.0 30 100.0 162 90.5 Cariacica 6 100.0 6 100.0 0 0.0 6 100.0 6 100.0 6 100.0 30 83.3 Serra 5 83.3 6 100.0 6 100.0 6 100.0 6 100.0 4 66.7 33 91.7 Fundão 10 83.3 12 100.0 8 66.7 8 66.7 10 83.3 8 66.7 56 77.8 Guarapari 5 83.3 6 100.0 4 66.7 6 100.0 6 100.0 3 50.0 30 83.3 Vila Velha 22 91.7 24 100.0 5 20.8 23 95.8 23 100.0 23 95.8 120 83.9
*Two water samples were lost during the analysis process.
Note: Criterion I – Range values from 0.6 to 0.8 mg F/L Criterion II – Range values from 0.55 to 0.84 mg F/L.
The differences related to the rates of optimal fluoride levels observed between the criteria may be associated to some points. First, the legislation criterion enacted in 1975 uses only one decimal place for interpretation of the results, unlike the CECOL criterion that uses at least two decimal places. The interpretation of the fluoride values through criterion that considers two or more decimal places is compatible with the advanced and the greater precision of the measurement methods currently employed. Consequently, a greater number of samples are included in the category of maximum preventive benefit, without implying an undesirable increase in the interval corresponding to the expected level of quality. A second point refers to the classification categories. Criterion II adopts six categories based on the current scientific evidence that water fluoridation can be considered a protective and risky factor simultaneously.
Regarding the parameters for assessing the benefits of fluoride content in water for human consumption, the Ordinance of the Ministry of Health (Brazil) Nº. 2914 from 2011 refers to the standards included in Administrative Rule MS No. 635 of 1975 (Brasil, 1976). This normative device is outdated and needs to be revised (Frazão et al., 2011). In addition, because it presents a dichotomous classification, experts have noted that it is an undesirable interpretative reduction (Venturini et al., 2016), and have emphasized that it does consider the balance between benefits and risks to health (Frazão et al., 2011). Although most of the studies (75%) used the dichotomous (adequate/inadequate) classification criterion, it is acknowledged that these narrow down the options for interpretation and attribution of meaning to the characteristics of the samples (Cecol, 2011; Bergamo et al., 2015).
In addition, fluoride concentrations between 1.0 and 1.7 mg F/L would be tolerated for Criterion I at mean temperatures lower than those observed in the metropolitan region under study. These values are recognized as very high according to current scientific evidence. The CECOL criterion recommends the maximum concentration of 0.94 mg F/L for mean temperatures below 26.3º, corresponding to the combination of maximum benefit against tooth decay and low risk of fluorosis.
Rev. Ambient. Água vol. 13 n. 6, e2270 - Taubaté 2018
samples that would be otherwise considered inadequate, to the categories indicating zero and minimum preventive benefit to dental health and moderate and high risk to fluorosis, situations that require different measures and arrangements from the environmental monitoring point of view.
In the metropolitan region throughout the period under study, the nonconformities were more frequent with respect to benefit reduction than with respect to an increase in risk, a result similar to that observed in the municipality of Jaguaribara, in the state of Ceará, whose temperature was similar to the metropolitan area of the present investigation (Peixoto et al., 2012). In Lages, Santa Catarina state, where the climate was cooler and the average annual value of the maximum daily temperatures ranged between 21.5ºC and 26.3ºC, a study found a lower compliance rate according to the CECOL criterion and the nonconformities were more frequent (45% of the samples) with respect to risk (Kuhnen et al., 2017).
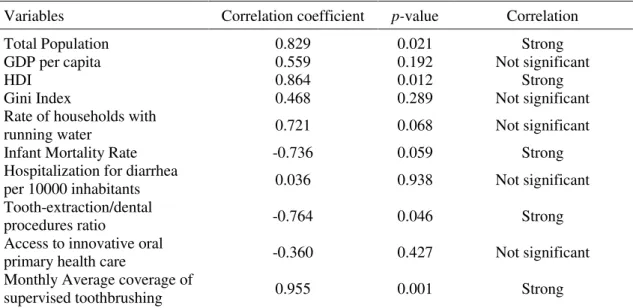
As shown in the Table 4, the variables Gini index, GDP per capita, access to innovative oral primary healthcare, percentage of the households with running water and rate of hospitalization for diarrhea per 10 thousand inhabitants did not show statistically significant correlation values with the rates of optimal fluoride levels based on Criterion II. Values of strong positive correlation were found between the outcome and the following indicators: municipal HDI (r = 0.864; p-value = 0.012), average supervised brushing (r = 0.955, p-value = 0.001) and the total population (r = 0.829; pvalue = 0.021). The infant mortality rate (r = -0.736, p-value = 0.059) and the tooth extraction/dental procedures ratio (r = -0.764, p-value = 0.046) showed strong and negative correlation.
The findings show that the quality level of the community water fluoridation may mirror local municipal factors. The values in the municipalities increase as values of HDI and population size increase. A study also found a relationship between the highest percentages of compliance with the fluoridation standard in larger scale systems and municipalities with higher HDI (Daré et al., 2009).
Table 4. Spearman’s correlation between the quality level of community water fluoridation
according to Criterion II and the municipal-level indicators.
Variables Correlation coefficient p-value Correlation
Total Population 0.829 0.021 Strong
GDP per capita 0.559 0.192 Not significant
HDI 0.864 0.012 Strong
Gini Index 0.468 0.289 Not significant
Rate of households with
running water 0.721 0.068 Not significant
Infant Mortality Rate -0.736 0.059 Strong
Hospitalization for diarrhea
per 10000 inhabitants 0.036 0.938 Not significant
Tooth-extraction/dental
procedures ratio -0.764 0.046 Strong
Access to innovative oral
primary health care -0.360 0.427 Not significant
Monthly Average coverage of
supervised toothbrushing 0.955 0.001 Strong
Note: GDP: Gross Domestic Product according to the officialcurrencyof Brazil; HDI: Human Development Index.
Rev. Ambient. Água vol. 13 n. 6, e2270 - Taubaté 2018
the adoption of such preventive measure is delayed in cities with worse socioeconomic and demographic indicators, such as HDI, Gini index and GDP per capita (Peres et al., 2004). Municipalities with the worst HDI offer dental services with mutilating characteristics, which is probably related to difficult access to services and poor oral health conditions in those places (Fernandes and Peres, 2005; Fischer et al., 2010).
The highest quality levels in the municipalities with the largest populations may be related to the better municipal conditions of structure, organization and human resources in the water quality control program. In a study conducted in the US state of Illinois, less populated areas reported higher rates of nonconformity in the maintenance of adequate levels of fluoride in water (Kuthy et al., 1985).
Queiroz et al. (2012) also pointed out that small municipalities have difficulties in developing any corrective action based on the results of the analyses of water monitoring reports. In smaller municipalities, the lack of specialized manpower and the lack of training for the professionals that operate water treatment plants, and the lack of inspection structure and experience in controlling the fluoridation process are possible causes for difficulties in
maintaining the appropriate concentrations of fluoride in public utilities’ water supplies
(Stancari et al., 2014).
The relationship between the municipal health indicators and the quality standard of fluoridation may reflect the fragility of the organization of services provided to the population, both in terms of health care and basic sanitation. The improvement of basic sanitation has a high impact on infant mortality. In this study, municipalities with higher infant mortality rates, an indicator that expresses the level of health of a population (Nascimento et al., 2014), showed the lowest rates of water fluoridation quality.
Among the indicators of oral healthcare, the monthly average coverage of supervised toothbrushing correlated positively with the quality of fluoridation. Both measures, fluoridation and supervised toothbrushing, are priorities of the national oral health policy (Brasil, 2004) and are essential for improving oral health conditions; they should be incorporated with other community health measures. Therefore, when absent or incipient, they may represent the ineffectiveness of local oral health policy regarding the provision of public policies aimed at the prevention of dental caries. It was also observed that the higher the tooth-extraction/dental procedures ratio, the lower the quality level of fluoridation. This negative correlation may mirror how structured local dental services are. Municipalities that have a well-structured dental practice associated with an adequate offer of scheduled consultations to the population tend to have a lower rate of exodontia (Celeste et al., 2011). Besides access to dental treatment, other factors also interfere with the rate of exodontia, such as socioeconomic conditions and level of education (Rihs et al., 2007; Pearson et al., 2001).
It is thus important to consider that the maintenance of high quality levels of water fluoridation could guarantee the benefits of such public health measures for the economically disadvantaged and contribute to reduce the socioeconomic bias in the prevalence of dental caries (Antunes and Narvai, 2010; Narvai et al., 2014).
The study’s potential limitations include its cross-sectional design, number of municipalities analyzed, differences between population coverage by UR and rate of households with running water in Viana. In addition, based on a more comprehensive perspective, one could argue that the quality of water fluoridation is a construct that is not limited to optimum levels of fluoride concentration involving, among other aspects, the quality
of the fluoridating substance, the level of qualification of the system’s operators and the
Rev. Ambient. Água vol. 13 n. 6, e2270 - Taubaté 2018
4. CONCLUSIONS
RMGV-ES showed a high-quality level of fluoridation according to both criteria. The CECOL criterion presented some advantages compared to the criterion based on the current legislation. The municipalities showed important differences regarding the adequacy of fluoride levels that should be the focus of attention by the control and monitoring authorities.
Whereas the demographic, human development, and monthly average coverage of supervised toothbrushing indicators correlated positively with the quality level of public policy, indicators of infant mortality and tooth-extraction/dental procedures ratio correlated negatively. Finally, the findings reinforced the relevance of water fluoridation monitoring for assuring the effectiveness and safety of the public policy and the plausibility of observed correlations may encourage further investigations on potential causal factors.
5. ACKNOWLEDGEMENTS
To the Foundation for Research Support in Espirito Santo (FAPES) for the financing of the project, obtained in FAPES no. 007/2014 UNIVERSAL - Integrated Research Project. Process number 28598.422.19193.18062015. The second author is researcher from CNPq (Grant 303681/2016-0).
6. REFERENCES
ANTUNES, J. L. F.; NARVAI, P. C. Políticas de saúde bucal no Brasil e seu impacto sobre as desigualdades em saúde. Revista de Saúde Pública, v. 44, n. 2, p. 360-365, 2010. http://dx.doi.org/10.1590/S0034-89102010005000002
ARDENGHI, T. M.; PIOVESAN, C.; ANTUNES, J. L. F. Desigualdades na prevalência de cárie dentária não tratada em crianças pré-escolares no Brasil. Revista de Saúde Pública, v. 47, n. 3, p. 129-137, 2013. http://dx.doi.org/10.1590/S0034-8910.2013047004352 BERGAMO, E. T. P.; BARBANA, M.; TERADA, R. S. S.; CURY, J. A.; FUJIMAKI, M.
Fluoride concentrations in the water of Maringá, Brazil, considering the benefit/risk balance of caries and fluorosis. Brazilian Oral Research, v. 29, n. 1, p. 1-6, 2015. http://dx.doi.org/10.1590/1807-3107BOR-2015.vol29.0047
BRASIL. Ministério da Saúde. Secretaria de Atenção à Saúde. Departamento de Atenção Básica. Coordenação Nacional de Saúde Bucal. Diretrizes da Política Nacional de Saúde Bucal. Brasília, DF, 2004.
BRASIL. Ministério da Saúde. Banco de dados do Sistema Único de Saúde-DATASUS. Disponível em: http://www.datasus.gov.br. Acesso em: 10 nov. 2016.
BRASIL. Ministério da Saúde. Portaria nº 635/ BSB, de 25 de dezembro de 1975. Aprova as normas e padrões sobre a fluoretação da água dos sistemas públicos de abastecimento destinada ao consumo humano. Diário Oficial da União, Brasília, DF, 30 jan. 1976. CELESTE, R. K.; VITAL, J. F.; JUNGER, W. L.; REICHENHEIM, M. E. Séries de
procedimentos odontológicos realizadas nos serviços públicos brasileiros, 1994-2000.
Ciência & Saúde Coletiva, v. 16, n. 11, p. 4523-4532, 2011.
Rev. Ambient. Água vol. 13 n. 6, e2270 - Taubaté 2018
CENTRO COLABORADOR DO MINISTÉRIO DA SAÚDE EM VIGILÂNCIA DA SAÚDE BUCAL – CECOL/USP. Documento de consenso técnico: classificação de águas de abastecimento público segundo o teor de flúor. In: SEMINÁRIO VIGILÂNCIA DA FLUORETAÇÃO DE ÁGUAS, 2011, São Paulo. Arquivos... São Paulo: Faculdade de Saúde Pública, Universidade de São Paulo, 2011.
COHEN, J. Statistical power analysis for the behavioral sciences. Hillsdale: Lawrence Erlbaum Associates, 1988.
DARÉ, F.; DALL’AGLIO SOBRINHO, M.; LIBÂNIO, M. Avaliação do processo de
fluoretação nos sistemas de abastecimento de água da região de Araçatuba, São Paulo.
Engenharia Sanitária e Ambiental, v. 14, n. 2, p. 173-182, 2009. http://dx.doi.org/10.1590/S1413-41522009000200005
ESPOSTI, C. D. D.; FRAZÃO, P. O relevante papel da vigilância para assegurar a efetividade da fluoretação da água de abastecimento público. Revista Brasileira de Pesquisa em Saúde, v. 17, n. 2, p. 4-6, 2015. https://doi.org/10.21722/rbps.v17i2.13180
FERNANDES, L. S.; PERES, M. A. Associação entre atenção básica em saúde bucal e indicadores socioeconômicos municipais. Revista de Saúde Pública, v. 39, n. 6, p. 930-936, 2005. http://dx.doi.org/10.1590/S0034-89102005000600010
FISCHER, T. K.; PERES, K. G.; KUPEK, E.; PERES, M. A. Indicadores de atenção básica em saúde bucal: associação com as condições socioeconômicas, provisão de serviços, fluoretação de águas e a estratégia de saúde da família no Sul do Brasil. Revista Brasileira de Epidemiologia, v. 13, n. 1, p. 126-138, 2010. http://dx.doi.org/10.1590/S1415-790X2010000100012
FRAZÃO, P.; NARVAI, P. C. Fluoretação da água em cidades brasileiras na primeira década do século XXI. Revista de Saúde Pública, v. 51, n. 47, p. 1-11, 2017. https://doi.org/10.1590/S1518-8787.2017051006372
FRAZÃO, P.; NARVAI, P. C. Cobertura e vigilância da fluoretação da água no Brasil: municípios com mais de 50 mil habitantes. São Paulo: Faculdade de Saúde Pública da USP, 202p. 2017. https://doi.org/10.11606/9788588848252
FRAZÃO, P.; PERES, M. A.; CURY, J. A. Drinking water quality and fluoride concentration.
Revista de Saúde Pública, v. 45, n. 5, p. 964-973, 2011. http://dx.doi.org/10.1590/S0034-89102011005000046
GABARDO, M. C. L.; SILVA, W. J.; OLANDOSKI, M.; MOYSÉS, S. T.; MOYSÉS, S. J. Inequalities in public water supply Fluoridation in Brazil: an ecological study. BMC Oral Health, v. 8, n. 9, p. 1-7,2008. https://doi.org/10.1186/1472-6831-8-9
INSTITUTO BRASILEIRO DE GEOGRAFIA E ESTATÍSTICA - IBGE. Estimativas da população residente para os municípios e para as Unidades da Federação brasileiros com data de referência em 1º de julho de 2015. Rio de Janeiro, 2015.
INSTITUTO CAPIXABA DE PESQUISA, ASSISTÊNCIA TÉCNICA E EXTENSÃO RURAL - INCAPER. Análise climática do trimestre janeiro a março de 2016. Boletim Climatológico Trimestral do Espírito Santo, v. 2, n. 5, 2016.
Rev. Ambient. Água vol. 13 n. 6, e2270 - Taubaté 2018
KUMAR, J. V. Is water fluoridation still necessary? Advances in Dental Research, v. 20, n. 1, p. 8-12, 2008. http://dx.doi.org/10.1177/154407370802000103
KUTHY, R. A.; NALEWAY, C.; DURKEE, J. Factors associated with maintenance of proper water fluoride levels. Journal of American Dental Association, v. 110, n. 4, p. 511-513, 1985.
LANDIS, J. R.; KOCH, G. G. The measurement of observer agreement for categorical data.
Biometrics, v. 33, n. 1, p.159-174, 1977. http://dx.doi.org/10.2307/2529310
NARVAI, P. C. Cárie dentária e flúor: uma relação do século XX. Ciência & saúde coletiva, v. 5, n. 2, p. 381-392, 2000. http://dx.doi.org/10.1590/S1413-81232000000200011 NARVAI, P. C.; FRIAS, A. C. F.; FRATUCCI, M. V. B.; ANTUNES, J. L. F.; FRAZÃO, P.
Fluoretação da água em capitais brasileiras no início do século XXI: a efetividade em questão. Saúde em Debate, v. 38, n. 102, p. 562-571, 2014. http://dx.doi.org/10.5935/0103-1104.20140052
NASCIMENTO, S. G.; OLIVEIRA, C. M.; SPOSITO, V.; FERREIRA, D. K. S.; BONFIM, C. V. Mortalidade infantil por causas evitáveis em uma cidade do Nordeste do Brasil.
Revista Brasileira de Enfermagem, v. 67, n. 2, p. 208-212, 2014. http://dx.doi.org/10.1590/S0104-12902012000200019
PEARSON, N.; CROUCHER, R.; MARCENES, W.; O'FARRELL, M. Prevalence of Oral Lesions Among a Sample of Bangladeshi Medical Users Aged 40 Years and over Living in Tower Hamlets, UK. International Dental Journal, v. 51, n. 1, p. 30-34, 2001. http://dx.doi.org/10.1002/j.1875-595X.2001.tb00814.x
PEIXOTO, D.F.; ALENCAR, K.P.; PEIXOTO, R.F.; SOUSA, C.F.M.; SAMPAIO, F.C.; FORTE, F.D.S. Heterocontrole da fluoretação da água de abastecimento público do município de Jaguaribara, Ceará, Brasil. Revista Brasileira em Promoção da Saúde, v.25, n.3, p.271-277, 2012. http://dx.doi.org/10.5020/2255
PELLETIER, A.R. Maintenance of optimal fluoride levels in public water systems. Journal of Public Health Dentistry, v. 64, n.4, p.237-239, 2004. http://dx.doi.org/10.1111/j.1752-7325.2004.tb02759.x
PERES, M.A.; FERNANDES, L.S.; PERES, K.G. Inequality of water in Southern Brazil – the inverse equity hypothesis revisited. Social Science & Medicine, v. 58, n. 6, p. 1181-1189, 2004. https://doi.org/10.1016/S0277-9536(03)00289-2
PROGRAMA DAS NAÇÕES UNIDAS PARA O DESENVOLVIMENTO - PNUD. Atlas do Desenvolvimento humano no Brasil. Brasília: Programa das Nações Unidas para o Desenvolvimento, 2010. Disponível em: http://www.atlasbrasil.org.br/2013/ Acesso em: 10 set. 2016.
QUEIROZ, A. C. L.; CARDOSO, L. S. M.; SILVA, S. C. F.; HELLER, L.; CAIRNCROSS, S. Programa Nacional de Vigilância em Saúde Ambiental Relacionada à Qualidade da Água para Consumo Humano (VIGIAGUA): lacunas entre a formulação do programa e sua implantação na instância municipal. Saúde e Sociedade, v. 21, n. 2, p. 465-478, 2012. http://dx.doi.org/10.1590/S0104-12902012000200019
Rev. Ambient. Água vol. 13 n. 6, e2270 - Taubaté 2018
RUGG-GUNN, A. J.; DO, L. Effectiveness of water fluoridation in caries prevention.
Community Dentistry and Oral Epidemiology, v. 40, n. 2, p. 55-64, 2012. https://doi.org/10.1111/j.1600-0528.2012.00721.x
STANCARI, R. C. A.; DIAS JÚNIOR, F. L.; FREDDI, F. G. Avaliação do processo de fluoretação da água de abastecimento público nos municípios pertencentes ao Grupo de Vigilância Sanitária XV-Bauru, no período de 2002 a 2011. Epidemiologia e Serviços de Saúde, v. 23, n. 2, p. 239-248, 2014. http://dx.doi.org/10.5123/S1679-49742014000200005
VENTURINI, C. Q.; NARVAI, P. C.; MANFREDINI, M. A.; FRAZÃO, P. Vigilância e monitoramento de fluoretos em águas de abastecimento público: uma revisão sistemática.
Revista Ambiente & Água, v. 11, n. 4, p. 972-988, 2016. http://dx.doi.org/10.4136/ambi-agua.1929
YARMOLINKY, J.; RATNAPALAN, S.; KENNY, D. J. Variation in urban and rural water fluoride levels in Ontario. Journal of Canadian Dental Association, v. 75, n. 10, p. 707, 2009.
WORLD HEALTH ORGANIZATION –WHO. Brazil’s health system reaches out to the poor.
Rev. Ambient. Água vol. 13 n. 6, e2270 - Taubaté 2018 Supplementary Table. Agreement between classfication Criterion I and II of fluoride concentration values in public utilities’ water supply.
Criterion I
Inadequate Low Adequate Inadequate High Total Simple Percentage Kappa IC95% p-value Kappa
Criterion II
Negligible Benefit/
Minimum Risk 102 0 0 102
Maximum Benefit /
Low risk 59 440 27 526 86.69% 0.671 0.61 to 0.73 <0.001
Maximum Benefit / Moderate to Very
High Risk 0 0 18 18