University of Algarve
Faculty of Sciences and Technology
Professional Activity Report
(To obtain the Master degree in Biological Engineering)
Tânia Cristina da Luz Palma
Supervisor: Prof. Dr. Anabela Romano
Supervisor: Prof. Dr. Maria Clara Costa
FCT/UALG
Faro
2013
Faculty of Sciences and Technology
Professional Activity Report
(To obtain the Master degree in Biological Engineering)
Tânia Cristina da Luz Palma
Supervisor: Prof. Dr. Anabela Romano
Supervisor: Prof. Dr. Maria Clara Costa
FCT/UALG
Faro
2013
(To obtain the Master degree in Biological Engineering)
"Declaração de autoria de trabalho"
"Declaro ser a autora deste trabalho, que é original e inédito. Autores e trabalhos consultados estão devidamente citados no texto e constam da listagem de referências incluídas."
"The content of this report is of the exclusive responsibility of the author"
Copyright – Tânia Cristina da Luz Palma. Universidade do Algarve. Faculdade de
Ciências e Tecnologia.
"A Universidade do Algarve tem o direito, perpétuo e sem limites geográficos, de arquivar e publicitar este trabalho através de exemplares impressos reproduzidos em papel ou de forma digital, ou por qualquer outro meio conhecido ou que venha a ser inventado, de o divulgar através de repositórios científicos e de admitir a sua cópia e distribuição com objectos educacionais ou de investigação, não comerciais, desde que seja dado crédito ao autor e editor."
I am deeply grateful to Professor Dr. Maria Clara Costa to give me the opportunity to work in her research group in Environmental Technology Laboratory and also I would like to express my sincere gratitude to Professor Dr. Anabela Romano that gave me the chance to integrate her research team.
I would like to address my special thanks to Dr. Robert Renaville that accepted me in his team in Progenus S.A.
I am also grateful to Dr. Olinda Monteiro for her guidance and support.
I am thankful to all them for their guidance along my professional activity and for their support.
I am grateful to all members of team from where I had the lucky to pass for all the joy and very good moments that I spent with them.
I am especially thankful to Sandra Gonçalves and Ana Assunção for their unconditional support and to Tiago for his help.
In a personal level, I am deeply thankful to my family, especially to my grandparents, to my cousin Palminha and to my godmother Bárbara and Manuel, to Smail and to all my friends old and new.
I will be forever grateful to my parents that always give me strength and all the support that I need to go ahead and fulfill my dreams.
I
I.
Summary of professional activity
After completing my degree in Biotechnological Engineering, I did a professional training of 6 months in the enterprise Progenus S.A. (Gembloux – Belgium) financed under the Leonardo da Vinci Program and during two years and two and half months I was research fellow in the research project FCT: PTDC/AGR-AAM/102664/2008 with the title "Is Plantago almogravensis an aluminium hyperaccumulator? Elucidation of the tolerance mechanism using micropropagated plants" under the supervision of Prof. Dr. Anabela Romano. Currently, I am working in environmental remediation for metal removal and/or recovery using chemical and biological approaches, under the coordination of Prof. Dr. Maria Clara Costa – Centro de Ciências do Mar do Algarve. In Progenus S.A. my work consisted at genotyping and in the identification of SNPs (Single Nucleotide Polymorphisms) of interest and of major genes affecting the regulation, composition and percentage of fatty acids (FA) and of mono-unsaturated fatty acids (MUFAs) in the milk cows. The results presented are part of my traineeship report. As research fellow, in the project FCT: PTDC/AGR-AAM/102664/2008, my work was based in the use of micropropagation techniques as well as subsequent assays to assess aluminium (Al) tolerance of Plantago almogravensis and P. algarbiensis that are two critically endangered plantain species. From this professional activity resulted three publications of papers in international journals with referees index (ISI) and the exposure of a poster at an international conference.
Actually, I am working in the Environmental Technologies laboratory in bioremediation studies. This work includes enrichment of anaerobic bacteria communities from environmental samples and screening of their resistance and ability to recover palladium(II) from aqueous media. Simultaneously, other study is in course, which consists on the synthesis of metal sulphide nanoparticles using sulphide generated by sulphate-reducing bacteria (SRB). The obtained nanoparticles are being applied in the degradation of emerging pollutants.
Keywords: Polymerase chain reaction (PCR); Single nucleotide polymorphisms
(SNPs); Plant in vitro propagation; Aluminium tolerance; Bio-recovery; Synthesis of metal sulphide nanoparticles
II
II.
Resumo da atividade profissional
Após concluir a licenciatura em Engenharia Biotecnológica fiz um estágio profissional de 6 meses na Empresa Progenus S.A. (Gembloux-Bélgica) financiado pelo Programa Leonardo Da Vinci. Durante dois anos e dois meses e meio foi Bolseira de Investigação no Projeto de Investigação FCT: PTDC/AGR-AAM/102664/2008 com o título “Será a espécie Plantago almogravensis hiperacumuladora de alumínio? Elucidação dos mecanismos de tolerância usando plantas micropropagadas” sob a orientação da Prof. Dr. Anabela Romano. Atualmente, estou a fazer um estudo de Remediação Ambiental para remoção e/ou recuperação de metais usando estratégias químicas e biológicas, sob a direção da Prof. Dr. Maria Clara Costa – Centro de Ciências do Mar do Algarve. Na empresa Progenus S.A. o meu trabalho consistiu na genotipagem e na identificação de Polimorfismos de Nucleótidos Simples (SNPs) de interesse e na identificação dos principais genes que afetam a regulação, composição e percentagem de ácidos gordos (FA) e de ácidos gordos monoinsaturados (MUFAs) em bovinos leiteiros. Estudos anteriores demonstraram que as enzimas Esterase-coenzima A desaturase (SCD), a Proteína de Ligação ao Elemento Regulador de Esterol-1 (SRBP-1) e a Síntase de ácidos gordos (FASN) apresentavam interessantes correlações entre a sua atividade enzimática e a composição de ácidos gordos (FA) e na percentagem de ácidos gordos mono-insaturados (MUFAs). Para a genotipagem dos genes SCD, SREBP-1 e FASN procedeu-se à otimização de métodos baseados em reação em cadeia da polimerase (PCR).
Os genes de 5 raças de gado bovino, Holstein, Simmental, Blanc Blue, Pie Rouge, Pie Noir, foram genotipados no exão 5 de SCD, no intrão 5 de SREBP-1. Procedeu-se a um ensaio SNapShot para uma rápida deteção de polimorfismos de nucleótidos simples (SNPs) existentes no domínio da Tioesterase (TE) e dos exões 1 e 34.
Na Bélgica, a raça Holstein é a mais importante em termos de produção de leite. No exão 5 do gene SCD, três importantes SNP foram encontrados, no entanto só um na posição 10329 codifica para um codão diferente AA: alanina (alelo C) ou valina (alelo T). Uma inserção longa nos 84 pares de bases (tipo longo: L) e uma deleção (tipo curto: S) foram encontradas no intrão 5 no SREBP-1 do gado estudado. Todas as Holstein estudadas para o genótipo SREBP-1 apresentaram o tipo LL sendo assim homozigóticas para o tipo L. A nível do gene FASN foi verificada a existência do tipo homozigótico
III g.17924GG para o qual se verifica uma maior quantidade de ácidos gordos monoinsaturados no leite.
Os resultados apresentados nesta Tese pertencem ao meu relatório de estágio profissional entregue ao Dr. Renaville e ao Gabinete de Mobilidade da UALG.
Como Bolseira de Investigação no projeto FCT: PTDC/AGR-AAM/102664/2008 o meu trabalho baseou-se na utilização de técnicas de micropropagação e nos subsequentes ensaios para avaliar a tolerância ao alumínio de duas espécies em perigo de extinção,
Plantago almogravensis e P. algarbiensis. Alguns estudos sugeriram que estas espécies
têm a capacidade de tolerar elevadas concentrações de elementos tóxicos como o Alumínio, podendo ser a bioacumulação uma estratégia de sobrevivência. Protocolos de propagação in vitro destas espécies permitem a sua produção em larga escala possibilitando assim o seu estudo em condições laboratoriais controladas. Então foram utilizadas técnicas que permitiram avaliar a forma como o pH afeta o crescimento in
vitro e estudar os efeitos do alumínio no crescimento de rebentos e plântulas e nos
parâmetros bioquímicos e fisiológicos de ambas as espécies de Plantago.
Observou-se que o pH do meio não afetou a proliferação e o enraizamento in vitro. Os resultados obtidos permitiram concluir que as espécies de Plantago estão aptas para crescer in vitro num meio com um valor de pH mais baixo que o normalmente utilizado em culturas de tecidos vegetais, o que está de acordo com o fato que ambas as espécies colonizam solos ácidos. Ambas as espécies acumulam quantidades semelhantes e consideráveis de Al nos seus tecidos, principalmente nas raízes. A espécie P.
algarbiensis quando submetida a pH baixo e à exposição de Al sofreu um decréscimo
no conteúdo dos pigmentos fotossintéticos dos rebentos.
Contudo, demonstrou-se que ambas as espécies são tolerantes ao Al3+ e ao H+ e que P.
almogravensis parece ter uma maior capacidade de adaptação permitindo manter a sua
fisiologia celular e crescimento nestas condições de stress. Algumas elucidações acerca de como os ácidos orgânicos e compostos fenólicos tomam parte no mecanismo de tolerância ao alumínio de P. algarbiensis and P. almogravensis.
Foram estudados os requisitos de temperatura/luz na germinação e os efeitos do Al na germinação das sementes. Os melhores resultados de germinação foram obtidos aos 15ºC para a luz e escuro, juntamente com o menor tempo de germinação média. Estes resultados são essenciais para o desenvolvimento de estratégias de conservação para estas espécies de Plantago.
IV Desta atividade profissional resultaram três artigos publicados em revistas internacionais com índex (ISI) e a exposição de um Poster numa Conferência internacional.
Neste momento, estou a trabalhar no Laboratório de Tecnologias Ambientais. Este trabalho inclui o enriquecimento de comunidades bacterianas provenientes de amostras ambientais e o screening da sua resistência e capacidade de recuperar Metais do Grupo da Platina (PGMs), nomeadamente o Paládio (II). Entre as várias amostras testadas provenientes da recolha de lamas de uma Planta de Tratamento de Águas Residuais de Lagos (Sul de Portugal) isolou-se um consórcio bacteriano resistente ao metal com a capacidade de recuperar Pd (II). Esta comunidade bacteriana foi mantida em condições anaeróbias em meio com e sem sulfato. O consórcio teve a capacidade de recuperar 50 mg/L de Pd (II) de uma solução aquosa. E removeu 98% de Pd (II) de uma solução aquosa contendo 70 mg/L de Pd (II) na presença de sulfato e 82.7% de 70 mg/L de Pd (II) na ausência de sulfato. Desta forma, este consórcio demonstrou uma excelente resistência ao paládio (II), consequentemente pode ser um potencial candidato à remoção de Pd (II) de um meio aquoso. Uma vez que é difícil manter uma ótima performance da cultura, está a decorrer um estudo de quais as melhores condições de armazenamento e a estabilidade da comunidade bacteriana.
Simultaneamente, outro estudo está a decorrer. Este consiste na síntese de nanopartículas de sulfuretos metálicos usando o sulfureto produzido pelas bactérias sulfato-redutoras.
Os precipitados de ZnS e PbS e os seus nanocómpositos de TiO2 são obtidos através da síntese na qual se utiliza sulfureto gerado pelas bactérias sulfato redutoras, os quais são analisados por difração de Raio-X (DRX). Os precipitados dos nanocómpositos de ZnS-TiO2 e PbS- TiO2 obtidos, analisados por DRX revelou a existência de rutilo e anatase, duas das formas cristalinas de TiO2, o tamanho das partículas dos nanocómpositos foi estimado na ordem dos 20 nm. As nanopartículas obtidas estão a ser aplicadas em estudos de degradação de poluentes emergentes.
Palavras-chave: Reação em cadeia da Polimerase (PCR); Polimorfismos de
nucleotídeos simples (SNPs); Propagação in vitro de plantas; Tolerância ao alumínio; Bio-recuperação; Síntese de nanopartículas de sulfuretos metálicos
V
III. Table of contents
I. Summary of professional activity... I
II. Resumo da actividade professional... II
IV. Image list... IX
V. Table list... XIII VI. Abbreviations... XV
VII. Technical and Scientific description... 1
Chapter 1 - Improvement of the dietetic and nutritional qualities of milk and milk’s by-products by selection of the genetic potential of cattle... 1
1.1. Summary... 1
1.2. Introduction... 3
1.2.1. SCD gene... 4
1.2.2. SREBP-1 gene... 6
1.2.3. Fatty acid synthase (FASN) gene... 8
1.3. Objectives... 11
1.4. Material and methods... 12
1.4.1. Solutions and buffers... 12
1.4.2. Methods... 12
1.4.2.1. Fast DNA extraction from whole bovine blood... 12
1.4.2.2. PCR-RFLP – SCD gene... 13
1.4.2.3. PCR – SREBP-1 gene... 14
1.4.2.4. PCR and SNapShot assay – FASN gene... 14
1.5. Results... 16
1.5.1. PCR-RFLP – SCD gene... 16
1.5.2. PCR – SREBP-1 gene... 18
1.5.3. PCR and SNapShot assay – FASN gene... 19
1.6. Discussion... 23
1.7. Conclusion... 25
1.8. Bibliographic references... 26
Chapter 2 - Study of aluminum tolerance in Plantago almogravensis and P. algarbiensis species... 28
VI
2.2. Introduction... 29
2.3. Objectives... 31
2.4. Material and Methods... 32
2.4.1. Plant material and growth conditions... 32
2.4.2. How medium pH affects in vitro growth and biochemical parameters... 32
2.4.2.1. Determination of lipid peroxidation... 33
2.4.2.2. Enzyme assays and soluble protein... 33
2.4.3. Effect of low pH and Al on growth, biochemical and physiological parameters of P. almogravensis and P. algarbiensis... 34
2.4.3.1. Stress treatments... 34
2.4.3.2. Plant growth and relative water content... 35
2.4.3.3. Determination of Al and nutrients contents... 35
2.4.3.4. Enzyme assays and soluble protein... 35
2.4.3.5. Photosynthetic pigments analysis... 35
2.4.4. Insights on Al tolerance mechanism: Effects of Al in the activity of the enzymes related to the organic acids metabolism... 35
2.4.5. Study of seed germination requirements... 36
2.4.6. Statistical analysis... 37
2.5. Results and discussion... 38
2.5.1. How medium pH affects in vitro growth and biochemical parameters of P. algarbiensis and P. almogravensis... 38
2.5.2. Effect of low pH and Al on P. algarbiensis and P. almogravensis plantlet growth and biochemical parameters... 45
2.5.2.1. Effect of low pH and Al on P. algarbiensis and P. almogravensis plantlet growth... 45
2.5.2.2. Determination of Al accumulation and nutrient contents in P. algarbiensis and P. almogravensis... 50
2.5.2.3. Effect of pH and Al on biochemical and physiological parameters... 51
2.5.2.4. Photosynthetic pigments analysis... 53
2.5.3. Insights on Al tolerance mechanism: effects of Al in the activity of the enzymes related to the organic acids metabolism... 55
2.5.4. Seed germination requirements... 57
VII
2.7. Bibliographic references... 62
Chapter 3. Bio-recovery of palladium (II) and biosynthesis of metal sulphide nanoparticles by anaerobic bacterial communities... 65
3.1. Resume... 65
3.2. Palladium (II) recovery by an anaerobic bacteria community... 66
3.2.1. Introduction... 66
3.2.2 Material and methods... 67
3.2.2.1. Microorganisms and growth conditions... 67
3.2.2.2. Batch experiments... 67
3.2.2.3. Analytical methods... 68
3.2.2.4. Long term storage of anaerobic bacteria consortium... 69
3.2.3. Results and discussion... 70
3.2.4. Conclusion... 77
3.2.5. Studies in course... 78
3.3. Synthesis of metal sulphide nanoparticles using sulphide generated by sulphate-reducing bacteria (SRB)... 79
3.3.1. Introduction... 79
3.3.2. Material and methods... 82
3.3.2.1. Microorganisms and growth conditions... 82
3.3.2.2. Zinc sulphide and Lead sulphide precipitation... 82
3.3.2.3. Analytical Methods... 83
3.3.2.4. Photoreactor experiments... 83
3.3.3. Results and discussion... 85
3.3.4. Conclusion... 103
3.3.5. Studies in course... 104
3.4. Bibliographic references... 105
VIII. Detailed Curriculum vitae... 107
i) Academic degree... 107
ii) Professional experience... 107
iii) Articles... 108
iv) Poster and communications in international congresses... 108
VIII
IX
IV. Image list
Figure 1.1 – Genotyping of SCD at the 878 bp polymorphic position. Digestion of
an amplified fragment, including 878 bp polymorphic position by restriction enzyme Fnu4HI, shows genotypes AA (mutant C), VA (heterogygotic C/T), and VV (mutant T). The arrowheads show the size of the DNA fragment (bp). The DNA fragments were size fractioned by using 1% agarose gel. [7]…………... 5
Figure 1.2 – Genotyping of SREBP-1 indel polymorphism in intron 5. The
arrowheads show the size of DNA fragment (bp). These DNA fragments were size fractionated using 1% agarose gel [10]…………... 6
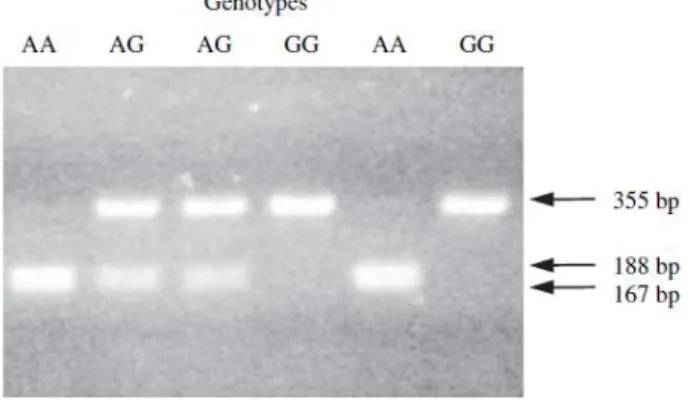
Figure 1.3 – Genotyping the g.17924A˃G polymorphism. DNA was digested with
the restriction enzyme MscI revealed the genotypes g.17924AA, 17924AG, 17924GG. Arrows indicate the size of DNA fragments (bp). These DNA fragments were size fractionated on 2% agarose gels [13]……... 9
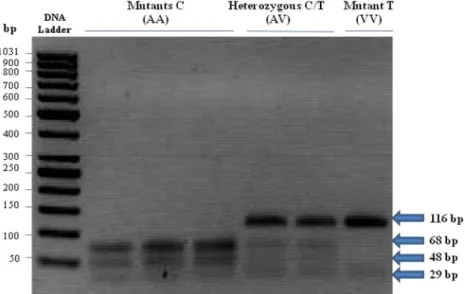
Figure 1.4 – Genotyping of SCD in the exon 5 at the g.10329 mutation site (878
bp polymorphic position). Representative result of all the samples analyzed. The arrowheads show the size of the SCD gene DNA fragment (bp). The DNA fragments were size fractioned by using 1.5% agarose gel………... 16
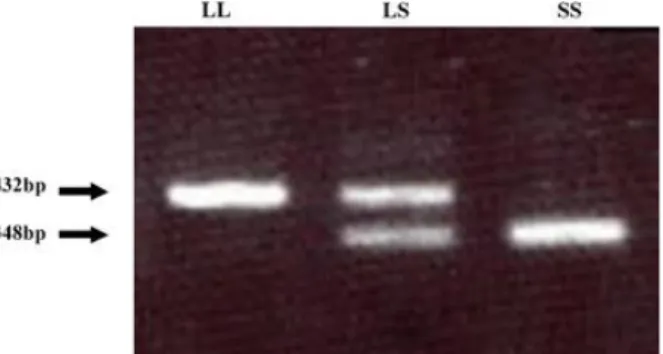
Figure 1.5 – Genotyping of SCD at the 878 bp polymorphic position.
Representative result of all the samples analyzed. Digestion of an amplified fragment, including 878 bp polymorphic position by restriction enzyme Fnu4HI, shows genotypes AA (mutant C), AV (heterogygote C/T), and VV (mutant T). The arrowheads show the size of the SCD gene DNA fragment (bp). The DNA fragments were size fractioned by using 3% agarose gel…... 16
Figure 1.6 – Genotyping of SREBP-1 indel polymorphism in intron 5.
Representative result of all the samples analyzed. The arrowheads show the size of the DNA fragment (bp). The DNA fragments were size fractioned by using 1.5% agarose gel... 18
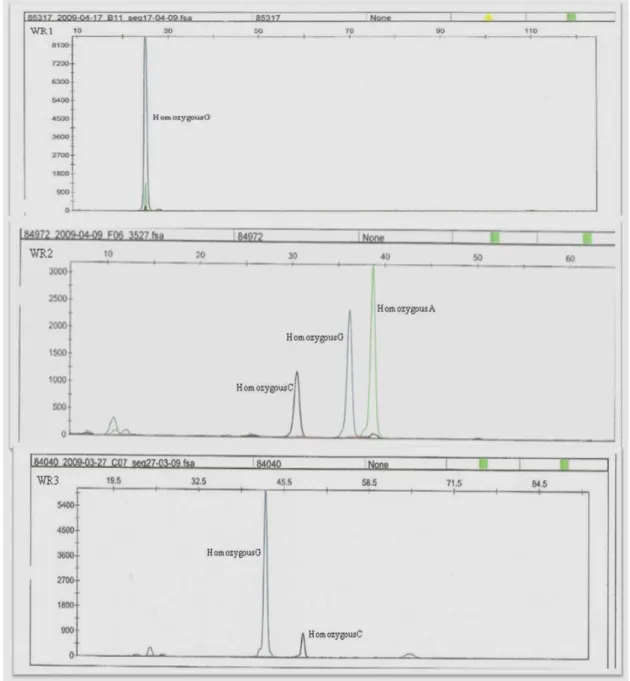
Figure 1.7 – SNapShot DNA sequencing identified several single base pair
changes of FASN gene. The mutante 1 sample represented a homozygous G at g.841 position, the mutante 2 samples presented homozygous C (g.15531C), G (g.15603G) and homozygous A (g.16021A) genotypes, and the mutant 3 presented homozygous G (g.17924G) and homozygous C (g.18663C). Sample 1 of Blanc Bleu breed: WR1 (mutant 1), WR2 (mutant 2), WR3 (mutant 3). The nucleobases are represented by different colours: Adenine – Green; Cytosine – Black; Guanine – Blue; Thymine – Red... 20
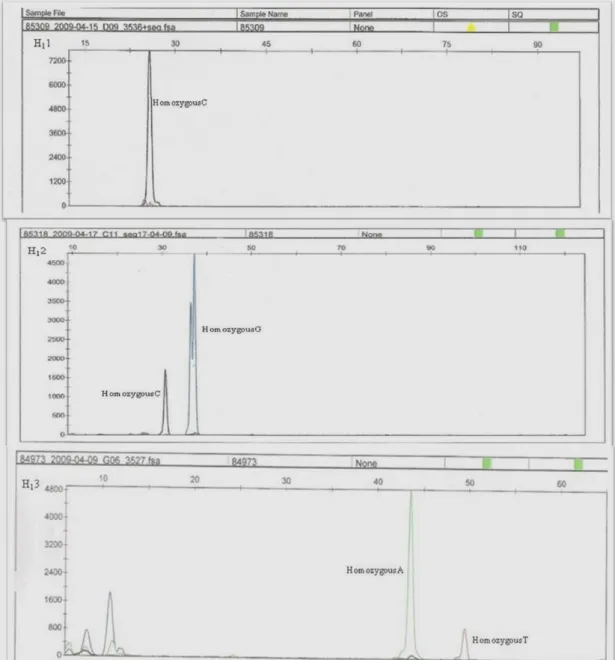
Figure 1.8 – SNapShot DNA sequencing identified several single base pair
changes of FASN gene. The mutante 1 sample represented a homozygous C genotype at g.841 position, the mutante 2 samples presented homozygous C (g.15531C), G (g.15603G) and the mutant 3 presented homozygous A (g.17924) and homozygous T (g.18663). Sample 1 of Holstein breed: H11 (mutant 1), H12 (mutant 2), H23 (mutant 3). The nucleobases are represented by different colours: Adenine – Green; Cytosine – Black; Guanine – Blue; Thymine – Red... 21
X
Figure 1.9 – SNapShot DNA sequencing identified several single base pair
changes of FASN gene. The mutante 1 sample represented a homozygous G genotype at g.841 position, the mutante 2 samples presented a homozygous C (g.15531) and G (g.15603) and homozygous A (g.16021) genotypes, and the mutant 3 presented homozygous G (g.17924) and homozygous C (g.18663) genotypes. Sample 2 of Holstein breed: H21 (mutant 1), H22 (mutant 2), H23 (mutant 3). The nucleobases are represented by different colours: Adenine – Green; Cytosine – Black; Guanine – Blue; Thymine – Red... 22
Figure 2.1 – Effect of medium pH (4.50, 5.00 and 5.75) on proliferation (A) and
rooting (B), shoot and root number (C and D, respectively), shoot and root length (E and F, respectively) of P. algarbiensis and P. almogravensis species [27]. Values are expressed as the mean ± SE (n = 3). For each species, mean values followed by different letters are significantly different at P˂0.05 and the absence of letters reveals that no differences were observed, according to Duncan’s test.………... 41
Figure 2.2 – The effect of medium pH (4.50, 5.00 and 5.75) on soluble protein
content in shoots and roots of P. algarbiensis (A) and P. almogravensis (B) [27]. Values are expressed as the mean mean ± SE (n = 5). For each species, mean values followed by different letters are significantly different at P˂0.05 and the absence of letters indicates that no significant differences were observed………... 43
Figure 2.3 – Effect of medium pH (4.50, 5.00 and 5.75) on SOD (A, B), CAT (C,
D), APX (E, F) and GPX (G, H) activities in shoots and roots of P. algarbiensis and P. almogravensis [27]. Values are expressed as the mean ± SE (n = 5). For each species, mean values followed by different letters are significantly different at P˂0.05 and the absence of letters indicates that no significant differences were observed.…..………... 44
Figure 2.4 – Aluminum accumulation in P. algarbiensis and P. almogravensis
shoots and plantlets (leaves and roots) after 7 days of culture in medium containing 400 µM Al [40]. Values are expressed as the mean ± SE (n = 3). For each species, mean values followed by different letters are significantly different at P˂0.05, according to Duncan’s test. No significant differences (P<0.05) were observed between species in the same organ………...………... 48
Figure 2.5 – Effect of low pH and Al on SOD (A, B), CAT (C, D), APX (E, F)
and GPX (G, H) activities in shoots, leaves and roots of P. algarbiensis and P.
almogravensis. Values are expressed as the mean ± SE (n = 5). For each species,
mean values followed by different letters are significantly different at P˂0.05 and the absence of letters indicates that no significant differences were observed [45, 46]…... 52
Figure 2.6 – Effect of 0 µM Al and 400 µM on MDH (A, B), Fumarase (C, D),
PEPcase (E, F), CS (G, H) and NADP-ICDH (I, J) activities in shoots and roots of
P. algarbiensis and P. almogravensis. Values are expressed as the mean ± SE (n =
XI P<0.05 and the absence of letters indicates that no significant differences were observed...…………... 56
Figure 3.1 – Palladium (II) removal ability of bacterial consortium Lag 1 for 50
mg/L Pd (II) from the medium in the presence and absence of sulphate and abiotic control with and without sulphate. Values are expressed as the mean ± Standard Deviation (n = 3)…………... 70
Figure 3.2 – Palladium (II) removal from the medium in the absence (A) and
presence (B) of sulphate at 50 mg/L and 70 mg/L of Pd (II). Values are expressed as the mean ± Standard Deviation (n = 3)………... 71
Figure 3.3 – Palladium (II) removal from the medium in the absence (A) and
presence (B) of sulphate at 50 mg/L and 100 mg/L of Pd (II). Values are expressed as the mean ± Standard Deviation (n = 3)………... 73
Figure 3.4 – Palladium (II) removal from the medium in the absence of sulphate
at 70 mg/L of Pd (II) by Lag 1 bacterial consortium (live and heat-killed cells) and by metabolic products... 74
Figure 3.5 – Palladium (II) removal from the medium in the presence of sulphate at 70 mg/L of Pd (II) by Lag 1 bacterial consortium (live and heat-killed cells) and by metabolic products... 75
Figure 3.6 – Chloramphenicol (C11H12N2O5Cl2) chemical structure... 81
Figure 3.7 – Schematic representation of the photoreactor... 84
Figure 3.8 – X-Ray pattern of the precipitate obtained using biologically produced
sulphide for the precipitation of dissolved Zn (II). The peaks shown correspond to ZnS (JCPD#01-083-1700)………...………... 86
Figure 3.9 – X-Ray diffraction pattern of ZnS in association with TiO2 (0.06 g per 50 mL) precipitates obtained using biological generated sulphide as source. The colour lines indicate the characteristic X-ray diffraction of the respective phases. The diffraction peaks shown correspond to: - Anatase, - Rutilo, - ZnS…………... 87
Figure 3.10 – X-Ray pattern of PbS precipitates obtained when Na2S.9H2O was used as the sulphide source for the precipitation of dissolved Pb (II) (chemical synthesis). The peaks shown correspond to galena (JCPD#01-077-0244)... 88
Figure 3.11 – X-Ray pattern of the precipitate obtained using biologically
produced sulphide for the precipitation of dissolved Pb (II) (biological synthesis). The peaks shown correspond to galena (JCPD#01-077-0244)……... 89
Figure 3.12 – X-Ray diffraction patterns of PbS in association with TiO2 (0.04 g, 0.06 g and 0.08 g per 50 mL, represented by A, B and C, respectively) precipitates obtained using biological generated sulphide as source. The colour lines indicate the characteristic X-ray diffraction of the respective phases. Legend of the diffraction peaks: – TiO2, – Rutilo, – Anatase,– PbS………... 91
XII
Figure 3.13 – Representation of difuse reflectance (%) versus wavelength (nm)
for the different precipitates... 93
Figure 3.14 – Representation of KM (Kubelka-Munk) vs. wavelength for the different precipitates in study... 94
Figure 3.15 – Diagram illustrating the "band gap"... 95
Figure 3.16 – Representation of UV absorption spectra of 10 mg/L chloramphenicol photolysis, in the photoreactor with irradiation time of 60 minutes. The sample collected imediatelly after the adsorption and before irradiation is denominated A0. During light exposure the samples were collected at 5, 10, 20, 30, 45 and 60 minutes denominated as A1, A2, A3, A4, A5 and A6, respectivelly... 97
Figure 3.17 – Representation of UV absorption spectra of 10 mg/L CAP photodegradation using TiO2 as photocatalyst, in the photoreactor with irradiation time of 60 minutes. The sample collected imediatelly after the adsorption and before irradiation is denominated A0. During light exposure the samples were collected at 5, 10, 20, 30, 45 and 60 minutes denominated as A1, A2, A3, A4, A5 and A6, respectivelly... 98
Figure 3.18 – Representation of UV absorption spectra of 10 mg/L CAP photodegradation using the nanocomposite ZnS with 0.06 g of TiO2 as photocatalyst, in the photoreactor with irradiation time of 60 minutes. The sample collected imediatelly after the adsorption and before irradiation is denominated A0. During light exposure the samples were collected at 5, 10, 20, 30, 45 and 60
minutes denominated as A1, A2, A3, A4, A5 and A6,
respectivelly... 99
Figure 3.19 – Representation of UV absorption spectra of 10 mg/L CAP photodegradation using PbS with 0.06 g of TiO2 as photocatalyst, in the photoreactor with irradiation time of 60 minutes. The sample collected imediatelly after the adsorption and before irradiation is denominated A0. During light exposure the samples were collected at 5, 10, 20, 30, 45 and 60 minutes denominated as A1, A2, A3, A4, A5 and A6, respectivelly... 99
Figure 3.20 – Degradation efficiency (%) of 10 mg/L solution of CAP using different nanocomposites as photocatalysts versus irradiation time at 450 W... 100
Figure 3.21 – Representation of the linear regression of the function ln(A/A0) versus time of irradiation, where A is the absorvance over time and A0 is the absorvance of the solution initial (λ = 276 nm)... 101
XIII
V. Table list
Table 1.1 – Effect on MUFA (%) content and melting point (ºC) in fat tissue
among three SCD genotypes and sire groups. Mean values with different superscripts in the same column differ significantly (P<0.001). MUFA indicates the percentage of mono-unsaturated fatty acids including C14:1, C16:1, and C18:1; n – Absolute frequency... 5
Table 1.2 – Comparison of MUFA content and melting point of intramuscular fat
among SREBP-1 and SCD genotypes [10]. Mean values with different alphabets in the same column differ significantly (P<0.05). MUFA indicates the percentage of monounsaturated fatty acids including C14:1, C16:1, and C18:1.………... 7
Table 1.3 – Comparison of MUFA content and melting point of intramuscular fat
among the combination of the SREBP-1 and SCD genotypes [11]. Mean values with different alphabets in the same column differ significantly (P<0.05)……... 8
Table 1.4 – Distribution of SCD genotypes (Mutant C (AA); heterozygote C/T
(AV); mutant T (VV)) in the 96 Holstein, 114 Simmental, 35 Blanc Bleu, 49 Pie Rouge and 36 Pie Noir cattle breeds samples considered……... 17
Table 1.5 – Distribution of SREBP-1 genotypes in the 76 Holstein, 47 Simmental,
33 Blanc Blue, 48 Pie Rouge and 36 Pie Noir cattle breeds samples considered…... 19
Table 2.1 – Changes in the pH of proliferation and rooting media after autoclaving
and after 6 weeks, with or without P. algarbiensis and P. almogravensis plantlets [27]. Values are expressed as the mean ± SE (n = 3). In each row, mean values followed by different letters are significantly different at P˂0.05, according to Duncan’s test. *Significant different between proliferation and rooting media for
each original pH (P˂0.05)………... 39
Table 2.2 – Contents of MDA in P. algarbiensis and P.almogravensis plantlets
(shoot and root) cultured in media with different pH [27]. Values are expressed as the mean ± SE (n = 5). For each species and in each column, mean values followed by different letters are significantly different at P˂0.05, according to Duncan’s test………... 42
Table 2.3. - Effect of low pH and Al on the elongation and DW of P. algarbiensis
and P. almogravensis shoots and plantlets [40]. Values are expressed as the mean ± SE (n = 15). For each species and in each column, mean values followed by different letters are significantly different at P<0.05, according to Duncan’s test... 47
Table 2.4 – Effect of low pH and Al on the Ca, P, K and Mg contents (mg.g-1
DW) of P. algarbiensis and P. almogravensis shoots and plantlets [40]. Values are expressed as the mean ± SE (n = 3). For each nutrient and in each column, mean values followed by different letters are significantly different at P<0.05, according to Duncan’s test... 50
Table 2.5 – Effect of low pH and Al on the photosynthetic pigment contents of P. algarbiensis and P. almogravensis shoots and plantlets [40]. Values are expressed
XIV as the mean ± SE (n = 5). For each species and in each column, mean values followed by different letters are significantly different at P<0.05, according to Duncan’s test... 54
Table 2.6 – Length, width, weight and water content of Plantago algarbiensis and P. almogravensis seeds [50]. Values are expressed as the mean ± SE. *: indicates
significant differences (P<0.05) between results of seeds of different species collected in the same year (2010). The absence of symbol indicates that no significant differences were observed………... 59
Table 2.7 – Effects of temperature on the final germination percentages and mean
germination time (MGT) of Plantago algarbiensis and P. almogravensis. Results obtained after 40 days of incubation under 16 h light photoperiod (light) or constant darkness [50]. Values are expressed as the mean ± SE. For each species mean values followed by different letters are significantly different at P<0.05, according to Duncan’s test. For each temperature, the significance level (S) between results from light and darkness is showed. S(1): ***Significantly different at P<0.001; *P<0.05; ns, not significant………... 59
Table 3.1 – Band gap values of metallic sulphides nanoparticles and their
XV
VI. Abbreviations
aa – Aminoacid
ACP – Acyl carrier protein AOIs – Areas of interest BA – 6-benzyladenine bp – base pairs
CAP – Chloramphenicol CAT – Catalase
Chl – Chlorophyll
Dp – diameter of the particles DW – Dry weight
EDTA – Ethylenediaminetetraacetic acid EDX – Energy-Dispersive X-ray Spectroscopy ETR – Electron transport rate
F Primer – Forward primer FA – Fatty acids
FASN – Fatty acid synthase FW – Fresh weight
GPX – Guaiacol peroxidase IAA – Indole-3-acetic acid KM – Kubelka-Munk LM – Longissimus muscle MDA – Malondialdehyde MDH – Malate dehydrogenase MGT – Mean Germination Time MPM – modified Postgate medium MS – Murashige and Skoog
MUFA – Mono-unsaturated fatty acids N – Absolute frequency
NADP-ICDH – Nicotinamide Adenine Dinucleotide Phosphate – dependent Isocitrate
Dehydrogenase
NPs – Nanoparticles
NTB – Nitroblue tetrazolium ORF - Open reading frame Pb – Lead
PbS – Lead Sulphide
PCR – Polymerase chain reaction Pd – Palladium
PEPCase – Phosphoenolpyruvate carboxylase PGMs - Platinum Group Metals
PL – Phospholipids
PPFD – Photosynthetically-active photon flux density Pt – Platinum
PUFAs – Polyunsaturated fatty acids QTL – Quantitative trait loci
R - Reflectance
R Primer – reverse primer RB – Pie Rouge
XVI
Rh – Rhodium
ROS – Reactive oxygen species RWC – Relative water content
SCD – Stearoyl coenzyme A desaturase SEM – Scanning Electron Microscopy SFA – saturated fatty acids
SNP – Single nucleotide polymorphisms SOD – Superoxide dismutase
SRB – Sulphate-reducing bacteria SRE – sterol regulatory element
SREBP-1 – Sterol regulatory element binding protein-1 TAG – Triacylglycerols
TE – Thioesterase
TEM - Transmission electron microscopy TBA – Thiobarbituric acid
TCA – Trichloroacetic acid TW – Turgid weight UTR – Untranslated region UV – Ultraviolet
WR – Blanc Bleu
XRD – X-ray powder diffraction ZB – Pie Noir
Zn – Zinc
1
VII. Technical and Scientific description
Chapter 1 - Improvement of the dietetic and nutricional qualities of
milk and milk’s by-products by selection of the genetic potential of
cattle.
1.1. Summary
The professional training in Progenus was under the direction of Dr. Robert Renaville. This work was a part of an important agro-food project, in order to obtain an improvement of dietetic and nutritional qualities of milk by selection of the genetic potential of bovine cattle, especially of the Walloon region - Belgium. This study consisted at genotyping and identification of SNPs (Single Nucleotide Polymorphisms) of interest and of major genes affecting the regulation, composition and percentage of fatty acids (FA) and of mono-unsaturated fatty acids (MUFAs) in the milk cows. Previous studies have shown that stearoyl-CoA desaturase (SCD), sterol regulatory element-binding protein 1 (SREBP-1), and fatty acid synthase (FASN) genes presented interesting correlations between their enzymatic activity and fatty acid (FA) composition and MUFAs percentages. Thus, it was performed the optimization of a method for genotyping SCD, SREBP-1 and FASN genes based on PCR.
In this study, cows of 5 breeds, Holstein, Simmental, Blanc Blue, Pie Rouge, Pie Noir, were genotyped at exon 5 of SCD, at intron 5 of SREBP-1. A SNapShot assay was performed for fast and simple detection of SNPs in the FASN gene (exons 1, 34 and exons 39, 42 in the thiosterase (TE) domain).
In Belgium, Holstein is the most important breed in terms of milk production. In this breed’s exon 5 of SCD gene, three SNP were found, however only one (position 10329) codes for a different AA codon: alanine (allele C) or valine (allele T).
Large 84 bp insertion (long type: L) and deletion (short type: S) were found in intron 5 of bovine SREBP-1 in the studied cattle. All the Holstein studied for the genotype of bovine SREBP-1 gene presented type LL thereby being homozygous L type. Holstein breed also presented g.17924GG homozygous type of FASN gene, reponsible for higher MUFA milk content.
2
Keywords: Polymerase chain reaction (PCR); Restriction Fragment Length
Polymorphism (RFLP); Stearoyl-coenzyme A desaturase (SCD); Sterol regulatory element binding protein-1 (SRBP-1); Fatty acid synthase (FASN); Single nucleotide polymorphisms (SNPs)
3
1.2. Introduction
The milk fatty acid (FA) profile is far from the optimal fat composition in regards to human health [1]. Dietary fatty acids are known to have a major influence on human health, particularly in countries whose populations are well-nourished, such as in developed countries where milk and meat are major components of dietary intake. It is generally accepted that saturated fats containing fatty acids with a chain length of 14 or 16 carbons, commonly found in beef meat and cow’s milk, are risk factors in coronary heart disease. For example, myristic acid (C14:0) is hypercholesterolemic and raises concentrations of both low-density lipoprotein and high-density lipoprotein cholesterol compared with oleic acid (C18:1). In contrast, those fatty acids with a carbon chain length of at least 18, especially unsaturated fatty acids, are considered to be beneficial to human health [2]. The FA fraction of ruminant’s milk contains several compounds of great interest for human health, such as monounsaturated FA (mainly oleic acid) and conjugated linoleic acids (CLA) [3]. The natural sources of variation, such as feeding or genetics, could be used to increase the concentrations of unsaturated fatty acids. The impact of feeding is well described. However, genetic effects on the milk FA composition begin to be extensively studied [1].
Studies aimed at finding efficient strategies to improve the nutritional quality of milk concluded that feeding supplementation is the most efficient way to modify milk FA, but a recent study suggested that the genetic improvement of the nutritional quality of milk based on FA profile may be possible [1].
For few years, some Belgian and Dutch breeders used specific feeding to increase the concentrations of unsaturated FAs in their milk, especially of omega-3 (ω-3) and CLA. Although this method is efficient, the effects are not durable. If the feeding supplementation stops, the improvement of FA composition disappears. So, animal selection using genetic variability of FAs should transmit from generation to generation this nutritional improvement. For this propose, a selection index needs to be developed [2].
The search for loci affecting FA profiles and their use in marker assisted selection programs offer an alternative to modify nutritional qualities of milk through genetic selection [3].
4
1.2.1. Stearoyl-CoA desaturase (SCD) gene
The SCD gene level expression is pointed out as one of the possible origins of FA variation in milk. This gene is expressed in several tissues and organs, principally in mammary gland and adipose tissue but also in liver, muscle, lung, brain, heart [4] and SCD mRNA expression is affected by environmental factors including diet and age. The SCD plays a key role because is the rate-limiting enzyme in the cellular biosynthesis of mono-unsaturated fatty acids (MUFAs). It is located in the endoplasmic reticulum and catalyzes the insertion of a cis double bond between carbons 9 and 10 (Δ9
-position) in a large spectrum of medium- and long-chain saturated fatty acids, with preferences for C16:0 (palmitic acid) and C18:0 (linoleic acid) [4, 5].
The SCD gene was also indicated as a primary candidate gene to change the proportion of saturated vs. unsaturated FA in milk, also increasing the conjugated linoleic FA content, which is purported to possess anticarcinogenic properties [6].
The SCD gene has been mapped in cattle on the bovine chromosome BTA26 (26q21). The complete bovine SCD mRNA, which spans 5.1 kb and codes for a protein of 355 aa, has been cloned and sequenced (GenBank accession No. AY241932). Few authors identified eight single nucleotide polymorphisms (SNPs) in various bovine breeds (Holstein, Jersey and Brown-Swiss): three SNP’s were detected on the 5th exon (A702G, C762T, and T878C) and 5 were found in the 3’ untranslated region (UTR) of the SCD gene [3, 4].
Taniguchi and colleagues [7] identified two types of SCD gene with SNPs in the ORF of SCD cDNA, in which an amino acid replacement at 878 bp (T to C) was predicted to cause substitution from valine (type V) to alanine (type A) in the SCD protein and also found the nucleotide substitutions at 702 bp (G to A), 762 bp (C to T) in open reading frame (ORF), and 1905 bp (T to C), 3143 bp (C to T), 3351 bp (A to G), 3537 bp (A to G), and 4736 bp (A to G) in 3’ untranslated region (UTR).
Some authors have classified the SCD gene into three genotypes, VV, VA, and AA genotyping the SCD gene by PCR-RFLP (Fig. 1.1) and compared fatty acid composition among them [7, 8].
5
Figure 1.1 – Genotyping of SCD at the 878 bp polymorphic position. Digestion of an
amplified fragment, including 878 bp polymorphic position by restriction enzyme Fnu4HI, shows genotypes AA (mutant C), VA (heterogygotic C/T), and VV (mutant T). The arrowheads show the size of the DNA fragment (bp). The DNA fragments were size fractioned by using 1% agarose gel. [7].
The three SNP of exon 5 are in linkage disequilibrium that result in 2 haplotypes; one of these SNP (position 10329) is the site of an amino acid replacement, substitution of valine (V) (allele T) for alanine (A) (allele C) [6, 7]. The Val (valine) variant was identified as the ancestral allele. Some authors found that the Val residue may change the enzyme catalytic activity compared with Ala (alanine) [7, 8].
They showed that, in Japanese Black cattle, allele C (type A) was more frequently associated with a higher content of MUFA in carcasses, and suggested that genotyping for this region would be a useful tool for selection of favorable beef carcasses [7] and consequently also for milk selection.
Comparison of MUFA content and melting point in fat tissue among three SCD genotypes and sire groups (Table 1.1).
Table 1.1 – Effects on MUFA (%) content and melting point (ºC) in fat tissue among
three SCD genotypes and sire groups [7].
Mean values with different superscripts in the same column differ significantly (P<0.001).
MUFA indicates the percentage of mono-unsaturated fatty acids including C14:1, C16:1, and C18:1; n – Absolute frequency
These genetic studies have demonstrated associations of SNPs in bovine SCD gene with higher MUFA content and lower melting point in longissimus muscle (LM) adipose
6 tissues and with enhanced content of oleic acid and total MUFAs in milk cows. It was verified that SCD type A gene contributed to higher MUFA percentage and lower melting point in intramuscular fat (Table 1.1) [7].
Some authors [7, 8] found that heterozygous Val/Ala (alleles C/T) animals had higher C16:1/C16:0 in intramuscular fat than did homozygous Val (alleles TT) animals. Whereas, milk of homozygous AA cows had greater content of cis-9 C18:1 and total monounsaturated fatty acids and higher C14:1/C14 ratio than did milk of VV cows [4].
1.2.2. Sterol regulatory element binding protein (SREBP-1) gene
The sterol regulatory element binding proteins (SREBPs) have three SREBP isoforms, SREBP-1a, SREBP-1c, SREBP-2, each one have different roles in lipid synthesis. In
vivo studies using transgenic and knockout mice suggested that SREBP-1c is involved
in FA synthesis and insulin induced glucose metabolism (particularly in lipogenesis), whereas SREBP-2 is relatively specific to cholesterol synthesis. The SREBP-1a isoform seems to be implicated in both pathways [9].
Thus, SREBPs belong to the original basic helix-loop-helix-leucine zipper family of transcription factors that are considered as master regulators of cholesterogenesis and lipogenesis, regulating lipid homeostasis by controlling the gene expression of a range of enzymes which are relevant to lipid and fatty acid metabolism in tissue, therefore are required for endogenous cholesterol, FA (such as SCD enzyme gene expression), triacylglycerol and phospholipid synthesis [9, 10].
The bovine SREBP-1 gene detected revealed the most similarity with human SREBP-1a sequence [10], which binds a sterol regulatory element (SRE) sequence at the upstream of SCD gene and has a transcriptional regulatory activity [9]. Hoashi and colleagues found that bovine SREBP-1 includes 3441 bp corresponding to 1146 of the deduced amino acids [10].
Figure 1.2 – Genotyping of SREBP-1 indel polymorphism in intron 5. The arrowheads
show the size of DNA fragment (bp). These DNA fragments were size fractionated using 1% agarose gel [10].
7 The PCR products of bovine SREBP-1 revealed the existence of a large 84 bp insertion (long type of 432 bp: L) and deletion (short type of 348 bp: S) in the intron 5 (Fig. 1.2), although there was no notable mutation in exon regions [10].
SREBP genotypes might affect MUFA content through regulation of SCD expression [10]. The comparison between SREBP-1 and SCD genotypes in terms of the unsaturated fatty acid content, and melting point is shown in Table 1.2.
Table 1.2 – Comparison of MUFA content and melting point of intramuscular fat
among SREBP-1 and SCD genotypes [10].
Genotype N MUFA (%) Melting point (ºC)
SREBP-1 LL 98 57.7 ± 0.3a 26.7 ± 0.4a LS 437 58.1 ± 0.2a 26.3 ± 0.2a SS 71 59.0 ± 0.3b 25.1 ± 0.4b SCD AA 143 59.3 ± 0.2a 24.8 ± 0.3a AV 418 58.4 ± 0.2b 25.9 ± 0.2b VV 45 57.1 ± 0.4c 27.4 ± 0.5c
Mean values with different alphabets in the same column differ significantly (P<0.05). MUFA indicates the percentage of monounsaturated fatty acids including C14:1, C16:1, and C18:1.
In terms of a genetic polymorphism the ANOVA revealed that the effects of both SCD and SREBP-1 genotypes were significant for the physiologic characteristics of cattle fat. In SCD mutation (Val293Ala), the genotype AA showed 2.1% higher MUFA percentage than the genotype VV. The genotype AA showed at 2.5ºC lower melting point than the genotype VV. In the SREBP-1, the genotype SS showed 1.3% higher MUFA percentage than the genotype LL. In addition, the genotype SS showed a 1.6ºC lower melting point than the genotype LL (Table 1.2) [10]. And when the genotype of bovine SREBP-1 gene was (L/S) having heterozygous L and S type, the percentage of MUFAs was higher than that in the case of genotype (L/L) having homozygous L type (Table 1.2).
The results shown in Table 1.3 represent the relation among the combination of these both genotypes, the unsaturated fatty acid content, and melting point.
8
Table 1.3 –Comparison of MUFA content and melting point of intramuscular fat in the relation among the combination of the SREBP-1 and SCD genotypes [11].
Genotype N MUFA (%) Melting point (ºC)
SREBP-1/ SCD LL/AA 24 58.5 ± 0.48 26.0 ± 0.66 LL/AV 67 58.0 ± 0.29 26.4 ± 0.39 LL/VV 7 56.3 ± 0.89 28.4 ± 1.22 LS/AA 99 59.3 ± 0.89 24.9 ± 0.32 LS/AV 309 58.2 ± 0.13 26.3 ± 0.18 LS/VV 29 57.3 ± 0.44 27.3 ± 0.60 SS/AA 20 59.2 ± 0.53 24.3 ± 0.72 SS/AV 42 59.6 ± 0.36 24.7 ± 0.50 SS/VV 9 57.2 ± 0.78 27.3 ± 1.10
Mean values with different alphabets in the same column differ significantly (P<0.05). Based on these results, it can be evaluated that, if a cattle has a combination of “S type” as SREBP-1 genotype and “A type” as SCD genotype, then the cattle will produce better quality of beef. Especially, if a cattle has three or more alleles, as a total number of a number of “S type” alleles of SREBP-1 genotype and a number of “A type” alleles of SCD genotype, then the cattle can be evaluated to produce better quality of beef, with higher unsaturated fatty acid content and lower melting point [11]. Thus, the relation among the combination of the SREBP-1 and SCD genotypes that presented higher MUFA percentage and lower melting point were LS/AA, SS/AA, and SS/AV revealing that these combinations are also the best in terms of milk quality, however the combinations did not differ significantly among them (Table 1.3).
1.2.3 – Fatty acid synthase (FASN) gene
Fatty acid synthase (FASN) is a complex homodimeric enzyme that regulates de novo biosynthesis of long-chain fatty acids in mammals. With seven active sites, FASN is a cytosolic enzyme which catalyzes all the reaction steps in the synthesis of palmitate from acetyl-Coenzyme A and malonyl-Coenzyme A in the presence of NADPH. In animals the synthesis of FASN is a regulated process which depends on diet and hormones at all stages of life, even during neonatal development and differentiation. Because FASN enzyme plays a central role in de novo lipogenesis in mammals, it is a candidate gene for fat content in milk animals [2].
9 Roy and colleagues [12] reported the localization of the bovine FASN gene on bovine (BTA) chromosome 19q22 where several quantitative trait loci (QTL) affecting milk-fat content and related traits have been described by fluorescence in situ hybridization and somatic cell hybrid analysis [12].
Zhang and colleagues [13] hypothesized that variation in the thioesterase (TE) domain of FASN gene among the individuals would be a candidate for heritable differences in fatty acid composition and might be used to improve the healthfulness of the fatty acid composition of beef while maintaining other positive physical and chemical attributes of the product [13]. The TE domain within the FASN complex is responsible for the termination of fatty acid synthesis and release of newly synthesized saturated fatty acids (SFA), mainly C16:0, by hydrolyzing the acyl-S-phosphopantetheine thioester, which is bound to the proceding acyl carrier protein (ACP) domain. Both C14acyl-ACP and C16acyl-ACP are substrates for TE. The TE domain of FASN, therefore, plays an essential role in the determination of the product chain length of FASN [13].
The TE domain is located at 3’-end of FASN and is encoded within four exons (exons 39-42).
Figure 1.3 – Genotyping the g.17924A˃G polymorphism. The DNA digested with the
restriction enzyme MscI revealed the genotypes g.17924AA, 17924AG, 17924GG. Arrows indicate the size of DNA fragments (bp). These DNA fragments were size fractionated on 2% agarose gels [13].
Three nucleotide substitutions were identified in this domain, which were AF285607: g.17924A>G, g.18663C>T and g.18727C>T. Polymorphism g.17924A>G was predicted to result in an amino acid replacement from threonine (ACC) to alanine (GCC) in FASN protein (Fig. 1.3) The other two SNPs, g.18663C>T and g.18727C>T, are silent mutations [13]. Among the three SNPs identified, the g.17924A>G and g.18663C>T SNPs were significantly associated with the concentrations of several fatty acids in phospholipids (PL), triacylglycerols (TAG) and total lipids. The percentages of
10 oleic acid (C18:1), docosapentaenoic acid (C20:5) and total MUFA were greater in Angus cattle with the g.17924GG genotype than those with the g.17924AA genotype [13]. The mutations g.15603G>A and g.15531C>A are directly associated with the fatty acid composition of milk and the g.16021G allele in exon 34 (resulting in an alanine) is associated with increased milk-fat content [12]. The G>C substitution identified in the bovine FASN gene (g.841 G>C) changes the putative Sp1 transcription factor-binding site in the untranslated exon 1; that is because, whereas allele G contains a Sp1-binding site, allele C does not. RNA secondary structure prediction within the 5’-UTR predicts two different structures for these alleles [12].
It was evidenced that SNPs in the bovine FASN gene are associated with variation in the fatty acid composition of adipose fat and milk fat [2].
Thus, the authors concluded that functionally advantageous SNPs of the FASN gene may be used as DNA markers to select breeding stock with healthier fatty acid content of Longissimus muscle (LM) [13] and milk.
11
1.3. Objectives
The main objective of this work was the identification of genetic mutations (polymorphisms) in the most important genes that affect fatty acid production and composition of bovine milk, in order to do a selection of cattle using the genetic variability of fatty acids that should be transmitted from generation to generation, thus leading to a nutritional improvement. Therefore, the search for loci affecting FA profiles and their use in marker selection programs offer an alternative to modify nutritional qualities of milk through genetic selection. To achieve this aim it was performed the genotyping of SCD, SREBP-1, and FASN genes in order to establish a comparison of the genetic analysis of cattle with the fatty acid composition of milk.
12
1.4. Material and methods
1.4.1. Solutions and buffers
Extraction Solutions:
NE: 10 mM NaCl, 10 mM EDTA, pH 7.0 (0.29 g NaCl, 1.86 g EDTA, H2O in 500 ml, pH 7.0) was used to lyse red blood cells and to remove hemoglobin.
Solution A: 200 mM NaOH was used to lyse white cells
Solution B: 200 mM HCl + 100 mM Tris-HCl, pH 8.5 (10 ml 1M Tris-HCl, pH 8.5; 1.67 ml HCl; H2O in 100 ml)
Electrophoresis buffer:
TAE 0.5x: (Tris-Acetate-EDTA): Tris base 20mM, Acetic Acid 20mM and EDTA 0.5mM
a) 1.5% agarose gel
1.5 g agarose (Eurogentec “Molecular Biology Grade”)
100 mL of TAE 0.5X buffer
8 μl of ethidium bromide (GeneChoice)
b) 3% agarose gel
3 g agarose (Eurogentec “Molecular Biology Grade”)
100 mL of TAE 0.5X buffer
8 μl of ethidium bromide (GeneChoice)
1.4.2. Methods
1.4.2.1. Fast DNA extraction from whole bovine blood
Protocol, used in case of need, to extract genomic DNA from blood samples instead of the already given genomic DNA by l’Unité de Zootechnie of the Walloon Region. It was added 200 µl of blood in an eppendorf, in order to wash the blood three times with NE solution. The solution was centrifuged 10 seconds at 14000 g, the supernatant was discarded. After, the NE was added to the pellet and the previous steps were repeated twice. After the wash step it was added 50 µl of solution A to the pellet, the
13 solution was mixed and placed at 97 °C for 15 min. Finally, 50 µl de solution B was added. The solution was mixed and then it was ready used for PCR.
1.4.2.2. PCR-RFLP – SCD gene
A polimerase chain reaction - restriction fragment length polymorphism (PCR-RFLP) was realized in order to detect nucleotide substitutions in the exon 5 of the bovine SCD gene. A PCR-RFLP was performed at 878 bp mutation site counted from the translation initiation site, using the following primer set (GenBank accession, nº AY241932): (Forward - F, sense primer); (Reverse - R, antisense primer)
F - 5’- ATGTATGGATACCGCCCTTATGAC - 3’;
R - 5’- TGCTGCTTAGGGTATTAGGTTACGTGCCAGAAA - 3’
The PCR amplification was performed with 1 μl of genomic DNA (the genomic DNA was provided by l’Unité de Zootechnie of the Walloon Region), 2.5 μl of 10X PCR buffer (GE Healthcare, Illustra), 200 μM final concentration of each nucleotide (dNTPs from GE Healthcare), 10 pmol of each primer (Sigma), 1 unit of Taq polymerase (GE Healthcare, Illustra,), and double-distilled water to a final volume of 25 μl.
Amplifications were performed with thermal cycler, PTC-200 DNA Engine (MJ Research, Inc.), with the following thermo-cycling protocol: initial denaturation at 94ºC for 2 min, followed by 30 cycles of 94ºC for 30 s, 60ºC for 30 s, and 72ºC for 1 min, with final extension step, 72ºC for 7 min.
The 1.5 % agarose gel was charged with 5 μl of PCR products mixed with 2 μl of 6X Orange DNA Loading Dye (Fermentas). O’GeneRuler 50 bp DNA Ladder (Fermentas) was used to size and estimate the approximate quantification of the DNA fragments on agarose gel. The migration was performed at 100 V for 25 min. The obtained bands of DNA were visualised using the program QuantityOne (BioRad).
The obtained fragment was digestible with Fnu4H1 enzyme.
The digestion with the restriction enzyme was performed with 20 μl of PCR product mixed with 1U of Fnu4H1 (LabLife) and incubated at 37ºC for 2 h, the inactivation of enzyme was at 65ºC for 20 min.
The 3 % agarose gel was charged with 5 μl of PCR products mixed with 2 μl of 6X Orange DNA Loading Dye (Fermentas). O’GeneRuler 50 bp DNA Ladder (Fermentas) was used to size and estimate the approximate quantification of the DNA fragments on agarose gel. The migration was performed at 100 V for 45 min. The obtained bands of DNA were visualised using the program QuantityOne (BioRad).
14
1.4.2.3. PCR – SREBP-1 gene
The primers set used for PCR amplification were as follows: (F, sense primer); (R, antisense primer) – (GenBank accessionnº AB355703)
F-5’-CCACAACGCCATCGCCATCGAGAAACGCTAC-3’; R-5’-GGCCTTCCCTGACCTCCCAACTTAG-3’.
The PCR amplification was performed with 1 μl of genomic DNA (provided by l’Unité de Zootechnie of the Walloon Region), 2.5 μl of 10X PCR buffer (GE Healthcare), 200 μM final concentration of each nucleotide (dNTPs from GE Healthcare), 10 pmol of each primer (Sigma), 1 unit of Taq polymerase (GE Healthcare, Illustra), and double-distilled water to a final volume of 25 μl.
Amplifications were performed with thermal cycler, PTC-200 DNA Engine (MJ Research, Inc.), with the following thermo-cycling protocol: initial denaturation at 94ºC for 2 min, followed by 30 cycles of 94ºC for 30 s, 60ºC for 30 s, and 72ºC for 1 min, with final extension step, 72ºC for 7 min.
The 1.5 % agarose gel was charged with 5 μl of PCR products mixed with 2 μl of 6X Orange DNA Loading Dye (Fermentas). O’GeneRuler 50 bp DNA Ladder (Fermentas) was used to size and estimate the approximate quantification of the DNA fragments on agarose gel. The migration was performed at 100 V for 30 min. The bands of DNA were visualized using QuantityOne (BioRad) software.
1.4.2.4. PCR and SNapShot assay – FASN gene
Genetic analyses of the FASN polymorphisms were made by PCR method. On the basis of the FASN gene sequence (GenBank acession Nº AF285607) the following primers were designed:
Mutant 1 (SNAP 1 - g.841G→C - exon 1) - F-5’-CAGAGTGACCCAAGTACGC-3’;
R-5’-CGGAAGTTGCGAGTCGGGAA-3’.
Mutant 2 (SNAP 2 - g.15531C→A); (SNAP 3 - g.15603G→A); (SNAP 4 -
g.16021A→G - exon 34);
F-5’-GCTGAAGGCGGGCATCCGGA-3’; R-5’-GGCCGAGGCAGGTGCTAA-3’.
Mutant 3 (SNAP 5 - g.17924A→G - exon 39); (SNAP 6 - g.18663C→T - exon 42);
F-5’-AGAGCTGACGGACTCCACA-3’; R-5’-CTACCTACCACGGCAACGTG-3’.
15 PCR amplifications were performed in 25 μl volume of reaction mixture containing: 1 μl of genomic DNA, 10 picomoles of each primer (Sigma), 1 unit of Taq DNA Polymerase (GE Healthcare), 2.5 μl of 10X PCR buffer (GE Healthcare), 200 μM final concentration of each nucleotide (GE Healthcare). Amplifications were performed with thermal cycler, PTC-200 DNA Engine (MJ Research, Inc.) with the following protocol: 94ºC for 2 min; followed by 35 cycles of 94 ºC for 30 s, 60 ºC for 45 s and 72ºC for 60 s; with a final extension step at 72ºC for 7 min.
The PCR product was purified by SNaPshot (High Pure PCR Product Purification kit, 1732668, Roche) to remove dNTPs and primers.
The primers used for SNapshot PCR amplification were as follows (GenBank accession Nº AF285607):
Mutant 1 SNAP 1 - 5’-CCTCAGCCGTTCGCACAGCC-3’ Mutant 2 SNAP 2 - 5’-AAACACATCGGCAAAGTGGT-3’ Mutant 2 SNAP 3 - 5’-GCAGCAGTGCGTGAACAGGG-3’ Mutant 2 SNAP 4 - 5’-CCAGCGACGTCAGC-3’
Mutant 3 SNAP 5 - 5’-CCGTGTTCCACAGCCTGGCC-3’ Mutant 3 SNAP 6 - 5’-TTTGCTGCGCGTTCCTTCTA-3’
The SNapShot reaction mix it was performed, using a SNaPshot® Multiplex Kit (Applied Biosystems), thus for each mutant a reaction mixture consisted of 4 μl of double-distilled water, 16 μl of SNP ready and 4 μl of primer mixture, SNAP 1 primer for mutant 1, SNAP 2, 3, 4 primers mix for mutant 2 and SNAP 5, 6 primers mix for mutant 3 and after 6 μl of this reaction mix was joined together with 4 μl of purified PCR product of the three mutants samples.
The amplification was performed using a thermo-cycling protocol with an initial denaturation at 94ºC for 2 min, followed by 35 cycles of 94ºC for 30 s, 60ºC for 45 s, and 72ºC for 1 min, with final extension step, 72ºC for 7 min (SNAP program), to stop the reaction was added 1 μl of alkaline phosphatase and CIP program. The sequence was verified by GeneMapper 4.0 (Applied Biosystems).
16
1.5. Results
1.5.1. PCR-RFLP – SCD gene
In this work bovine SCD gene of Holstein, Simmental, Blanc Bleu (WR), Pie Rouge (RB) and Pie Noir (ZB) breeds was genotyped at exon 5 by PCR-RFLP (Fig. 1.4 and 1.5).
Figure 1.4 – Genotyping of SCD in the exon 5 at the g.10329 mutation site (878 bp
polymorphic position). Representative result of all the samples analyzed. The arrowheads show the size of the SCD gene DNA fragment (bp). The DNA fragments were size fractioned by using 1.5% agarose gel.
The PCR revealed the expected 145 bp fragment comprising exon 5 of bovine SCD gene which was amplified at the g.10329 mutation site (Fig. 1.4).
Figure 1.5 – Genotyping of SCD at the 878 bp polymorphic position. Representative
result of all the samples analyzed. Digestion of an amplified fragment, including 878 bp polymorphic position by restriction enzyme Fnu4HI, shows genotypes AA (mutant C), AV (heterogygote C/T), and VV (mutant T). The arrowheads show the size of the SCD gene DNA fragment (bp). The DNA fragments were size fractioned by using 3% agarose gel.
17 The studied breeds were classified into three genotypes, VV, VA, and AA (Fig 1.5 and Table 1.3), in order to compare milk’s fatty acids composition among the several breeds according to the bibliography.
According to some authors [10, 11] the SCD type A gene contributed to higher MUFA percentage and lower melting point in intramuscular fat.
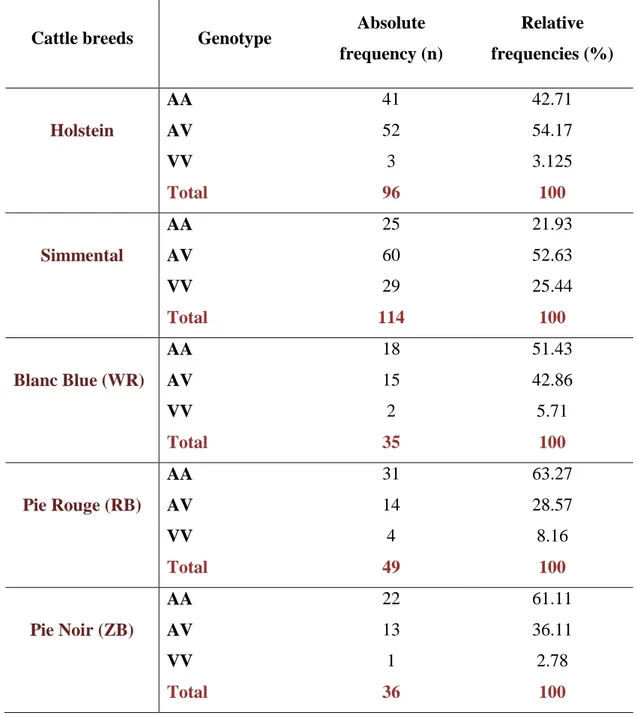
Table 1.4 – Distribution of SCD genotypes (Mutant C (AA); heterozygote C/T (AV);
mutant T (VV)) in the 96 Holstein, 114 Simmental, 35 Blanc Bleu, 49 Pie Rouge and 36 Pie Noir cattle breeds samples considered.
Cattle breeds Genotype Absolute frequency (n) Relative frequencies (%) Holstein AA AV 41 52 42.71 54.17 VV Total 3 96 3.125 100 Simmental AA AV 25 60 21.93 52.63 VV Total 29 114 25.44 100 Blanc Blue (WR) AA AV 18 15 51.43 42.86 VV Total 2 35 5.71 100 Pie Rouge (RB) AA AV 31 14 63.27 28.57 VV Total 4 49 8.16 100 Pie Noir (ZB) AA AV 22 13 61.11 36.11 VV Total 1 36 2.78 100
The SCD polymorphisms have been found in Holstein, Simmental, Blanc Blue, Pie Rouge and Pie Noir cattle breeds (Fig. 1.5 and Table 1.4).
18
1.5.2. PCR – SREBP-1 gene
To survey polymorphisms it was performed a PCR to amplify the 5 intron of bovine SREBP-1. As Taniguchi and colleagues [7], in this work it was observed a length polymorphism in the amplified products of intron 5. To estimate the gene frequencies of the 84-bp deletion (short type: S) and insertion (long type: L), the genotyping of 76 Holstein, 47 Simmental, 33 Blanc Bleu (WR), 48 Pie Rouge (RB), and 36 Pie Noir (ZB) breeds was performed (Fig. 1.6 and Table 1.5).
Figure 1.6 – Genotyping of SREBP-1 indel polymorphism in intron 5. Representative
result of all the samples analyzed. The arrowheads show the size of the DNA fragment (bp). The DNA fragments were size fractioned by using 1.5% agarose gel.
The different lengths of PCR products were detected as S (348 bp) or L (432 bp) types (Figure 1.6).
The distribution of SREBP-1 genotypes in the 76 Holstein, 47 Simmental, 33 Blanc Blue, 48 Pie Rouge and 36 Pie Noir cattle breeds samples was analyzed (Table 1.5).
![Table 1.1 – Effects on MUFA (%) content and melting point (ºC) in fat tissue among three SCD genotypes and sire groups [7]](https://thumb-eu.123doks.com/thumbv2/123dok_br/18867582.930915/25.892.258.654.121.320/table-effects-mufa-content-melting-tissue-genotypes-groups.webp)
![Table 1.2 – Comparison of MUFA content and melting point of intramuscular fat among SREBP-1 and SCD genotypes [10]](https://thumb-eu.123doks.com/thumbv2/123dok_br/18867582.930915/27.892.128.767.353.632/table-comparison-mufa-content-melting-intramuscular-srebp-genotypes.webp)

![Table 2.2. Contents of MDA in P. algarbiensis and P.almogravensis plantlets (shoot and root) cultured in media with different pH [27]](https://thumb-eu.123doks.com/thumbv2/123dok_br/18867582.930915/62.892.170.725.402.641/table-contents-algarbiensis-almogravensis-plantlets-shoot-cultured-different.webp)
