Universidade do Minho
Escola de Economia e Gestão
César Henrique Fernandes Sobrinho
July 2017
The Performance of Brazilian Small Cap
Equity Mutual Funds
César Henrique Fernandes Sobrinho
The P
er
formance of Brazilian Small Cap Equity Mutual F
unds
César Henrique Fernandes Sobrinho
July 2017
The Performance of Brazilian Small Cap
Equity Mutual Funds
Supervisor:
Ph.D. Prof. Maria do Céu Cortez
Master in Finance
Universidade do Minho
Escola de Economia e Gestão
ii
DECLARAÇÃO
Nome: César Henrique Fernandes Sobrinho
Endereço eletrónico: [email protected] Telefone: 910829706
Número do Bilhete de Identidade: Título de Residência 63671x9x0
Título dissertação : The Performance of Brazilian Small Cap Equity Mutual Funds Orientador : Ph.D. Prof. Maria do Céu Cortez
Ano de conclusão: 2017
Designação do Mestrado : Mestrado em Finanças
É AUTORIZADA A REPRODUÇÃO INTEGRAL DESTA DISSERTAÇÃO APENAS PARA EFEITOS DE INVESTIGAÇÃO, MEDIANTE DECLARAÇÃO ESCRITA DO INTERESSADO, QUE A TAL SE COMPROMETE;
Universidade do Minho, 31/07/2017.
iii
Acknowledgements
I would like to say thank you to my supervisor PhD. Maria do Céu Cortez for all the support, recommendation, patience and guidance during the process of the study. Without her help, the development of this dissertation would not be possible.
It is important to say thank you to my family (Júlio, Magna, Felipe e Naiara) for supporting me throughout my decision of living in Portugal for the Master in Finance program, and for their help to face all the obstacles during this journey by always motivating me to achieve my goals.
At least, but not less important thank you to my special friends Bruna Constâncio, Raquel Filócre, Fernanda Peres, Nathália Silva, Tiago Lopes, Frederico Balinhas and Vithor Coelho for understanding how much this program meant to me and by supporting me during my absence.
v
The Performance of Brazilian Small Cap Equity Mutual Funds
Abstract
The main objective of this dissertation is to evaluate the performance of Brazilian small cap equity mutual funds. The study includes a sample of 29 funds for the Brazilian market over the period of December 2000 until January 2017. These funds are evaluated using unconditional and conditional models of performance evaluation. The results show that small cap fund performance is sensitive to the use of a general or a style index. Furthermore, there is evidence that small cap funds have some ability to outperform the general benchmark. However, small cap fund performance tends to be lower when evaluated against a style index. When distinguishing between periods of expansions and recessions, the results show that fund performance is neutral in expansions and does not change in recessions when using the style index. In the case of the general index, funds outperform in expansions but performance decreases significantly in recessions.
vii
O desempenho de fundos de investimento Brasileiros de ações de pequena capitalização
Resumo
O objetivo principal desta dissertação é avaliar o desempenho dos fundos de investimentos brasileiros em ações de pequena capitalização. O estudo contempla uma amostra de 29 fundos do mercado brasileiro, correspondentes ao período de Dezembro de 2000 a Janeiro de 2017. Os fundos são avaliados com base em modelos não condicionais e condicionais de avaliação de desempenho. Os resultados mostram que o desempenho dos fundos de pequena capitalização é sensível ao uso do indíce geral ou de estilo. Para, além disso, os resultados evidenciam que os fundos de pequena capitalização possuem alguma capacidade de superar o indíce geral. No entanto, o desempenho dos fundos de pequena capitalização tende a ser menor quando os mesmos são avaliados relativamente a um indíce de estilo. Quando distinguidos os períodos de expansão e recessão, os resultados mostram que o desempenho é neutro em períodos de expansão e não se altera em períodos de recessão quando usado o índice de estilo. No caso do índice geral, os fundos superam o desempenho no período de expansão, mas o desempenho decresce significativamente em períodos de recessão.
ix
TABLE OF CONTENTS
List of tables……….……….….x
List of appendices………x
1. Introduction……….11
2. Context and evolution of the Brazilian Financial System……….13
2.1 The creation of National Financial System………13
2.2 The lost decade…..……….14
2.3 The Brazilian mutual fund market………..16
3. Literature Review……….19 4. Methodology………..22 5. Data description………25 6. Empirical Results………..28 6.1 Unconditional model………..28 6.2 Conditional model……….32 7. Conclusion……….37 References……….39 Appendices………..………....……….43
x List of tables
Table 1- The structure of equity class level according to ANBIMA………..………17
Table 2- Summary statistics ……..……….26
Table 3- Business cycles for Brazil – Periods of expansion and recession ………..…………27
Table 4- Jensen’s alpha (1968)………..……….28
Table 5 - Alpha from the three-factor model of Fama and French (1993)……….….30
Table 6- The conditional model of Christopherson, Ferson and Glassman (1998) in a multi-factor context………..……..….32
Table 7- Three-factor model of Fama and French with a dummy variable …………..……34
List of appendices Appendix 1- Brazilian Small cap funds………..43
Appendix 2- Individual results: Jensen’s alpha (MSCI Small cap index)………..……….44
Appendix 3- Individual results: Jensen’s alpha (IBOVESPA index………45
Appendix 4- Individual results: three-factor model (MSCI small cap index)………..46
Appendix 5- Individual results: three-factor model (IBOVESPA INDEX)……….47
Appendix 6- Individual results: Conditional model of Christopherson, Ferson and Glassman (1998) (MSCI Small cap index)……….………..49
Appendix 7- Individual results: Conditional model of Christopherson, Ferson and Glassman (1998) (IBOVESPA index)………52
Appendix 8- Individual results: three-factor model with dummy (MSCI small cap index)………55
Appendix 9- Individual results: three-factor model with dummy (IBOVESPA index)………57
11
1 -
IntroductionInvestments in the emerging markets have increased in large scale in the last decades and countries that were not considered before as attractive economies have become more popular in the investment market. Attractive high growth rates, growth economic perspectives, improvement of financial regulations and financial market literacy, higher global penetration and easiness of doing business made the emerging markets an alternative to investors, aside from the developed markets (Lemeshko and Rejnuš, 2015). Yet, most of the studies that analyze the performance of mutual funds are conducted in developed markets. The purpose of this dissertation is to evaluate the performance of mutual funds in an emerging market, precisely in Brazil. In particular, we will focus on the small cap segment of the industry. Investors may wish to select small-cap funds in their asset allocation decisions, because the risk-exposures will correspond those of a set of small companies and, additionally, they may create a diversified portfolio of small stocks that completes their overall asset allocation (Cao, Iliev and Velthuis, (2017).
Despite the considerable growth of the Brazilian mutual fund industry (Varga and Wengert, 2010), there are few studies on the performance of Brazilian mutual funds. Laes and Silva (2014), Leusin and Brito (2008) and Gomes and Cresto (2010) evaluate the performance of Brazilian equity mutual funds. However, to the best of our knowledge, there are no studies that evaluate the performance of these funds by means of more robust conditional models that consider time-varying risk and performance. Furthermore, we are not aware of any study focusing directly on the performance of Brazilian small cap equity funds. The analysis of this type of funds is of interesting considering several studies on other markets that claim that these funds can outperform the market (e.g., Otten and Reijnders, 2012; Otten and Bams, 2002; and Agyei-Ampomah, Clare, Mason and Thomas 2015).
In this context, this dissertation aims to contribute to the existing literature by evaluating the performance of Brazilian equity small cap mutual funds, using the conditional model of Christopherson, Ferson and Glassman (1998), that includes public
12
information variables that proxy for the state of the economy. In addition, this dissertation aims to compare funds’ performance during periods of expansions and recessions in an attempt to determine how funds perform in different market states. This issue has not yet been explored for Brazilian mutual funds.
This dissertation is structured as follows: Chapter two provides an overview of the context and evolution of the Brazilian financial system and the mutual fund market. Chapter three discusses the literature on the performance of mutual funds. Chapter four presents the models used to evaluate fund performance, namely unconditional and conditional models. Chapter five describes the data used in this dissertation. Chapter six presents and analyzes the empirical results. Finally, chapter seven presents the main conclusions of the study, as well as its limitations and suggestions for future research.
13
2: Context and evolution of the Brazilian Financial System
2.1 The creation of National Financial System
The current Brazilian financial system is based on law 4.595, dated December 31, 1964, that created the Conselho Monetário Nacional (CMN, National Monetary Council) and the Brazilian Central Bank (BCB). The National Monetary Council (CMN) is the supreme entity of the National Financial System and has the responsibility of formulating the currency and credit policy, aiming to the stability of the currency and the economic and social development of the country.1
Based on the law 6.385, dated December 02, 1976, the Comissão de Valores
Mobiliários (CVM) was established. The CVM regulates capital markets and issues its
decisions using what it calls instrução. It can also intervene in financial market transactions to enforce regulation (Vargas and Wengert, 2010).
The National Financial System is divided into two major subsystems: the normative that is formed by the regulatory institutions that will regulate and supervise the National Financial System, and the intermediation that is formed by financial institutions and non-banking financial institutions and others. The main financial companies in Brazil are organized into conglomerates that have national distribution from banks to asset management companies. The banking system is very concentrated with enormous participation of government banks as Banco do Brasil, Caixa Econômica
Federal-CEF, Banco Nacional de Desenvolvimento Econômico e Social-BNDES and Nossa Caixa) (Vargas and Wengert, 2010).
1
14
2.2 The lost decade
According to IPEA (Instituto de Pesquisa Econômica Aplicada) the 1980s, in Latin America, are known as a "lost decade" for the economy. GDP growth rates, inflation, industrial production, purchasing power of wages, employment level, balance of payments and other indicators, during this period, were mediocre. In Brazil, this slowdown represented a dramatic drop in the historical growth averages of the previous fifty years. The arrival of the 1980s signaled the end of time for world capitalism and an impoverishment of development projects in peripheral countries. In advanced economies, the steady growth observed between 1945 and 1975 had declined.
In Brazil, the crisis would lead the last government of the dictatorship, led by General João Figueiredo (1979-85), to take drastic measures. The initial objective was to prevent an appreciation of the national currency in previous years, to encourage exports and to cope with the increase in the current account deficit. Thus, the Cruzeiro was abruptly devalued by 30% at the end of 1979. This measure accentuated the economic slowdown, the inflationary lack of control and the disarray in the public accounts. In 1980, inflation hit a symbolic mark of 100% a year. Even with a rise in imported prices, or the balance of payments, there were huge deficits. In 1981, the country entered a recession that would last until the end of 1982 (Marangoni, 2012). Several attempts to overturn an inflationary escalation were made until early 1989 through the Cruzado II, Bresser and Plano Verão. All failed to accelerate a decade's price to a house of 80% a month in a hyperinflationary frame (Marangoni, 2012). According to IPEA (Instituto de Pesquisa Econômica Aplicada) until 1994, the Brazilian economy had some specific characteristics, mainly based on a chronic and marked inflationary process, coexisting with widespread indexation. In this context, any anti-inflationary policies were invalidated.
Since the second half of 1994, with the implementation of the Real Plan, the process of reordering of the Brazilian economy was accentuated. Measures were adopted to enable the stabilization and restructuring of the economy, such as greater openness to foreign trade, changes in industrial policy aimed at more competitive
15
insertion of products in international markets and reduction of subsidies to various productive sectors. Reforms in the country's constitutional order, especially in the economic order and in the structure and functions of the public sector, with a redefinition of the philosophy of its expenditures, also became necessary. These initiatives, among others, aimed at making the monetary stabilization process viable. Despite the importance of the Plano Real, this regime was not enough to solve the serious problems faced by Brazil in the 1980s and early 1990s (Marangoni, 2012). The Monetary Policy Committee (Copom) was created on June 20, 1996, with the purpose of establishing the monetary policy guidelines and setting the interest rates. The creation of the Committee sought to provide greater transparency and appropriate procedures to the decision-making process, as the Federal Open Market Committee (FOMC) of the United States central bank and the Central Bank Council of the central bank of Germany.2
Since 1996, the Copom Regulation has been updated with regard to its purpose, the frequency of meetings, the composition and the attributions and competencies of its members. These amendments were intended not only to improve the decision-making process within the Committee, but also to reflect changes in the monetary regime.3
It is worth to notice the adoption, by Decree 3,088, on June 21, 1999, of the inflation targeting system as a monetary policy guideline. Since then, Copom's decisions have been aimed at meeting the inflation targets defined by the National Monetary Council. According to the same Decree, if the targets are not met, the President of the Central Bank should issue, in an Open Letter to the Minister of Finance, the reasons for the noncompliance, as well as the measures and deadline for the return of the inflation rate to the limits established.4
Formally, Copom's objectives are to "implement monetary policy, set the Selic Rate target and its possible bias, and analyze the Inflation Report". The interest rate set at the Copom meeting is the target for the Selic Rate (average rate of daily
2 (http://www.bcb.gov.br/htms/copom/a-hist.asp) 3 (http://www.bcb.gov.br/htms/copom/a-hist.asp) 4 (http://www.bcb.gov.br/htms/copom/a-hist.asp)
16
financings, backed by federal securities, calculated in the Special System for Settlement and Custody), which is in force for the entire period between ordinary meetings of the Copom Committee. If this is the case, the Copom can also define the bias, which is the prerogative given to the president of the Central Bank to change, in the direction of the bias, the target for the Selic Rate at any time between ordinary meetings. 5
2.3The Brazilian Mutual Fund Market
The first mutual fund, Fundo Crescinco, was launched in Brazil in 1957, and until 1970 only 11 funds existed. In 1959, the Ministry of Finance issued the first official document to address mutual funds, nº 309. In 1970, with the purpose of protecting investors, the Banco Central do Brasil issued Resolution nº 145, which was the first government regulation to establish broad guidelines for mutual funds. To be considered an equity fund, regulation requires that a minimum of 60% of the assets under management be invested in equities. This legal framework established several rules that remain in place to date, such as requirements to disclose managers’ qualifications, to create bylaws for the fund, to disclose the portfolio holdings, and to limit the amount invested in assets issued by any company linked to the fund manager or the fund management company (Varga and Wengert, 2010).
In 1967, a fund named Fundo 157 was created to stimulate the investments in equities through a reduction in income taxes. In 1985 a Resolution turned the Fundo
157 into equity mutual funds. During the period of 1984 to 1994 other types of funds
were created and older funds were transformed in attempt to follow the state of the economy. In this period, several resolutions were launched in order to regulate the changes in the financial market. These resolutions also transferred the supervision and regulation of equity funds from Banco Central do Brasil to Comissão de Valores
Mobiliários (Varga and Wengert, 2010).
5
17
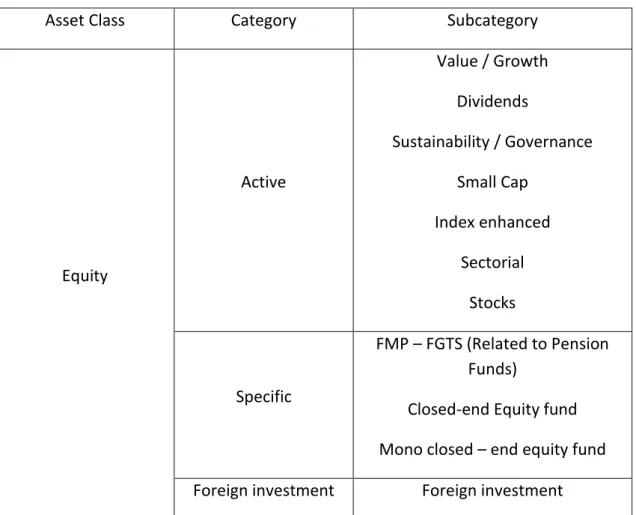
Equity mutual funds in Brazil currently represent around 4,8 % of the mutual fund market, while fixed income funds predominate (Anbima)6. According to ANBIMA, the equity mutual fund market is structured into three levels. The first level corresponds to the asset class and it is segmented as fixed income, equity, multimarket and Exchange Traded Funds. The second level corresponds to active or passive management and classifies funds as indexed, active and foreign investment funds. The third level classifies the funds according to its strategy, e.g. dynamic, sectorial and sovereign funds. The structure of the equity funds is shown in the following table. 7
Table 1. The structure of equity class level according to ANBIMA
Asset Class Category Subcategory
Equity Active Value / Growth Dividends Sustainability / Governance Small Cap Index enhanced Sectorial Stocks Specific FMP – FGTS (Related to Pension Funds)
Closed-end Equity fund Mono closed – end equity fund
Foreign investment Foreign investment
Source:http://www.anbima.com.br/data/files/B4/B2/98/EF/642085106351AF7569A80AC2/Cartilha_da_Nova_Classificacao_de_F undos_1_.pdf.
6
Anbima - Associação Brasileira das Entidades e Mercados Financeiro e de Capitais (http:// portal.anbima.com.br/Pages/home.aspx).
7
http://www.anbima.com.br/data/files/B4/B2/98/EF/642085106351AF7569A80AC2/Cartilha_da_Nova_Classificacao_de_Fundos_ 1_.pdf
18
In this study we will focus in the equity mutual funds category and small cap subcategory. According to ANBIMA, to be considered an equity mutual fund at least 67% of the portfolio must be invested in stocks. As mentioned in Table 1, this category is further divided into different categories and subcategories. For funds to be included in the small cap subcategory, the portfolio must have at least 85% of the shares invested in companies that are not included in the 25 most traded companies from índice Brasil (IBrX). In other words, these funds hold shares of companies that have low or average capitalization. The remaining 15% can be invested in shares of companies with higher liquidity or capitalization since they are not included on the top 10 of the IBrX. 8
8
(http://www.anbima.com.br/data/files/B4/B2/98/EF/642085106351AF7569A80AC2/Cartilha_da_Nova_Classificacao_de_Fundos_ 1_.pdf)
19 3. Literature Review
The mutual fund market worldwide has increased exponentially in the last decades and several studies have been conducted in an attempt to evaluate how mutual funds perform and whether fund managers are able to provide abnormal returns. The development of the CAPM by Sharpe (1964) and Lintner (1965) provides the equilibrium relationship between expected return and risk of securities and portfolios. However, the empirical record of the model is poor and invalidates the way it is used in applications. For example, the CAPM says that the risk of a stock should be measured relative to a comprehensive “market portfolio” that in principle can include not just traded financial assets, but also consumer durables, real estate, and human capital (Fama and French, 2004).Based on the CAPM, Treynor (1965), Sharpe (1966) and Jensen (1968) proposed risk-adjusted measures of performance known as traditional measures of performance evaluation, which have been widely used, inside and outside academic circles (Cortez and Armada, 1997).
Despite their popularity, these first traditional risk-adjusted measures of performance suffer from many limitations. For instance, the Jensen measure (alpha), assumes that there is only one source of systematic risk (the market). However, especially since the 1970s and 1980s several studies documented other variables that help explain securities’ returns (e.g., Banz, 1981, Basu, 1983, Fama and French, 1992). This type of evidence supports the Arbitrage Pricing Theory (APT), developed by Ross (1976), and the use of multi-factor models to evaluate the performance of mutual funds. Indeed, academics have proposed several multi-factor models to explain stock returns.
Fama and French (1993) propose the three-factor model that includes, besides the market, the size factor (SMB - small minus big) and the value/growth factor (HML- high minus low). Later, Carhart (1997) added a new factor known as momentum (MOM) to account for the fact that portfolios of past winners tend to outperform in the subsequent period. More recently, Fama and French (2015) improved the previous three-factor model to make it more precise on evaluating and predicting better returns
20
and extended it to include two additional factors: profitability (RMW) and Investment (CMA).
In general, empirical evidence supports the use of multi-factor models, as they have a better ability to capture the sources of systematic risk. However, both single and multi-factor models of performance evaluation are known as unconditional models as they assume that expected returns and risk are invariant over time, regardless of market conditions. This may be a problem since evaluating fund performance under this assumption may lead to biased estimates of performance (Jagannathan and Wang, 1996). On the other hand, in the conditional performance evaluation risk exposures and market premiums are allowed to vary over time according to the state of the economy that is measured by using predetermined public information variables, allowing the possibility of estimating expected risk and performance in different market conditions (Aragon and Ferson, 2007).
An alternative approach to conditional models is to include a dummy variable in the multi-factor models to consider different states of the market (Silva and Cortez, 2016). This approach allows to distinguish fund performance and risk exposures in different states of the market (such as expansions and recessions) and is motivated by several studies that document that mutual fund managers perform better in periods of recessions than in expansions (e.g., Glode, 2011; and Kosowski, 2011)
Most of the empirical studies on fund performance focus on developed markets and, in general, the results show that funds do not outperform the benchmark. These results support the efficient market hypothesis, according to which it is not possible to outperform the market because stock prices incorporate all the existing information.
It is also worth mentioning that most studies on mutual funds focus on the performance of large-cap-funds while small-cap fund performance has not been extensively explored. A few studies show evidence that small-cap funds are able to outperform the market index, namely Otten and Reijnders (2012) on UK funds, Otten and Bams (2002) on European funds and Agyei-Ampomah, Clare, Mason and Thomas (2015) on US funds. These results motivate the evaluation of Brazilian small-cap equity funds in order to analyze how funds in this subcategory perform.
21
Lower abnormal returns and poor diversification opportunities provided from advanced markets have become the main drivers for the increasing demand for assets on emerging economies. High growth rates, global penetration and improvement on financial strategies had made the emerging economies more popular to international investment flows (Lemeshko and Rejnuš, 2015). As an emerging market, Brazil has been considered as a profitable investment opportunity by international investors due the combination of several factors, such as an international scenario of high liquidity and the relative strengthening of capital market institutions, created by the conditions for a vigorous expansion of the Brazilian stock market (Laes and Silva, 2014).
There are few studies on the performance of Brazilian mutual funds. Laes and Silva (2014) evaluate the performance of equity mutual funds using the Carhart (1997) four-factor model with a bootstrap analysis to separate skill from luck. The results of this study are in line with the general literature and suggest that professional management reduces rather than adds value to investors. Leusin and Brito (2008), using CAPM-based measures of performance and timing models, find evidence of fund outperformance. Consistent with Leusin and Brito (2008), Gomes and Cresto (2010) find that a small number of funds have superior performance and there is a little or no evidence of market timing. Berggrun et al (2014) examine performance persistence in the Brazilian equity fund market and find evidence of persistence for small and retails funds.
In line with Berggrun et al. (2014), Andaku and Pinto (2003) find evidence of long-term persistence of Brazilian equity funds. As mentioned previously, these studies have several limitations, as they do not evaluate performance with measures that consider time-varying risk and performance. This dissertation intends to fill this gap by evaluating the performance of Brazilian equity mutual funds, namely small cap funds, with more robust methodologies that condition fund performance to different market states.
22 4. Methodology
The purpose of this dissertation is to evaluate the performance of Brazilian small cap equity mutual funds. We will start the empirical study by using Jensen’s alpha measure (1968) that identifies whether the portfolio is earning the proper return for its risk level. Although there are limitations on this model, we consider that it could be important to show its results. Jensen’s (1968) alpha is estimated from the following regression:
( )
Where, Rit is the return of the fund i in period t, Rft is a risk free rate in period t, Rmt is
the market return in period t, αi is the abnormal return of the fund, βi is the systematic
risk and εit the residual term.
The Fama and French (1993) three-factor model includes, besides the market, two additional factors: size and book-to-market, that have been shown to be relevant in explaining returns, and it is estimated according to the following regression:
( )
Where SMB (small minus big) is the difference in returns between a portfolio of small stocks and a portfolio of large stocks and HML (high minus low) is the difference in returns between a portfolio of high to-market stocks and a portfolio of low book-to-market stocks.
The previous models for evaluating performance are unconditional models as they assume that expected returns and risk are invariant over time, regardless of market conditions. In contrast, conditional models consider risk exposures and the related market premiums to vary over time with the state of the economy. Ferson and Schadt (1996) consider that risk is a linear function of predetermined information variables that represent the state of the economy (
Z
t1). The conditional model ofFerson and Schadt (1996) is given by:
23
Where represents the difference between the return of the portfolio and the return
of the strategies due the risk exposure that varies over time.
z
t1 represents thevector of lagged information variables measured as deviations from their averages
))
(
(z
t1
Z
t1
E
Z
, captures the response of the conditional betas to theinformation variables, and represents the average beta.
Christopherson, Ferson and Glassman (1998) extend the conditional model to allow not only for time-varying risk but also time-varying alphas. . According to
Christopherson, Ferson and Glassman (1998), alpha is a linear function of predetermined information variables (
Z
t1), resulting in the following model forevaluating performance:
( ) ( )
Where αoi represents the fund average conditional performance measure and A’i
captures the response of the conditional alpha to the public information variables. The conditional model of Christopherson, Ferson and Glassman (1998) can be also applied to a multi-factor context as shown below by extending the Fama and French (1993) three-factor model to a conditional context:
( ) ( )
According to Silva and Cortez (2016), an alternative approach to conditioning fund performance to market conditions involves using a dummy variable to distinguish between periods of crisis (or recessions) and non-crisis (or expansions), as in Areal, Cortez and Silva (2013). This approach has the advantage of allowing comparing fund performance and risk exposures in different market states. In the case of the three-factor model, the specification of the model is:
( ) ( )
24
where variable Dt represents a dummy that assumes a value of 0 in periods of
25 5. Data description
This dissertation aims to investigate the performance of Brazilian mutual funds specifically for the small cap market. We identified the small cap funds identified as such by ANBIMA and considered those that had at least 36 monthly observations. This resulted in a dataset of 29 Brazilian small cap funds investing domestically. 9 The dataset includes non-surviving funds we were able to identify, in order to mitigate survivorship bias10. Monthly total return series for the funds over the period from 2000 – 2017 were collected from DataStream and returns were computed in a discrete way. Fund performance is analyzed both at the individual fund level and at the aggregate level, by constructing an equally weighted portfolio of funds.
As benchmarks, we considered two alternatives: IBOVESPA, which is an index that represents the average performance of the most traded and representative shares of the Brazilian stock market and a small cap benchmark (MSCI small cap). The purpose of using these two indexes is to compare performance estimates using a general and a style index. 11 Monthly returns on the indexes were also collected from DataStream.
In relation to the additional risk factors (size and book-to-market), since Professor Kenneth French’s website does not provide the Fama and French factors for Brazil, they will be computed in a way similar to Cortez, Silva and Areal (2012) and Cremers, Petajisto, and Zitzewitz (2013). As a matter of fact, Cremers, Petajisto, and Zitzewitz (2013) argue that index-based factors are more suitable for the performance model than the Fama and French (1993) factors. Hence, the size factor (SMB) is computed as the difference between the returns of a small-cap index and a large-cap index, proxied by the MSCI Brazil Small Cap and the MSCI Brazil Large Cap indexes, respectively. The value/growth factor (HML) is computed as the difference between the returns of a high book-to- market index (value index) and a low book-to-market index (growth index), proxied by the MSCI Brazil Value and MSCI Brazil Growth index, respectively. The data for the construction of these factors was collected from
9
The list of funds is presented in Appendix 1. 10
For an investigation of survivorship bias in mutual fund performance see Brown, Goetzmann, Ibboston and Ross (1992). 11
The relevance of using a style index and a general index is also stressed by Otten and Bams (2002) and Otten and Reijnders (2012) and Agyei- Ampomah, Clare, Mason and Thomas (2015).
26
DataStream. As usual in Brazil, the risk free rate is CDI (Interbank Deposit Certificate) that is calculated daily and will be accrued monthly.
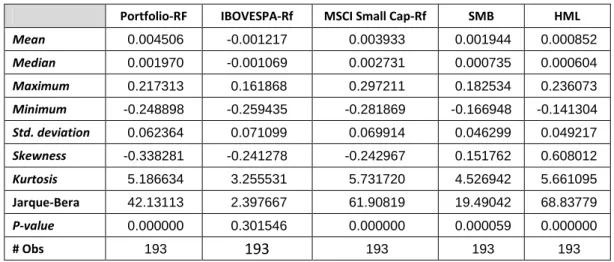
Table 2 reports descriptive statistics for the equally- weighted portfolio of small cap funds, the benchmarks, and the risk factors.
Table 2 – Summary statistics
This table reports summary statistics for the equally weighted portfolios small cap funds. Mean excess returns, standard deviation, maximum and minimum, Skewness, kurtosis and the probability value of the Jarque-Bera (JB) test are reported for the period 2000 to 2017. Similar statistics are also presented for the market benchmarks and the additional risk factors.
Portfolio-RF IBOVESPA-Rf MSCI Small Cap-Rf SMB HML
Mean 0.004506 -0.001217 0.003933 0.001944 0.000852 Median 0.001970 -0.001069 0.002731 0.000735 0.000604 Maximum 0.217313 0.161868 0.297211 0.182534 0.236073 Minimum -0.248898 -0.259435 -0.281869 -0.166948 -0.141304 Std. deviation 0.062364 0.071099 0.069914 0.046299 0.049217 Skewness -0.338281 -0.241278 -0.242967 0.151762 0.608012 Kurtosis 5.186634 3.255531 5.731720 4.526942 5.661095 Jarque-Bera 42.13113 2.397667 61.90819 19.49042 68.83779 P-value 0.000000 0.301546 0.000000 0.000059 0.000000 # Obs 193 193 193 193 193
Table 2 presents the mean, median, maximum and minimum the standard deviation, Skewness and Kurtosis of a portfolio composed by 29 funds. We observe that the mean excess returns of the portfolio are positive, whereas the mean excess returns of the indexes are negative. The results for the Jarque-Bera test reject the hypothesis of the portfolios’ returns being normally distributed a fact that further justifies the use of conditional models of performance evaluation (Adcock, Cortez, Armada and Silva, 2012).
Regarding the public available information variables to be used in the conditional model, we have selected two: the short term interest rate and the dividend yield, as in Ferson and Warther (1996) and Cortez, Silva and Areal (2012). Several studies (Keim and Stambaugh, 1986; Fama and French, 1989; and Pesaran and Timmermann, 1995) propose that these variables related to economic conditions are
27
useful in predicting the returns of stocks and bonds. As these variables are public and can be used to assess economic conditions, investors can easily use them in their predictions of expected returns. The short term interest rate is expected that to have a negative impact on the performance of stocks, according to Fama and Schwert (1977). In turn, the dividend yield is expected to have a positive impact (Fama and French, 1989).
The yield on a Brazilian Real 3-month interest rate is used as proxy for the short-term rate. The dividend yield is based on the Bovespa index.
Regarding the application of these variables, they are used lagged one period. Furthermore, we proceeded with the stochastic detrending procedure (Ferson, Sarkissian and Simin, 2003) that consists in subtracting the returns each period by the previous 12-month moving average. As suggested by Bernhardt and Jung (1979), the public information variables are used in their mean zero values, in order to avoid problems related to scale effects.
To identify periods of expansions and recessions we used information provided by the ECRI (European Cycle Research Institute). According to the peaks and troughs indicated by ECRI, we can identify periods of recession and expansion within the sample period of evaluation (December 2000 to January 2017), as shown in table 3.
Table 3- Business cycles for Brazil – Periods of expansion and recession
Expansion periods Recession periods 29/12/2000 - 28/02/2001 30/03/2001 - 30/11/2001 31/12/2001 - 31/10/2002 29/11/2002 - 30/05/2003 30/06/2003 - 29/08/2008 30/09/2008 - 31/12/2008 31/01/2009 - 31/01/2014 28/02/2014 - 31/01/2017 Source: https://www.businesscycle.com/download/report/3723
28 6. Empirical Results
6.1. Unconditional Models
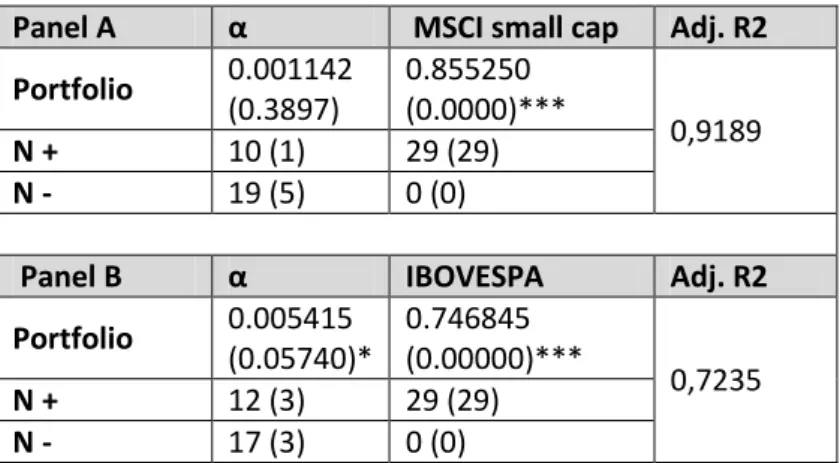
The empirical results regarding the performance estimates of an equally weighted portfolio that includes 29 small-cap funds and a summary of the performance of individual funds are presented in table 3. Even though there are limitations concerning the CAPM, it is important to evaluate the performance of actively managed Brazilian small cap funds with a one-factor model in order to compare the results with previous studies. Table 4 presents the results of Jensen`s alpha considering both a style index (MSCI Brazil small cap) and a general index (IBOVESPA).
Table 4 –Jensen’s alpha (1968)
The table reports estimates of alpha, beta and adjusted R2 for the equally weighted portfolio of small cap funds using Jensen’s alpha (1968). Panel A reports the results using the style index MSCI Small Cap and Panel B those obtained using the general market index IBOVESPA. N+ and N- represent the number of funds with positive and negative alphas, respectively. The number of funds with statistically significant coefficients, at a 5% level, is reported in brackets. ***, ** and * represent statistical significance at the 1% and 5% and 10% level, respectively, based on heteroskedasticity and autocorrelation consistent standard errors following Newey & West (1987). P-values are reported in parentheses.
Panel A α MSCI small cap Adj. R2 Portfolio 0.001142 (0.3897) 0.855250 (0.0000)*** 0,9189 N + 10 (1) 29 (29) N - 19 (5) 0 (0)
Panel B α IBOVESPA Adj. R2
Portfolio 0.005415 (0.05740)* 0.746845 (0.00000)*** 0,7235 N + 12 (3) 29 (29) N - 17 (3) 0 (0)
29
When using the style index as benchmark, the portfolio’s alpha is positive but not statistically significant. At the individual fund level, there is one fund with a positive and statistically significant alpha and five are funds with negative and statistically significant alphas. 12 Regarding the general index, the alpha is positive and statistically significant but only at the 10% level. Three funds show statistically positive performance and another three show statistically negative performance. Most funds show neutral performance.
Furthermore, the beta coefficient is higher for the style index than the general index and the explanatory power of the model is higher when using the style index as benchmark, as expected. In contrast to the study of Otten and Bams (2002) on European funds, that finds evidence of positive alphas when using the unconditional model, the alpha regarding the style index is positive but not statistically significant. However, the general index alpha`s portfolio is positive and statistically significant and shows evidence of outperformance, thus being more consistent with the study of Otten and Bams (2002).
As mentioned before, Jensen`s model (1968) suffers from well-known limitations. To overcome the fact that there are additional risk factors that explain returns, Fama and French (1993) include two other factors besides the market: the Small minus Big (SMB) and High minus Low (HML) factors, that been shown to be relevant in explaining returns. Table 5 presents the results for of the three-factor model.
12
30
Table 5 – Alpha from the three-factor model of Fama and French (1993).
The table reports estimates of alpha, beta and adjusted R2 for the equally weighted portfolio of small cap funds using the Fama and French (1993) model. Panel A reports the results using the style index MSCI Small Cap and Panel B those obtained using the general market index IBOVESPA. The SMB and HML factors are obtained by subtracting the returns of the MSCI Large Cap Index to the returns of the MSCI Small Cap Index and the returns of the MSCI Growth Index to the returns of the MSCI Value Index, respectively. N+ and N- represent the number of funds with positive and negative alphas, respectively. The number of funds with statistically significant coefficients, at a 5% level, is reported in brackets. ***, ** and * represent statistical significance at the 1% and 5% and 10% level, respectively, based on heteroskedasticity and autocorrelation consistent standard errors following Newey & West (1987). P-values are reported in parentheses.
In panel A (using the style index) the portfolio`s alpha is positive but not statistically significant. However when using the general index, represented in panel B, the alpha is positive and statistically significant. At the individual fund level,13 when using the style index there is one fund that exhibits a positive and statistically significant alpha and 5 funds with negative and statistically significant alphas. When the general index is used, there are 5 funds with positive statistically significant alphas and no fund shows statistically negative performance. Overall, most funds show neutral performance, although when using the general market index fund performance is improved.
The portfolio’s market beta 0.913644 and 0.833504 for the style index and general index respectively. It becomes clear that the multi-factor model has greater explanatory power as compared to the one-factor model for the general index ( 0.7235 against 0.8754), but the difference is much lower when the style index is used ( 0.9189
13
The detailed results for the individual funds are presented in Appendices 4 and 5.
Panel A α MSCI small cap SMB HML Adj R2 Portfolio 0.001326 0.913644 -0.1635 -0.111918 0,9331 (0.25850) (0.0000)*** (0.0000)*** (0.00140)*** N + 12 (1) 29 (29) 3 (0) 3 (0) N - 17 (5) 0 (0) 26 (15) 26(22)
Panel B α IBOVESPA SMB HML Adj R2
Portfolio 0.004737 0.833504 0.480392 -0.176625
0,8754 (0.0094)*** (0.0000)*** (0.0000)*** (0.0000)***
N + 16 ( 5 ) 29 (29) 29(29) 3 (0)
31
against 0.9331). Panel A shows that the SMB coefficient is negative and statistically significant. It can be assumed that this is due to the fact that market index already captures part of the small size risk premium. The HML factor has a negative and statistically significant coefficient, denoting more exposure to companies with low book-to-market (growth companies). In turn, when using the general market index, the SMB factor is positive and statistically significant for all funds, showing a clear tendency of funds to be oriented to small cap companies. The HML factor is negative and statistically significant, denoting more exposure to companies with low book-to-market (as already observed when using the style index). These results are consistent with those found in the study of Otten and Bams (2002).
32 6.2 Conditional Model
Considering that unconditional models can produce biased performance estimates, we will next turn to conditional models that consider the state of the economy.
We start by applying the conditional model of Christopherson, Ferson and Glassman (1998) that allows for time-varying risk and performance. We chose to use this model following Ferson, Sarkissian and Simin’s (2008) claim that when time-varying alphas are ignored and only time-time-varying betas are considered, risk estimates can be biased.
The results for the conditional model are presented below (table 6).14 In general, we find evidence of outperformance for the conditional models when using both style and general indexes.
Table 6 – The conditional model of Christopherson, Ferson and Glassman (1998) in a multi-factor context.
The table reports estimates of alpha, beta and adjusted R2 for the equally weighted portfolio of small cap funds using the Christopherson, Ferson and Glassman (1998) model, Panel A reports the results using the style index MSCI Small Cap and Panel B those obtained using the general market index IBOVESPA.. The SMB and HML factors are obtained by subtracting the returns of the MSCI Large Cap Index to the returns of the MSCI Small Cap Index and the returns of the MSCI Growth Index to the returns of the MSCI Value Index, respectively. DY and STR correspond to the public information variables Dividend Yield and Short-term rate, respectively. w, w and w correspond to p-values of Wald tests on the null hypothesis of no time-varying alphas, no time-varying betas and no time-varying alphas and betas, respectively. N+ and N- represent the number of funds with positive and negative alphas, respectively. The number of funds with statistically significant coefficients, at a 5% level, is reported in brackets. ***, ** and * represent statistical significance at the 1% and 5% and 10% level, respectively, based on heteroskedasticity and autocorrelation consistent standard errors following Newey & West (1987). P-values are reported in parentheses.
14
33
Panel A α DY STR MSCI small cap SMB HML Adj. R2 Portfolio 0,002213 (0.09280)* 0,000254 (0.90710) -0,000179 (0.66250) 0,9223 (0.0000)*** -0,168212 (0.0000)*** -0,106026 (0.00150)*** 0,9350 N + 15 (4) 12 (1) 14 (3) 29 (29) 6 (2) 6 (0) N - 14 (4) 17 (1) 15 (4) 0 (0) 23 (17) 23 (15) MSCI small
cap*DY SMB*DY HML*DY
MSCI small cap*STR SMB*STR HML*STR -0,013199 (0.60960) -0,022126 (0.54310) 0,102669 (0.0017)*** 0,019384 (0.0333)** -0,008985 (0.523) -0,021934 (0.1477) N + 12 (2) 21 (4) 27 (10) 24 (9) 10 (2) 4 (0) N - 17 (9) 8 (0) 2 (0) 5 (1) 19 (7) 25 (14)
Panel B α DY STR IBOVESPA SMB HML Adj. R2 Portfolio 0,005548 (0.00390)*** 0,000131 (0.95880) -0,00176 (0.02890)** 0,823956 (0.0000)*** 0,467734 (0.0000)*** -0,171283 (0.00020)*** 0,8753 N + 18 (10) 10 (1) 8 (1) 29 (29) 29 (27) 7 (1) N - 11 (0) 19 (1) 21 (7) 0 (0) 0 (0) 22 (14)
IBOVESPA*DY SMB*DY HML*DY IBOVESPA*STR SMB*STR HML*STR
-0,011151 (0.77380) 0,027834 (0.54180) 0,008933 (0.859) 0,020638 (0.1652) 0,013837 (0.4786) -0,00832 (0.7924) N + 8 (1) 23 (1) 24 (7) 27 (13) 16 (4) 10 (0) N - 21 (11) 6 (1) 5 (0) 2(0) 13 (1) 19 (8)
The results of the conditional model show positive and statistically significant alphas for the equally-weighted portfolio of small cap funds. However, the level of significance is weaker (10% level) when using the style index. Using the style index, there are 4 funds with positive and statistically significant alphas and another 4 with negative and statistically significant alphas. For the general index, 10 funds show positive and statistically significant alphas and there are no funds exhibiting negative alphas. With this model, small cap funds tend to show a higher performance than with unconditional models, which is consistent with evidence of Ferson and Schadt (1996) that conditional models increase estimates of performance. In relation to the conditional alphas, when the general index is used, the coefficient of the short-term rate is negative and statistically significant, as expected.
The betas related to SMB and HML are still negative and statistically significant when the style index is used. In the case of the general index, the SMB and HML are positive and negative, respectively, and both statistically significant. These results are
Wald test for MSCI small cap Wald test for Ibovespa Wald α Wald β Wald αβ Wald α Wald β Wald αβ 0.9072 0.0003 0.0005 0.079 0.5862 0.4458
34
similar to the risk exposures already observed when applying the three-factor unconditional model. In terms of the conditional betas, only the coefficients of MSCI*DY and MSCI*STR are positive and statistically significant. According to the results, we are able to conclude that fund´s managers incorporate and apply dynamic strategies in order to adjust the performance and risk of the portfolio.
The Wald test was applied in order to test if the coefficients vary jointly over time. When using the style index, we find evidence that beta and alpha and beta jointly vary over time according to the public information variables, but alpha does not. With the general index, we find weak evidence of time-varying alphas. We can conclude that the managers are able to apply dynamic strategies in order to adjust for the performance regarding the general index and also for risk in case of the style index.
Following Silva and Cortez (2016), an alternative approach for a conditional model involves using a dummy variable to distinguish between periods of crisis (or recessions) and non-crisis (or expansions). Examples of studies using this approach (but in the context of the four-factor model) include Areal, Cortez and Silva (2013) for socially responsible funds. As mentioned in the methodology section, we will use the dummy in the context of the three-factor model. Table 7 presents the results.15
Table 7 – Three-factor model of Fama and French with a dummy variable.
The table reports the results for the Fama and French three-factor model (1993), with a dummy variable for periods of expansion and recession for the equally weighted portfolio of small cap funds. Panel A reports the results using the style index MSCI Small Cap and Panel B those obtained using the general market index IBOVESPA. The SMB and HML factors are obtained by subtracting the returns of the MSCI Large Cap Index to the returns of the MSCI Small Cap Index and the returns of the MSCI Growth Index to the returns of the MSCI Value Index, respectively. N+ and N- represent the number of funds with positive and negative alphas, respectively. The number of funds with statistically significant coefficients, at a 5% level, is reported in brackets. ***, ** and * represent statistical significance at the 1% and 5% and 10% level, respectively, based on heteroskedasticity and autocorrelation consistent standard errors following Newey & West (1987). P-values are reported in parentheses.
15
35 Panel A α α rec MSCI small
cap
MSCI small cap rec
SMB SMBrec HML HMLrec Adj R2
Portfolio (0.17100) 0,001785 (0.76410) -0,00072 (0.0000)*** 0,929744 (0.41620) -0,04614 (0.0000)*** -0,19153 (0.01630)** 0,14019 (0.46780) -0,02707 (0.01040)** -0,13891
0,9381 N + 13 (5) 18 (4) 28 (28) 3 (0) 1 (0) 23 (16) 4 (1) 12 (5)
N - 15 (4) 10 (4) 0 (0) 25 (13) 27 (20) 5 (1) 24 (9) 16 (7)
Panel B α α rec Ibovespa Iborec SMB SMBrec HML HMLrec Adj R2
Portfolio (0.0008)*** 0,007679 (0.0330)** -0,00858 (0.0000)*** 0,820612 0,008347 (0.88110) (0.0000)*** 0,4283 (0.00180)*** 0,1772 -0,135547 (0.00580)* ** -0,056691 (0.4777) 0,8814 N + 25 (10) 3 (0) 29 (29) 11 (2) 25 (24) 27 (19) 1 (0) 20 (8) N - 4 (0) 26 (11) 0 (0) 18 (9) 4 (2) 2 (0) 28 (14) 9 (2)
Panel A shows that the alpha regarding the style index is positive but not statistically significant for the expansion period and negative but not statistically significant for the recession period. This means that fund performance is neutral in expansion periods and it does not change significantly in recessions. This evidence diverges with the findings of Kosowki (2011) and Leite and Cortez (2015). The beta for the market is positive and statistically significant in expansion periods and it does not change is recessions. In relation to the additional risk factors, the results show that in recessions, funds increase their exposure to small size stocks. The results for the HML factor also show a significant increase in the exposure of small cap funds to growth stocks in recessions, as in Otten and Reijnders (2012) for small-caps in the U.K market.
Regarding the general index, the portfolio’s alpha´s in expansions is positive and statistically significant, whereas in recession periods it is negative and statistically significant. This means that fund performance decreases significantly in recession periods. We can therefore conclude that the fund outperformance observed for the overall period is mainly driven by the performance in expansion periods. In relation to the risk factors, we notice that the funds are exposed to small cap firms in expansion periods and this exposure significantly increases in recessions.
36
Overall, the results obtained with this model show that performance does not increase in periods of recession, in contrast with other studies in the literature that address developed markets.
37 7. Conclusions
The evaluation on the performance of mutual funds in the small-cap subcategory has not been explored for the Brazilian market. This study was motivated by the evidence found by Otten and Bams (2002), Otten, R., & Reijnders, M. (2012), and
Agyei-Ampomah, Clare, Mason and Thomas (2015), who uncover a higher performance of small cap funds. This dissertation analyzed 29 Brazilian funds composed by small-cap companies over the period of 2000 to 2017. The models used to evaluate fund performance were the unconditional models based on the CAPM and the three-factor model of Fama and French (1993).
In terms of conditional models, we applied the conditional model of Christopherson, Ferson and Glassman (1988) that allows for time-varying risk and performance. This model incorporates public information variables for the assessment of the state of the economy. Additionally, we use the three-factor model with the inclusion of a dummy variable to distinguish periods of expansions from periods of regressions. Fund performance was evaluated at the aggregate level and at the individual fund level and using a general market and a style index.
It is worth mentioning that small cap fund performance is sensitive to the use of a general or a style index. In general, the results are consistent with previous studies and show some ability of small cap funds to outperform the general market index. When using the style index, performance tends to be more neutral. When extending the study to a multi-factor context, the explanatory power of the model increases. In relation to the size risk factor, when using the style index the sign of the coefficient is not as expected, which may be due to the fact that the market factor is already capturing the small size exposure. The results using the general index confirm the higher exposure of these funds to small cap stocks. The results on the HML factor show more exposure of small cap funds to low book-to-market (growth) companies.
We also applied the conditional model of Christopherson, Ferson and Glassman (1998), incorporating two public information variables: the dividend yield and the short term interest rate. The findings obtained with this model showed a higher fund
38
performance relative to the unconditional models. Using the style index, the hypothesis that the betas remained constant over time was rejected, suggesting fund managers seek for the adjustment of their portfolios according to the state of the economy. In the case of the general index we find weak evidence of time-varying alphas.
Moreover, when comparing fund performance during recession and expansion periods, the results show that fund performance in recessions is neutral and does not change in recessions when using the style index. In the case of the general index, funds outperform in expansions but performance decreases significantly in recessions.
Overall, the results are in line with previous evidence that some small cap funds may outperform the general market. There are several limitations that can be pointed out to this study. One of them is related to the public information variables used. It would be useful to previously test the predictability of several public information variables to select which are the most appropriate to use in the Brazilian market. Additionally, there are alternative criteria to identify different market states. For instance, one might use the procedure of Pagan and Soussonov (2003) that uses peaks and troughs of market indexes to identify bull and bear markets.
Given the shortage of studies on small cap funds, we suggest that further investigation should be driven for emerging markets in order to deepen the knowledge on mutual fund performance.
39 References
Adcock, C. J., Cortez, M. C., Armada, M. R., & Silva, F. (2012). Time varying betas and the unconditional distribution of asset returns. Quantitative Finance, 12(6), 951-967.
Agyei-Ampomah, S., Clare, A., Mason, A., & Thomas, S. (2015). On luck versus skill when performance benchmarks are style-consistent. Journal of Banking & Finance, 59, 127-145.
Andaku, F. T. A., & Pinto, A. C. F. (2003). A persistência de desempenho dos fundos de investimento em ações no Brasil. Revista de Economia e Administração, 2(2), 23-33.
Aragon, G.O., & Ferson, W.E.(2007).Portfolio Performance Evaluation. Foundation and Trends in Finance,2, 83-190.
Areal, N., Cortez, M., & Silva, F. (2013). The conditional performance of US mutual funds over different market regimes: do different types of ethical screens matter? Financial Markets and Portfolio Management, 27(4), 397-429.
Banz, R. W. (1981). The relationship between return and market value of common stocks. Journal of Financial economics, 9(1), 3-18.
Basu, S. (1983). The relationship between earnings' yield, market value and return for NYSE common stocks: Further evidence. Journal of Financial economics, 12(1), 129-156.
Bernhardt, I., & Jung, B. S. (1979). The interpretation of least squares regression with interaction or polynomial terms. The Review of Economics and Statistics, 481-483.
Berggrun, L., Mongrut, S., Umaña, B., & Varga, G. (2014). Persistence in equity fund performance in Brazil. Emerging Markets Finance and Trade, 50(2), 16-33.
Brown, S. J., Goetzmann, W., Ibbotson, R. G., & Ross, S. A. (1992). Survivorship bias in performance studies. The Review of Financial Studies, 5(4), 553-580.
Cao, C., Iliev, P., & Velthuis, R. (2017). Style drift: Evidence from small-cap mutual funds. Journal of Banking & Finance, 78, 42-57.
Carhart, M. M. (1997). On persistence in Mutual Fund Performance. The Journal of Finance, 52, 57-82.
40
Christopherson, J. A., Ferson, W. E., & Glassman, D. A. (1998). Conditioning manager alphas on economic information: Another look at the persistence of performance. Review of Financial Studies, 11(1), 111-142.
Cortez, M.C., & Armada, M.J.R. (1997). On Mutual fund performance evaluation. Estudos de Gestão, 3(3),145-163.
Cortez, M. C., Silva, F., & Areal, N. (2012). Socially responsible investing in the global market: The performance of US and European funds. International Journal of Finance & Economics, 17(3), 254-271.
Cremers, M., Petajisto,A., & Zitzewitz, E. (2013). Should Benchmark Indices Have Alpha? Revisiting Performance Evaluation. Critical Finance Review 2, 1–48.
Fama, E. F., & French, K. R. (1992). The cross‐section of expected stock returns. The Journal of Finance, 47(2), 427-465.
Fama, E. F., & French, K. R. (1993). Common risk factors in the returns on stocks and bonds. The Journal of Financial Economics, 33, 3-56.
Fama, E.F., &French, K. R. (1989). Business conditions and expected returns on stocks and bonds. Journal of Financial Economics, 25, 23-49.
Fama, E. F., & French, K. R. (2004). The Capital Asset Pricing Model : Theory and Evidence. Journal of Economic Perspectives, 18(3),25-46.
Fama, E.F., & French, K. R. (2015). A Five-Factor Asset Pricing Model. Journal of Financial Economics, 16(1), 1-22.
Fama, E. F., & Schwert, G. W. (1977). Asset returns and inflation. Journal of financial economics, 5(2), 115-146.
Ferson, W., Sarkissian, S.. & Simin, T. (2008). Asset pricing models with conditional betas and alphas: the effects of data snooping and spurious regression. Journal of Financial and Quantitative Analysis, 43 (2), 331-354.
Ferson W.E., Sarkissian S., & Simin, T. (2003). Is stock return predictability spurious? Journal of Investment Management, 1(3), 1–10.
41
Ferson, W. E., & Schadt, R. W. (1996). Measuring Fund Strategy and Performance in Changing Economic Conditions. The Journal of Finance, 51, 425-461.
Ferson, W. E., & Warther, V. A. (1996). Evaluating fund performance in a dynamic market. Financial Analysts Journal, 52(6), 20-28.
Glode, V. (2011). Why mutual funds “underperform”? Journal of Financial Economics, 99, 546– 559.
Gomes, F. A. R., & Cresto, V. (2010). Avaliação do desempenho dos fundos Long-Short no Brasil. Revista Brasileira de Finanças, 8(4), 505-529.
Leite, P., & Cortez, M. C. (2015). Performance of European socially responsible funds during market crises: Evidence from France. International Review of Financial Analysis, 40, 132-141.
Jagannathan, R., & Wang, Z. (1996). The conditional CAPM and the cross-section of expected returns. Journal of Finance, 51, 3–53.
Jensen, M. C. (1968). The performance of mutual funds in the period 1945–1964. The Journal of Finance, 23(2), 389-416.
Keim, D.B., & Stambaugh, R.F. (1986). Predicting returns in the stock and bond markets. Journal of Financial Economics, 17(2), 357–390.
Kosowski, R. (2011). Do mutual funds perform when it matters most to investors? US mutual fund performance and risk in recessions and expansions. The Quarterly Journal of Finance, 1(3), 607-664.
Laes, M.A., & Silva, M.E. (2014). Performance of mutual equity funds in Brazil –A bootstrap analysis. EconomiA , 15, 294-306.
Lemeshko, O. & Rejnuš, O. (2015). Performance evaluation of equity mutual funds in countries with emerging economies: Evidence from BRIC, CEE, sea and MENA regions. Procedia Economics and Finance, 30, 476 – 486.
Leusin, L.M.C., & Brito, R. D. (2008). Market timing e avaliação de desempenho dos fundos Brasileiros” [Market Timing and Performance Evaluation of Brazilian Funds]. Revista de
42
Lintner, J. (1965). The valuation of risk assets and the selection of risky investments in stock portfolios and capital budgets. The Review of Economics and Statistics, 13-37.
Marangoni, G. (2012). Anos 1980, década perdida ou ganha?. Instituto de pesquisa econômica
aplicada. Accessed in
http://www.ipea.gov.br/desafios/index.php?option=com_content&view=article&id=2759:cati d=28&Itemid=23.Acesso ( July 7, 2017).
Newey, W. K., & West, K. (1987), A Simple, Positive Semi-Definite, Heteroskedasticity and Autocorrelation Consistent Covariance Matrix. Econometrica, 55, 703–708. [311,312]
Otten, R., & Bams, D. (2002). European mutual fund performance. European Financial Management, 8(1), 75-101.
Otten, R., & Reijnders, M. (2012). The performance of small cap mutual funds: Evidence for the UK. Working Paper, Maastricht University.
Pagan, A. R., & Sossounov, K. A. (2003) . A simple framework for analysing bull and bear markets. Journal of Applied Econometrics, 18(1), 23-46.
Pesaran, M. H., & Timmermann, A. (1995). Predictability of stock returns: Robustness and economic significance. The Journal of Finance, 50(4), 1201-1228.
Ross, S. A. (1976). The arbitrage theory of capital asset pricing. Journal of Economic Theory, 13, 341-360.
Sharpe, W. F. (1964). Capital asset prices: A theory of market equilibrium under conditions of risk. The Journal of Finance, 19(3), 425-442.
Sharpe, W. F. (1966). Mutual fund performance. The Journal of Business, 39(1), 119-138.
Silva, F., & Cortez, M. C. (2016). The performance of US and European green funds in different market conditions. Journal of Cleaner Production, 135, 558-566.
Treynor, J. L. (1965). How to rate management of investment funds. Harvard Business review, 43(1), 63-75.
Varga, G., & Wengert, M. (2010). The growth and size of the Brazilian mutual fund industry.
Munich Personal RePEc Archive. Accessed in