Article
Core-and-Shell Nature of Stöber Silica Particles
Carlos A. P. Leitea, Elizabeth F. de Souzab and Fernando Galembecka*
a
Instituto de Química, Universidade Estadual de Campinas, CP 6154, 13083-970, Campinas - SP, Brazil
b
Instituto de Ciências Biológicas e Química, Pontifícia Universidade Católica de Campinas, CP 1111, 13020-904, Campinas - SP, Brazil
Duas amostras diferentes de partículas monodispersas de sílica de Stöber foram examinadas por microscopia eletrônica de transmissão analítica, utilizando-se diferentes tipos de imagens: campo-claro, campo escuro, imagens espectrais e mapas de distribuição elementar. As partículas (141 e 36 nm de diâmetro efetivo) contêm domínios de relação elementar O/Si e, portanto, de grau de hidratação muito variável, que coexistem com partículas medindo poucos nanômetros de diâmetro e com relação O/Si elevada, que aparecem dispersas no fundo das imagens. As imagens de campo claro e de perda de energia revelam que as partículas maiores possuem uma morfologia do tipo caroço-casca e as cascas das partículas possuem uma quantidade maior de domínios com razão O/Si maior, comparada com o interior da partícula, o que é atribuído ao acúmulo de domínios mais hidratados na casca, e também à presença de compostos de carbono, contaminantes da sílica. Por outro lado, as partículas menores (diâmetro efetivo = 36 nm) não são esféricas nem têm morfologia caroço-casca, embora também sejam formadas por domínios de composições químicas muito diferentes. Os vários mecanismos de formação de partículas apresentados na literatura são discutidos, considerando-se estes novos resultados.
Two different samples of monodisperse Stöber silica particles were examined in the analytical transmission electron microscope, using different imaging modes: bright-field, dark-field, energy-loss and elemental distribution maps. The particles (effective diameters = 141 and 36 nm) are formed by domains of variable O/Si ratio, which is consistent with a variable degree of hydration, and they coexist with particles with a high O/Si ratio measuring a few nanometers only, which appear dispersed in the picture background. Bright-field and energy-loss images of the larger particles show a core-and-shell morphology, and the shells have a higher amount of high-O/Si domains as well as contaminating carbon compounds. On the other hand, the smaller particles (effective diameter = 36 nm) are also formed by distinct domains, but their morphology is neither spherical or core-and-shell. The mechanisms for particle formation presented in the literature are discussed, considering the present findings.
Keywords: colloidal silica, transmission electron microscopy, energy-filtered imaging, silica particle microchemistry
Printed in Brazil 0103 - 5053 $6.00+0.00
Introduction
Uniform fine particles are interesting as model systems in the study of adsorption and catalysis, as well as in the study of size-dependent solid state properties such as quantum confinement1 and superplasticity2,3. There have been significant achievements concerning the preparation of uniform colloid dispersions, both inorganic4 and organic5.
However, uniformity has often been considered only in relationship to particle size and shape, and little information
is currently available concerning the uniformity of chemical composition of particles made out of one only constituent, such as the Stöber silica particles.
Many years ago, Stöber et al.6 reported an elegant method of preparing monodisperse spherical silica particles with sizes covering almost the whole colloidal range, by tetraethylorthosilicate (TEOS) hydrolysis, in ethanolic medium in the presence of ammonia. They carried out a systematic study of the reaction parameters and after some major changes of the experimental conditions he has obtained suspensions of quasi-monodisperse silica spheres. After this pioneering work, Stöber silica particles have been used as model colloids in a large number of experimental
investigations7-10. Based on the Stöber method, Kaiser11
prepared completely porous silica particles by co-hydro-lysis and subsequent condensation of tetraethoxysilane and an n-alkyltrialkoxysilane in a mixture of ethanol, water and aqueous ammonia. Silica particles almost perfectly spherical with porous siliceous shells and dense cores were also obtained by Büchel and co-workers12. Preparation of
spherical silica nanoparticles with a narrower size distribution than that obtained by hydrolysis of tetraethoxy-silane in homogeneous alcoholic media has been achieved in microemulsion systems13-15.
Recently, several investigators have shifted their attention to the study of the mechanisms of formation and growth of these particles16. For this purpose various
techniques, such as nuclear magnetic resonance17, conductimetry18, Raman scattering19, dynamic light
scattering20, transmission electron microscopy21 and small-angle X-ray scattering22 were applied to investigate both
the chemistry and the physical properties of the particles, but more noticeably the dynamics of growth23. Despite
these intensive investigations, a clear and complete picture for the formation of uniform silica particles has not yet emerged. The elucidation of their domain nanostructure is also an attractive research objective.
In this laboratory, we have recently observed significant heterogeneity and domain structure of polymer latex particles, which affects particle aggregation, macro-crystallization and film formation24, 25. This information
is not usually available for inorganic fine particles, for which reason we decided to examine the uniformity of chemical composition of the Stöber silica particles. To do this, we have examined two samples of particles of different sizes, using three different imaging techniques in an analytical transmission electron microscope.
Experimental
Preparation of the silica particles
Silica particles were prepared by the method of Stöber
et al.6. TEOS, absolute ethanol used as the solvent and
ammonium hydroxide were of analytical reagent grade. Glassware was cleaned with 10% hydrogen chloride, rinsed with distilled water and absolute ethanol. The desired concentrations of ammonium hydroxide, ethanol and water were mixed in Erlenmeyer flasks with ground stoppers. Total water contents were calculated by adding up the fractional amounts introduced by the components. Subsequently, the TEOS was added and the flasks were placed in a water bath at a temperature of 25 ± 0.1oC and under ultrasonic vibration (20 kHz) for 120 minutes. The
total volume of solution in each preparation was 50 mL. The measured volumes of the components used to prepare the larger silica particles were 4 mL TEOS, 4 mL saturated ammonium hydroxide and 50 mL ethanol. The smaller particles were prepared by mixing 4 mL TEOS, 2 mL saturated ammonium hydroxide and 50 mL ethanol. Following the synthesis, ca. 50 mL of each silica dispersion was stored in a 100 mL glass bottle.
Photon Correlation Spectroscopy (PCS)
Effective diameter was measured in a ZetaPlus instrument (Brookhaven Instruments) with Bi-MAS software and a solid state laser (15 mW, λ= 670 nm) as the radiation source. Samples were contained within 3-mL dust-free acrylic cuvettes. A volume of 100 µL of the silica dispersion was added to the cuvette previously filled with 2.5 mL of 10-3 mol L-1 aqueous potassium chloride in order to give a suitable scattering intensity.
Analytical transmission electron microscopy imaging
background from the image acquired in the third image, and it is checked for signal saturation, using the R-map macro from the AnalySis software. Each elemental map is validated by three independent checks: i) contrast inversion in the plasmon region; ii) spectral verification and iii) absence of signal saturation.
For individual silica particle examination, one drop of the silica dispersion (1% solids content) was deposited on carbon-coated parlodion films supported in 400 mesh copper grids (Ted Pella). To make sure that the whole particles were not excessively thick, they were first observed using ∆E = 0 eV electrons, then observed again at ∆E = 15-50 eV. Image contrast inversion was always obtained, showing that a significant number of electrons were transmitted throughout the particles26. This observation is understood, considering that the 80 keV electrons mean free path within these silica particles is greater than 80 nm for elastic scattering27,
and is estimated as a few hundreds of nanometers, for inelastic scattering28.
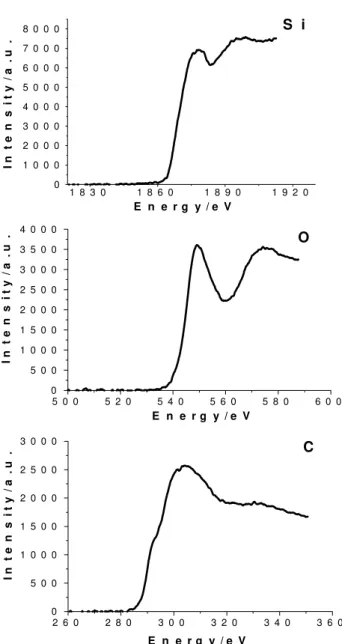
Elemental images were observed for the relevant elements found in this sample, using the three-window technique29, with monochromatic electrons corresponding to the silicon K-edge (1860 eV, 20 eV window), oxygen K-edge (532 eV, 15 eV window) and carbon K-edge (284 eV, 15 eV).
Image processing was performed in an IBM PC microcomputer using the Image-Pro Plus 4.0 image analyzer program (Media Cybernetics).
Results
According to the data from the PCS measurements, the effective particle diameter of the larger particles is 141 ± 2.5 nm, showing that these particles have a narrow size distribution. The sample of smaller particles has an effective particle diameter of 36 ± 1.0 nm.
Different types of images were obtained: Figure 1 shows images obtained for the larger silica particles: bright-field, dark-field, energy-filtered image obtained at 20 eV energy loss, and Si, O and C elemental distribution maps. Energy-loss spectra were scanned for this sample, from 100 to 2,000 eV, and the only bands observed are those assigned to C, O and Si, as shown in the Figure 2. The detection of carbon compounds is rather unexpected since these were not previously reported in the abundant literature on these silica particles.
The bright-field, dark-field and energy-filtered images for the smaller particles are in Figure 3, and the corresponding elemental maps were published in another recent paper from this laboratory30.
The observations made from these pictures are summed up as follows, for the sample of larger silica particles:
b a
f d
c
e
220 nm b
a
f d
c
e b a
f d
c
e 220 nm
the atomic ordering of the different particle domains, their thickness and solid structural characteristics. These silica particles are non-crystalline, consequently this difference cannot be assigned to differences in crystalline domain orientation, but rather to differences in the chemical composition in different domains. Beyond, the brighter domains predominate at the particle outer shell while the darker domains predominate at the particle cores. Interparticle space is also filled with scattering material and the picture background shows scattered bright spots, well away from the major particles. These small bright spots are assigned to either dry solute or to very small particles with few nanometers.
iii) The filtered image in Figure 1(c) is an energy-loss image at 20 eV, in the giant resonance (or plasmon, in conducting solids) region. It presents a similar pattern to the dark-field image, but with a higher contrast since the particle cores appear darker in Figure 1c. Moreover, the bright rings around the particles are thinner in Figure 1c than in Figure 1b, showing that the factors for the contrast in both are not identical. There is not sufficient information in the literature to allow us to correlate giant-resonance images with chemical features of sample domains, but this image confirms the core-and shell nature of these particles.
bf
200nm
df
200nm
bf
200nm
df
200nm
Figure 3. (a) Brightfield and (b) dark-field images taken from the smaller particles (effective particle diameter = 36 nm).
5 0 0 5 2 0 5 4 0 5 6 0 5 8 0 6 0 0 0
5 0 0 1 0 0 0 1 5 0 0 2 0 0 0 2 5 0 0 3 0 0 0 3 5 0 0 4 0 0 0
O
I
n
t
e
ns
i
t
y
/
a
.
u.
E n e r g y / e V
1 8 3 0 1 8 6 0 1 8 9 0 1 9 2 0 0
1 0 0 0 2 0 0 0 3 0 0 0 4 0 0 0 5 0 0 0 6 0 0 0 7 0 0 0
8 0 0 0 S i
In
t
e
n
s
it
y
/a
.
u
.
E n e r g y / e V
2 6 0 2 8 0 3 0 0 3 2 0 3 4 0 3 6 0 0
5 0 0 1 0 0 0 1 5 0 0 2 0 0 0 2 5 0 0 3 0 0 0
C
In
t
e
n
s
it
y
/a
.
u
.
E n e r g y / e V
Figure 2. Energy-loss spectra of the 141 nm diameter particles, in the regions corresponding to the C(K), Si(K) and O(K) thresholds (from top to botton).
i) The bright-field picture in Figure 1(a) shows that the particles are rather uniform in size, and their borders are not strictly circular. Particles in close contact with the neighbors display a marked deformation approaching the hexagonal shape, analogous to the deformations observed in polymer latexes24,25 and evidencing the plasticity of these particles.
In some areas, the interparticle space is darker than the background, showing the presence of material joining the particles. Moreover, the background shows scattered darker areas, made out of small nanometric grains.
ii) The darkfield image in Figure 1(b) shows a clear contrast within each particle, displaying bright and dark spots extending for a few nanometers each. Contrast in darkfield images is due to differences in the electron scattering ability and thus in
(a)
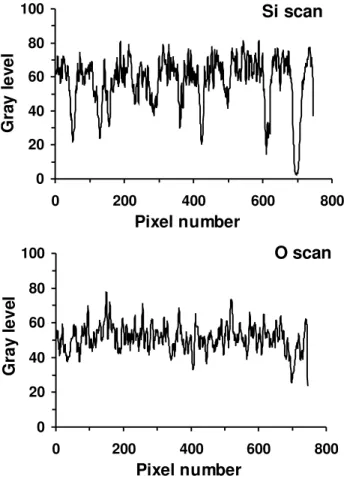
iv) The O and Si elemental maps are similar, but the particles appear slightly larger in the O maps than in the Si maps. This is best seen in the line-scans presented in Figure 4. In the O scan we observe sharp peaks and valleys, evidencing large composition changes among neighboring domains or voids and pores, extending for 2-10 nm each. The Si map also displays the same sharp features, but these are packed into broader bands that correspond to the individual particles. Consequently, the Si/O atom ratio in the particles is maximum at the particle centers and it decreases gradually to the borders. Finally, the C map shows the particle centers as dark areas, with bright outer rings, bright interstitial spaces and bright spots in the background, at positions roughly coinciding with the bright areas in the background of the dark-field, 20-eV images. Nanometer-sized spots are also seen scattered in the particle cores.
Observations of similar images for the sample with 36 effective particle diameter did not show a core-and-shell structure, in the dark-field images, as seen in Figure 3. Examination of other types of images (Si and O elemental maps, energy-loss30) did not also give any evidence for a
core-and-shell structure in these small particles.
Discussion
According to Iller31, in most sols that consist of discrete
spherical particles of amorphous silica, the interior of the particles is made out of anhydrous SiO2 with a density of 2.2 g.cm-3. The silicon atoms located at the surface hold OH groups that are not lost when the silica is dried to remove free water. Calculation of the silanol number of the silica surface by purely geometric considerations and the density of amorphous silica indicated that there should be 7.8 silicon atoms.nm-2 at or very near the surface.
The present results show that the silica particles have a pronounced domain structure but the larger particles (141nm diameter) have also an accumulation of particles with a higher O/Si ratio at the particle borders, as compared to the particle cores. The accumulation of one domain type at the particle outer layers imparts to the particles a core-and-shell nature, and the thickness of the shell layer extends for many nanometers. The particles detected by PCS coexist with nanometric scattered particles (which appear dispersed in the pictures background as well as in the particle interstices) with a Si/O ratio lower than that of the large particle cores.
Following existing reports on silica particle formation from TEOS, carbon from the ethoxy groups is transformed into ethanol, which is easily dialyzed and also lost by evaporation12. However, Van Helden et al.7 have already
reported the presence of carbon in the composition of Stöber silica particles. They assumed that the carbon content determined gravimetrically originates from unhydrolyzed ethoxy groups and calculated that the particles contain 91.5% weight silica, 5.25% water and 0.97% ethoxy groups. Therefore, the observation of carbon compounds in the particle shells as well as in the background and in the interparticle interstices is in agreement with their work. The amount of non-dialyzable, non-volatile carbon compounds found at the particle surfaces were detected by EELS, which is a technique endowed with single-atom sensitivity. It is also important to note that the observed carbon compounds may derive not only from incomplete ethoxy group hydrolysis (leading to ethoxylated silicic acid), but also from TEOS impurities, as well as from some ethanol oxidation product, or perhaps from some contamination introduced during the particles fabrication, e.g. from hydrolyzed fragments from the dialysis bags cellulose. The elucidation of the origin of the carbon will require further additional work, well beyond the scope of this paper. On the other hand, the smaller particles (36 nm diameter) examined in this work do not have the same structure as the larger (141 nm) particles.
Si scan
0 20 40 60 80 100
0 200 400 600 800
Pixel number
G
ra
y
l
e
v
e
l
O scan
0 20 40 60 80 100
0 200 400 600 800
Pixel number
G
ray l
eve
l
The domain structure of the larger and smaller particles as well as the core-and-shell nature of the former may be understood considering the particle synthesis procedure and the intervening reactions. The form of the resulting polymers obtained during base catalyzed hydrolysis of tetraethylorthosilicate in alcoholic solutions is governed by the relative rates of hydrolysis and condensation. Silanol groups are formed by hydrolysis of silicon alkoxide monomers and undergo condensation, according to the following equations23,32:
≡Si-OR + H2O →≡Si-OH + ROH (1)
≡Si-OH + ≡Si-OH →≡Si-O-SI ≡ + H2O (2)
≡Si-OR + ≡Si-OH →≡Si-O-SI ≡ + ROH (3)
where R represents an alkoxide group. Spherical particles are obtained when enough ammonia is present in the initial reaction mixture, and the final particle size depends mainly on the initial alkoxysilane, water and ammonia concentrations.
Harris and co-workers33 have investigated the growth
of particles produced by this method. They assumed that the first hydrolysis of an alkoxide group is the rate-limiting step in the formation of nuclei. The remaining groups hydrolyze rapidly, and small nuclei are created from fully hydrolyzed species. In the early stages of the reaction, these small nuclei aggregate, forming colloidally stable seed particles, and in the later stages of the reaction particle growth occurs mainly by addition of monomer to the surface, not by aggregation of the small nuclei particles as claimed by Bogush and Zukoski34. Using the results of
cryo-TEM experiments, Bailey and Mecartney21 postulated
that hydrolyzed monomer polymerizes to form microgel clusters due to polysilicic acid cross-linking, that collapse upon reaching a certain size and cross-linking density. Collapsed particles densified by condensation are colloidally stable with respect to each other. The denser seed particles grow by addition of hydrolyzed monomer or polymer addition to their surfaces. The rate of growth of the polymers must be slow enough so that after a sufficient number of seeds has been formed, the polymers attach to a particle surface before they grow to a large enough size to collapse and form a seed particle themselves. Boukari and co-workers16 have proposed that the initial
particles also with a polymeric structure are better described like mass fractals, in which the nucleating backbones or seeds are used to build the compact and stable particles observed later in the growth. Before the equilibrium is reached, there is a distribution of particles of various sizes and fractality. Besides that, under conditions in which
condensation is rapid compared to hydrolysis, polysiloxane chains or rings result while in the reverse case more extensively crosslinked polymeric clusters are formed. Therefore, polymers formed in base-catalyzed reactions are more highly branched clusters35.
In a batch synthesis procedure, the changing medium may thus allow for changes in the particle structure, due to changes in the nature of the siloxane chains formed as the reaction proceeds. However, we note that none of these authors seemed to be aware of the core-and-shell structure or of presence of carbon compounds in these particles, as described in the present paper. Consequently, our data add two new pieces of information, which will have to be considered in future work aiming at elucidating silica particle formation: the particles are formed by differentiated domains, and there is a detectable amount of dialyzable, non-volatile carbon compounds at the particle surfaces.
Finally, the core-and-shell structure formation is understood, since in the larger particles the more hydrophilic chains move to the particle surface, driven by the minimization of interfacial tension and thus following the same mechanism proposed by El-Aasser and colleagues36
for core-and-shell formation in polymer colloids. Moreover, the accumulation of carbon compounds at the particle surfaces add to differentiation between particle core and particle shell. However, the amount, nature and significance of the carbon compounds detected in this work will require a significant amount of further experimental work.
Conclusions
The larger silica particle (effective diameter = 141 nm) cores have a domain structure, and the thick outer shells contain both hitherto unidentified carbon compounds and a higher silanol content than the particle bulk. On the other hand, the smaller particles (36 nm) do not show a marked core-and-shell morphology, but a marked particle bulk heterogeneity. Very small particles with few nanometers are observed in the background, with a low Si/O ratio and a high C/Si ratio. These observations are consistent with the following picture for particle formation: different kinds of siloxane chains are formed and aggregate, generating small particles of non-uniform chemical composition. In the larger particles, the more hydrophilic chains move to the outer particle shell, driven by the minimization of interfacial tension, thus forming a core-and-shell structure.
Acknowledgements
References
1. Henglein, A. Chem. Rev. 1989, 89, 1861.
2. Averback, R. S.; Höfler, H. J.; Tao, R. Mater. Sci. Eng. 1993, 166, 169.
3. Galembeck, F.; Lima, E. C. O.; Masson, N. C.; Monteiro, V. A. R.; Souza, E. F. In Fine Particles Science and Technology: From Micro to Nanoparticles; Pelizzetti, E., Ed.; Kluwer; Dordrecht, 1996, p.267-279. 4. Matijevic, E. Chem. Mater. 1993, 5, 426.
5. Hammouda, A.; Gulik-Krzywicki, T.; Pileni, M. P.
Langmuir1995, 11, 3656.
6. Stöber, W.; Fink, A.; Bohn, E. J. Colloid Interface Sci. 1968, 26, 62.
7. Van Helden, A. K.; Vrij, A. J. Colloid Interface Sci.
1980, 78, 312.
8. Kirkland, J. J. J. Chromatogr. 1979, 185, 273. 9. Kops-Werkhoven, M. M.; Fijnaut, H. M. J. Chem.
Phys. 1981, 74, 1618.
10. Tan, C. G.; Bowen, B. D.; Epstein, N. J. Colloid Interface Sci.1987, 118, 290.
11. Kaiser, C.; Büchel, G.; Lüdtke, S.; Lauer, I.; Unger, K. K. In Characterisations of Porous Solids IV; McEnaney, B.; Mays, T. J.; Rouquérol, J.; Rodríguez-Reimoso, F.; Sing, K. S. W.; Unger, K. K., Eds.; Royal Society of Chemistry; Cambridge, 1997, p. 406-412. 12. Büchel, G.; Unger, K. M.; Matsumoto, A.; Tsutsumi,
K. Adv. Mater. 1998, 10, 1037.
13. Osseo-Asare, K.; Arriagada, F. J. Colloids Surf.1990,
50, 321.
14. Minehan, W. T.; Messing, G. L. Colloids Surf.1992,
63, 181.
15. Esquena, J.; Tadros, Th. F.; Kostarelos, K.; Solans, C.
Langmuir1997, 13, 6400.
16. Boukari, H.; Lin, J. S.; Harris, M. T. Chem. Mater. 1997, 9, 2376.
17. Lee, K. T.; Look, J. L.; Harris, M. T.; McCormick, A. V. J. Colloid Interface Sci. 1997, 194, 78.
18. Bogush, G. H.; Zukoski, C. F. J. Colloid Interface Sci. 1991, 142, 1.
19. Matsoukas, T.; Gulari, E. J. Colloid Interface Sci.
1988, 124, 252.
20. Biddle, D.; Walldal, C.; Wall, S. Colloids Surf., A
1996, 118, 89.
21. Bailey, J. K.; Mecartney, M. L. Colloids Surf., A 1992,
63, 151.
22. Konishi, T.; Yamahara, E.; Ise, N. Langmuir1996,
12, 2608.
23. Boukari, H.; Lin, J. S.; Harris, M. T. J. Colloid Interface Sci. 1997, 194, 311.
24. Cardoso, A. H.; Leite, C. A. P.; Galembeck, F.
Langmuir1998, 14, 3187.
25. Galembeck, F., Souza, E.F. In Polymer Interfaces and Emulsions; Esumi K., Ed.; Marcel Dekker; New York, 1999, p. 119-166.
26. We are grateful to Dr. W. Probst (LEO-Zeiss Elektronenmikroskopie Gmbh) for this valuable private communication.
27. Newbury, D. E. In Principles of Analytical Electron Microscopy; Joy, D. C.; Romig Jr., A. D.; Goldstein, J. L., Eds.; Plenum Press; New York, 1986.
28. Ibid., p. 20.
29. Reimer, L.; Zepke, U.; Moesch, J.; Schulze-Hillert, St.; Ross-Messemer, M.; Probst, W.; Weimer, E.
EELS Spectroscopy: A Reference Handbook of Standard Data for Identification and Interpretation of Electron Energy Loss Spectra and for Generation of Electron Spectroscopic Images; Carl Zeiss; Oberkochen, 1992.
30. Costa, C. A. R.; Leite, C. A. P.; Souza, E. F.; Galembeck, F. Langmuir2001, 17, 189.
31. Iler, R. K. The Chemistry of Silica; Wiley; New York, 1979.
32. Lindberg, R.; Sjöblom, J.; Sundholm, G. Colloids Surf., A 1995, 99, 79.
33. Harris, M. T.; Brunson, R. R.; Byers, C. H. J.Non-Cryst. Solids1990, 121, 397.
34. Bogush, G. H.; Zukoski, C. F. In Ultrastructure Processing of Advanced Ceramic; Mackenzie, J. D., Ed.; Wiley; New York, 1988, p.477.
35. Yamane, M.; Inoue, S.; Yasumori, J. J. Non-Cryst. Solids1984, 63, 13.
36. Dimonie, V. L.; El-Aasser, M. S.; Vanderhoff, J. W.
Polym. Mat. Sci. Eng.1988, 58, 821.
Received: July 11, 2000 Published on the web: May 25, 2001