Printed version ISSN 0001-3765 / Online version ISSN 1678-2690 http://dx.doi.org/10.1590/0001-3765201720160760
www.scielo.br/aabc | www.fb.com/aabcjournal
Sampling procedures for inventory of commercial volume tree species in Amazon Forest
SYLVIO P. NETTO1
, ALLAN L. PELISSARI1
, VINICIUS C. CYSNEIROS1 , MARCELO BONAZZA2 and CARLOS R. SANQUETTA1
1
Engenharia Florestal, Universidade Federal do Paraná/UFPR, Av. Prof. Lothário Meissner, 632, Jardim Botânico, 80210-170 Curitiba, PR, Brazil 2
Engenharia Florestal, Universidade Federal de Santa Catarina/UFSC, Rod. Ulysses Gaboardi, Km 3, Pessegueirinho, 89520-000 Curitibanos, SC, Brazil
Manuscript received on November 4, 2016; accepted for publication on April 3, 2017
ABSTRACT
The spatial distribution of tropical tree species can affect the consistency of the estimators in commercial
forest inventories, therefore, appropriate sampling procedures are required to survey species with different
spatial patterns in the Amazon Forest. For this, the present study aims to evaluate the conventional
sampling procedures and introduce the adaptive cluster sampling for volumetric inventories of Amazonian
tree species, considering the hypotheses that the density, the spatial distribution and the zero-plots affect
the consistency of the estimators, and that the adaptive cluster sampling allows to obtain more accurate
volumetric estimation. We use data from a census carried out in Jamari National Forest, Brazil, where trees
with diameters equal to or higher than 40 cm were measured in 1,355 plots. Species with different spatial
patterns were selected and sampled with simple random sampling, systematic sampling, linear cluster
sampling and adaptive cluster sampling, whereby the accuracy of the volumetric estimation and presence
of zero-plots were evaluated. The sampling procedures applied to species were affected by the low density
of trees and the large number of zero-plots, wherein the adaptive clusters allowed concentrating the
sampling effort in plots with trees and, thus, agglutinating more representative samples to estimate the
commercial volume.
Key words:
Adaptive cluster sampling, spatial species distribution, volume estimation, zero-plots.
Correspondence to: Allan Libanio Pelissari E-mail: [email protected]
INTRODUCTION
The Amazon Forest composes the richest collection
of plant species on the planet, having approximately
16 thousand tree species, where approximately
50% of the trees are concentrated in only 1.4% of
species (Ter Steege et al. 2013) in a flora composed
of many rare species of restricted distribution
(Hopkins 2007). For this, the spatial patterns are
frequently the focus of ecological researches,
due to the high diversity in tropical forests that is
characterized by low density of tax (Condit et al.
2000). This knowledge is important to inventories,
especially those intended for production and
conservation forests.
The spatial distributions of species are
fundamental for ecological modeling (Condit et al.
patterns, autoecological characteristics, syndrome
of dispersion and reproductive biology (Crawley
1986, Pianka 1994, Dale 1999). However, the
spatial patterns can affect the consistency of the
sampling procedures. If the pattern is aggregate, a
sample with low number of plots can result in high
or low density when the results are extrapolated
to the population and, thus, appropriated sampling
techniques are required (Odum and Barret 2008).
In Brazilian Amazon, conventional sampling
procedures are constantly applied to estimate
volumetric stock of species groups (Higuchi et
al. 1982, Cavalcanti et al. 2011, Oliveira et al.
2014), where there are many rare and aggregate
species responsible for high diversity that affect
effectiveness of forest inventories. Nevertheless,
there are no studies reported in the specialized
literature about appropriate sampling techniques
by specifics species with different spatial patterns
in the Amazon Forest.
In many studies, the adaptive cluster sampling
has proved to be a versatile tool for evaluating rare
and aggregate populations, because by conventional
sampling you cannot estimate well their parameters
(Thompson 1990, Brown and Manly 1998, Talvitie
et al. 2006). Initially, the adaptive sampling was
developed by Thompson (1990), which compared
the results of this procedure with the conventional
ones, evaluating different populations and finding
satisfactory results, especially for aggregate and
rare events.
In the adaptive cluster sampling, the first
level is based on conventional methods as random
or systematic. Through detection of a species or
interesting phenomenon in the plots, the second
level is started and new plots are allocated
contiguously to the first ones. The second level
continues until the target phenomenon is not
detected and, then, the construction of the clusters
is interrupted. Furthermore, its sampling structure
and their estimators are presented in Thompson
(1990), Acharya et al. (2000), Talvitie et al. (2006)
and Lei et al. (2012).
Considering the hypotheses that (1) the low
density of trees, the spatial distribution of species
and the high number of zero-plots affect the
consistency of the samplings in tropical forests;
and that (2) the adaptive cluster sampling allows to
obtain more accurate volumetric stocks; the present
study aims to evaluate the conventional sampling
procedures and introduce the adaptive cluster
sampling to inventory of tree species in Amazon
Forest.
MATERIALS AND METHODS
STUDY AREA
A census dataset of a native forest with 1,596 ha
and located in the Jamari National Forest, Rondônia
State, Brazil, was used to developed this study. The
Jamari National Forest occupies an area between
the coordinates 09º 00’ 00” S at 09º 30’ 00” S and
62º 44’ 05” W at 63º 16’ 64” W in the Southwest
Amazon Forest, where all trees with diameter at 1.3
m above the ground equal to or greater than 40 cm
were measured, identified and georeferenced in an
Annual Production Unit divided in 1,355 plots of
50 m × 250 m.
PHYTOSOCIOLOGICAL CHARACTERIZATION
The forest structure was characterized by means of
phytosociological descriptors (Müeller-Dombois
and Ellenberg 1974) and diversity indices (Shannon
and Weaver 1949, Simpson 1949, Pielou 1969).
Also, the spatial patterns of species were classified
distributions, through ArcGIS 10.3 software and
Spatial Analyst package (ESRI 2016).
SAMPLING PROCEDURES
Amazon tree species were selected considering
different spatial patterns and the criteria of rarity,
economic and social importance. Thus, the simple
random, systematic, linear cluster and adaptive
cluster sampling procedures were applied with 10%
of the potential sampling units of 50 m × 250 m.
In simple random sampling (Figure 1a), the plots
were randomly allocated to each one of the selected
species populations, while the systematic sampling
units in single stage were distributed with regular
intervals of 250 m between them (Figure 1b).
Furthermore, linear clusters were allocated
randomly in the study area, being formed by four
units of 50 m × 250 m separated by plots of equal
size (Figure 1c). For adaptive clusters, the first
stage consisted in a random allocation of sampling
units, and those that corresponded to the inclusion
criterion of at least one tree were selected for the
second stage; subsequently, their neighbor plots
with one or more trees were incorporated into each
cluster, forming their respective networks in the
final stage (Figure 1d).
The estimated volume per hectare (1 to 3) and
variance of the mean (4 to 7) were calculated for
simple random sampling, systematic sampling, and
linear cluster sampling (Péllico Netto and Brena
1997, Husch et al. 2002). While the modified
Horvitz-Thompson estimators (Thompson 1990)
were used and implemented by R statistical program
(R Core Team 2013) for the adaptive clusters
sampling. Furthermore, the standard error (8),
relative sampling error (9), and confidence interval
(10) were calculated for all sampling procedures.
Sample mean ( )x
Simple random and Systematic 1
n i i
X
x
n
==
∑
(1)Linear cluster 1 1
n M
ij i j X x
nM
= =
=
∑ ∑
(2)Adaptive cluster * 1
1
K k k ky
x
N
==
∑
α
(3)Variance of the mean ( )2
x s Simple random 2 2 x x
s
N
n
s
n
N
−
=
(4)Systematic
(
)
(
)
(
)
1 2 1 2 1 1 2 1 n i i i x X X s f n n − + = − ≅ − −∑
(5)Linear cluster
(
)
2 2
1
1
x xs
s
r M
nM
=
+
−
(6)Adaptive cluster * * 2 2 1 1 1 1 K K
j k jk x
j k jk j k
y y s
N = =
= −
∑∑
αStandard error ( )sx
2
x x
s
=
s
(8)Relative sampling error (E%) E% 100tsx
x
= ± (9)
Confidence interval the mean (CI)
IC x
[
−
ts
x≤ ≤ +
µ
x
ts
x]
=
P
(10)Where: n = number of units sampled, Xi = volume of the sample unit i, Xij = volume of unit i in linear clusters j, M = number of
subunits of linear clusters, N = number of potential sample units, k = number of networks of the adaptive clusters present in the
sample on the first sampling level, *
k
y
= sum of observations of the net k of the adaptive clusters k, αk = probability of initial samplebelong to network k, αjk = probability of initial sample to include at least one sampling unit in each network j and k,
2
x
s = sample variance of volume,f n
N
= , t = value of student’s t distribution, and P = associated probability of 95%.
Thereby, for each sampling procedure and
species, the statistical consistency was evaluated
through
Z
test at significance level of 0.05, using
the mean census volume (
µ
) as the reference
value. The following hypotheses were tested: null
0
(H )
, when there is no rejection of equality between
the mean volume of sample and census
(
H0:X=µ)
; and alternative
(H1), when there is rejection of
this equality
(
H1:X≠µ)
. Also, the relative errors
were evaluated, and the zero-plots, without trees
(Heinsdijk 1965), were quantified in the sampling
procedures.
RESULTS
In the census, 17,557 trees were sampled of 67
species (Table I), where Fabaceae was the family
with highest floristic richness (24 species),
followed by Vochysiaceae with five species, and
Moraceae and Lecythidaceae with four species
each. Moreover, by means of the values of diversity
indices: Shannon (
H
’) = 3.550, Pielou (
J
) = 0.845,
and Simpson (
C
) = 0.038, it was evidenced a
highly diverse community and with the absence of
dominance of few species, representing, therefore,
a balance between all taxa.
Distinct spatial distribution patterns were
observed (Figure 2), where representative tree
species were selected: a)
Terminalia amazonica
, a
rare species, with density of only seven trees, and
concentrated in a specific region (Figure 2a); (b)
Apuleia leiocarpa
, with 89 trees and concentrated
in some locations (Figure 2b); c)
Cedrela fissilis
,
with 81 trees dispersed in the area (Figure 2c); and
d)
Bertholletia excelsa
, with high density of 904
trees (Figure 2d). In kernel maps, the density values
TABLE I
Phytosociological descriptors of the commercial tree species in Jamari National Forest, Brazilian Amazon.
Species Family N D% F% Do% VI% Morisita’s index
Dinizia excelsa Ducke Fabaceae 986 5.62 4.67 13.11 7.80 0.50 Aggregate
Peltogyne paniculata Benth. Fabaceae 1,598 9.10 6.62 5.89 7.20 0.50 Aggregate
Astronium lecointei Ducke Anacardiaceae 1,296 7.38 5.84 6.35 6.53 0.50 Aggregate
Bertholletia excelsa Humb. & Bonpl. Lecythidaceae 904 5.15 4.89 8.93 6.32 0.50 Aggregate
Cariniana micrantha Ducke Lecythidaceae 676 3.85 3.86 6.90 4.87 0.50 Aggregate
Huberodendron swietenioides (Gleason) Ducke Malvaceae 828 4.72 4.03 4.81 4.52 0.50 Aggregate Tachigali sp. Fabaceae 807 4.60 3.94 3.28 3.94 0.50 Aggregate
Couratari stellata A. C. Sm. Lecythidaceae 581 3.31 3.51 3.91 3.58 0.50 Aggregate
Copaifera multijuga Hayne Fabaceae 690 3.93 3.83 2.38 3.38 0.50 Aggregate
Clarisia racemosa Ruíz & Pav. Moraceae 636 3.62 3.42 2.40 3.15 0.50 Aggregate
Aspidosperma sp. Apocynaceae 514 2.93 3.07 3.10 3.03 0.50 Aggregate
Protium robustum (Swart) D.M. Porter Burseraceae 658 3.75 3.01 2.12 2.96 0.50 Aggregate
Hymenolobium heterocarpum Ducke Fabaceae 456 2.60 2.89 3.14 2.87 0.33 Random
Pouteria guianensis Aubl. Sapotaceae 565 3.22 3.17 2.04 2.81 0.50 Aggregate
Dipteryx odorata (Aubl.) Willd. Fabaceae 405 2.31 2.64 2.03 2.33 0.41 Random
Caryocar glabrum Pers. Caryocaraceae 359 2.04 2.44 1.96 2.15 -0.17 Random
Goupia glabra Aubl. Goupiaceae 343 1.95 2.19 2.11 2.09 0.50 Aggregate
Erisma bicolor Ducke Vochysiaceae 336 1.91 2.20 1.74 1.95 0.50 Aggregate
Qualea paraensis Ducke Vochysiaceae 354 2.02 2.23 1.39 1.88 0.50 Aggregate
Allantomadecandra (Ducke) Lecythidaceae 292 1.66 1.96 1.78 1.80 0.39 Random
Vataireopsis speciosa Ducke Fabaceae 302 1.72 2.05 1.23 1.67 0.15 Random
Brosimum rubescens Taub. Moraceae 287 1.63 1.92 1.33 1.63 0.50 Aggregate
Hymenaea palustris Ducke Fabaceae 261 1.49 1.75 1.13 1.45 0.50 Aggregate
Brosimum sp. Moraceae 230 1.31 1.59 1.11 1.33 0.20 Random
Erisma fuscum Ducke Vochysiaceae 235 1.34 1.52 1.09 1.32 0.50 Aggregate
Vatairea guianensis Aubl. Fabaceae 235 1.34 1.56 1.00 1.30 0.50 Aggregate
Cedrelinga cateniformis (Ducke) Ducke Fabaceae 166 0.95 1.03 1.77 1.25 0.50 Aggregate
Iryanthera paradoxa (Schwacke) Warb. Myristicaceae 223 1.27 1.53 0.86 1.22 0.34 Random
Handroanthus incanus (A.H. Gentry) S. O.
Grose Bignoniaceae 168 0.96 1.20 0.98 1.05 0.05 Random
Caryocar villosum (Aubl.) Pers. Caryocaraceae 148 0.84 1.05 1.04 0.98 0.26 Random
Minquartia guianensis Aubl. Olacaceae 183 1.04 1.27 0.58 0.96 0.48 Random
Parkia pendula (Willd.) Benth. ex Walp. Fabaceae 130 0.74 0.94 1.09 0.92 0.18 Random
Enterolobium schomburgkii (Benth.) Benth. Fabaceae 149 0.85 1.07 0.74 0.89 0.43 Random
Simarouba amara Aubl. Simaroubaceae 162 0.92 1.10 0.54 0.85 0.50 Aggregate
Mezilaurus synandra (Mez) Kosterm. Lauraceae 146 0.83 1.00 0.61 0.82 0.50 Aggregate
Handroanthusimpetiginosus (Mart. ex DC.)
Mattos Bignoniaceae 108 0.62 0.74 0.73 0.70 0.50 Aggregate
Species Family N D% F% Do% VI% Morisita’s index
Apuleia leiocarpa (Vogel) J.F.Macbr. Fabaceae 89 0.51 0.59 0.65 0.58 0.50 Aggregate
Martiodendron elatum (Ducke) Gleason Fabaceae 97 0.55 0.71 0.43 0.56 0.21 Random
Diplotropis rodriguesii H.C. Lima Fabaceae 100 0.57 0.74 0.33 0.54 0.05 Random
Manilkara elata (Allemão ex Miq.) Monach. Sapotaceae 91 0.52 0.70 0.35 0.52 -0.45 Random
Cedrela fissilis Vell. Meliaceae 81 0.46 0.61 0.33 0.47 -0.06 Random
Peltogyne venosa (Vahl) Benth. Fabaceae 77 0.44 0.54 0.35 0.44 0.50 Aggregate
Laetia procera (Poepp.) Eichler Salicaceae 76 0.43 0.57 0.27 0.42 -0.02 Random
Virola sp. Myristicaceae 67 0.38 0.50 0.19 0.36 0.07 Random
Dipteryx alata Vogel Fabaceae 57 0.32 0.43 0.22 0.33 -0.04 Random
Cordia goeldiana Huber Boraginaceae 50 0.28 0.36 0.20 0.28 0.50 Aggregate
Hevea guianensis Aubl. Euphorbiaceae 45 0.26 0.31 0.14 0.23 0.50 Aggregate
Jacaranda copaia (Aubl.) D.Don Bignoniaceae 39 0.22 0.30 0.14 0.22 -0.19 Random
Qualea sp. Vochysiaceae 39 0.22 0.27 0.14 0.21 0.50 Aggregate
Parkia multijuga Benth. Fabaceae 25 0.14 0.18 0.13 0.15 0.50 Aggregate
Bagassa guianensis Aubl. Moraceae 24 0.14 0.17 0.10 0.14 0.50 Aggregate
Osteophloeum platyspermum
(Spruce ex A. DC.) Warb. Myristicaceae 15 0.09 0.10 0.07 0.09 0.51 Aggregate
Zollernia paraensis Huber Fabaceae 15 0.09 0.11 0.05 0.08 -0.07 Random
Pouteria eugeniifolia (Pierre) Baehni Sapotaceae 11 0.06 0.07 0.05 0.06 0.51 Aggregate
Terminalia amazonica (J.F.Gmel) Exell. Combretaceae 7 0.04 0.03 0.04 0.04 0.59 Aggregate
Hymenolobium modestum Ducke Fabaceae 5 0.03 0.04 0.04 0.03 -0.02 Random
Aspidosperma sandwithianum Markgr. Apocynaceae 6 0.03 0.05 0.02 0.03 -0.03 Random
Coccoloba latifolia Lam. Polygonaceae 3 0.02 0.02 0.03 0.02 -0.01 Random
Anacardium parviflorum Ducke Anacardiaceae 3 0.02 0.02 0.02 0.02 -0.01 Random
Vochysia sp. Vochysiaceae 3 0.02 0.02 0.02 0.02 -0.01 Random
Trattinnickia rhoifolia Willd* Burseraceae 1 0.01 0.01 0.03 0.02 -
-Lueheopsis rosea (Ducke) Burret* Malvaceae 1 0.01 0.01 0.01 0.01 -
-Parkia sp.* Fabaceae 1 0.01 0.01 0.01 0.01 -
-Hymenaea intermedia Ducke* Fabaceae 1 0.01 0.01 0.00 0.01 -
-Aspidosperma sp.* Apocynaceae 1 0.01 0.01 0.00 0.01 -
-Inga edulis Mart.* Fabaceae 1 0.01 0.01 0.00 0.01 -
-Total 14,666 100 100 100 100
Where: N = number of trees, D% = density, F% = frequency, Do% = dominance, VI% = value of importance, * = it was not possible to calculate the Morisita’s Index for these species, because occurred only one tree in the population, and highlighted lines = indicate de species selected in this study.
were higher in locations with trees and decreased
with increasing distance from these points.
When the Morisita’s index was applied (Table
I), the random spatial distribution
was observed for
Cedrela fissilis
, while the aggregate pattern was
identified for
Apuleia leiocarpa
and
Bertholletia
excelsa
, as well as for
Terminalia amazonica
that
showed the highest level of aggregation and one
of the greatest levels of rarity with density (
D
%)
equal to 0.04%. Considering all species, 44.26%
were classified as random, 55.73% as aggregate,
and none with uniform distribution.
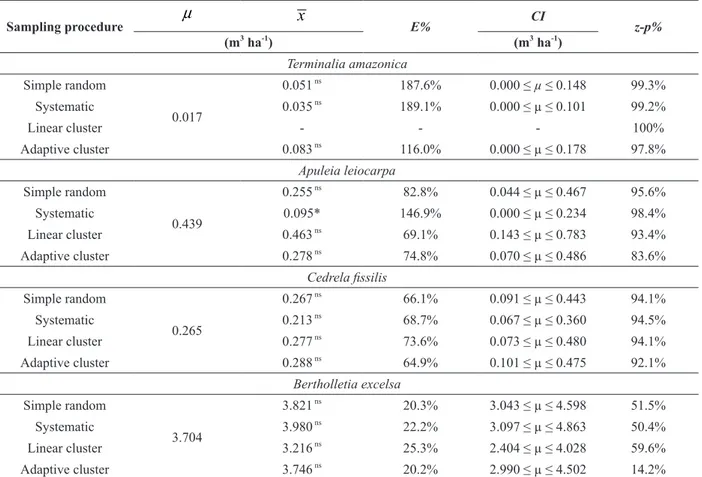
By means of the
Z
test at significance level of
0.05 (Table II), the null hypothesis was rejected
only for mean volume (
x
) in systematic sampling
applied for
Apuleia leiocarpa
. However, statistical
differences in association to the census (
µ
) were
not found between the estimates by others sampling
procedures, resulting in consistent confidence
intervals (
CI
) for the means of studied species.
High relative errors (
E%
) were observed
for the selected species (Table II), especially for
Terminalia amazonica
, for which the application of
adaptive cluster sampling increases the accuracy,
as well as for
Bertholletia excelsa
and
Cedrella
fissilis
. However, linear clusters were not effective
for
Terminalia amazonica
, but they were superior
than other procedures applied to
Apuleia leiocarpa
.
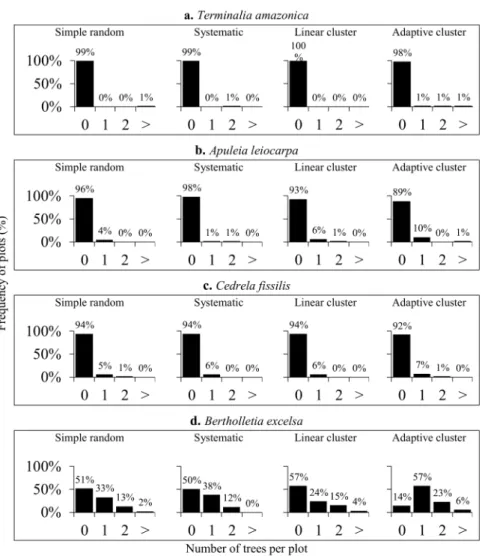
Regarding the percentage of zero-plots
observed in each sampling procedure (Figure 3),
lower values were observed when using adaptive
cluster sampling, mainly to
Bertholletia excelsa
(Figure 3d). Moreover, the absence of trees per
sampling unit resulted in zero-plots frequencies
near to 100% for
Terminalia amazonica
(Figure
3a),
Apuleia leiocarpa
(Figure 3b) and
Cedrela
fissilis
(Figure 3c).
DISCUSSION
According to the selected species with distinct
spatial distribution patterns (Figure 2),
Apuleia
leiocarpa
and
Cedrela fissilis
have wood with
high commercial value (Carvalho 2003) and wide
geographical distribution in the Amazon territory
(Pennington 1981, Oliveira Filho and Fontes 2000).
Terminalia amazonica
is commonly cultivated in
Central America due to its fast growth (Piotto et al.
2003, Moya et al. 2009), while
Bertholletia excelsa
is the most relevant Amazonian species for
non-timber purposes (Thomas et al. 2014), whose nuts
are important for sustaining the Amazonian rural
communities (Salomão 2009).
The Morisita’s index equal to 0.59 for
Terminalia amazonica
was the largest among the
species (Table I), while the aggregate distribution
(0.50) found for
Apuleia leiocarpa
and
Bertholletia
excelsa
is common among tropical species due to
soil conditions and syndrome of species dispersion
(Condit et al. 2000, Plotkin et al. 2000, Seidler and
Plotkin 2006). The random distribution (-0.06) for
Cedrela fissilis
is less frequent, because it implies
in more homogeneity of environment or in less
specificity of the habitat (Matteucci and Colma
1982).
In this context, to compare the influence
of environmental factors in the distribution of
Amazonian tree species, Barroso et al. (2011)
concluded that the soil attributes affect the
abundance of species, although present a weak
correlation with species occurrence. However,
Apuleia leiocarpa
(Figure 2b) and
Cedrela fissilis
(Figure 2c) holds high commercial value and,
thus, the historical factors of the exploitation can
reveal a strong influence on their current spatial
distributions (Tassin and Riviere 2003), since the
study area is inserted into a region of intense timber
exploitation.
Bertholletia excelsa
was observed in groups
In addition to these factors, archaeological and
historical evidences suggest the influence of the
man, through collecting and cultivation, on the
spatial distribution of the species (Peres et al. 2003,
Thomas et al. 2014).
In inventories carried out in the Amazon
Forest, the random, systematic and cluster
sampling procedures are the most commonly
applied (Higuchi 1987, Ubialli et al. 2009,
Cavalcanti et al. 2011, Queiroz et al. 2011, Andrade
et al. 2015). However, in approaches by species,
these procedures have not shown satisfactory
performance in the estimates of the present study
(Table II), possibly due to low density of trees that
affect the composition of representative samples,
especially for
Terminalia amazonica
and, thus,
confirming the first hypothesis of this study.
The spatial patterns (Figure 2) affected in
the effectiveness of the sampling procedures
(Table II), endorsing the first hypothesis, whose
spatial behaviors are concomitant effects of
several mechanisms, as dispersion, predation,
pathogenic disease, tolerance, germination and
competition (Myster and Malahay 2012). On the
other hand, the abiotic factors, such as topography
and lighting, also influencing on the dispersal of
species (Svenning 1999), turn the comprehension
of aspects that determine the distribution pattern of
tropical species more complex (Table II).
TABLE II
Commercial volume estimation and percentage of zero-plots by sampling procedures in Jamari National Forest, Brazilian Amazon.
Sampling procedure
µ
x
E% CI z-p%(m3 ha-1
) (m3
ha-1 )
Terminalia amazonica
Simple random
0.017
0.051 ns
187.6% 0.000 ≤ µ ≤ 0.148 99.3%
Systematic 0.035 ns
189.1% 0.000 ≤ µ ≤ 0.101 99.2%
Linear cluster - - - 100%
Adaptive cluster 0.083 ns
116.0% 0.000 ≤ µ ≤ 0.178 97.8%
Apuleia leiocarpa
Simple random
0.439
0.255 ns
82.8% 0.044 ≤ µ ≤ 0.467 95.6%
Systematic 0.095* 146.9% 0.000 ≤ µ ≤ 0.234 98.4%
Linear cluster 0.463 ns 69.1% 0.143 ≤ µ ≤ 0.783 93.4%
Adaptive cluster 0.278 ns
74.8% 0.070 ≤ µ ≤ 0.486 83.6%
Cedrela fissilis
Simple random
0.265
0.267 ns 66.1% 0.091 ≤ µ ≤ 0.443 94.1%
Systematic 0.213 ns
68.7% 0.067 ≤ µ ≤ 0.360 94.5%
Linear cluster 0.277 ns
73.6% 0.073 ≤ µ ≤ 0.480 94.1%
Adaptive cluster 0.288 ns
64.9% 0.101 ≤ µ ≤ 0.475 92.1%
Bertholletia excelsa
Simple random
3.704
3.821 ns
20.3% 3.043 ≤ µ ≤ 4.598 51.5%
Systematic 3.980 ns
22.2% 3.097 ≤ µ ≤ 4.863 50.4%
Linear cluster 3.216 ns
25.3% 2.404 ≤ µ ≤ 4.028 59.6%
Adaptive cluster 3.746 ns 20.2% 2.990 ≤ µ ≤ 4.502 14.2%
Where: µ = mean volume (census),
x
= mean sample volume, E% = relative sampling error, CI = confidence interval, z-p% =In addition, the high presence of zero-plots
(Figure 3) interferes on the volumetric estimates,
resulting in increase of the sampling error, which
proves the first hypothesis (Table II). Therefore, the
adaptive cluster sampling allowed to concentrate
the sampling effort on non-zero-plots of the
selected species. This enables us to maximize the
efficiency of forest inventories and compose more
representative samples for estimating commercial
volume.
When applying adaptive cluster sampling,
Talvitie et al. (2006) and Lei et al. (2012) observed
that this procedure results in higher efficiency, when
compared to conventional sampling procedures,
highlighting its importance for surveying rare
and aggregate populations. However, few studies
have considered the problems of forest sampling
with adaptive clusters (Roesch Jr 1993, Acharya
et al. 2000), since the sub-sampling of rare species
results in a considerable underestimation of the
biodiversity (Hopkins 2007).
As an alternative to fixed area plots, sampling
methods with probability proportional to size could
reduce or eliminate the presence of zero-plots in
the composition of samples. However, Prodan’s
points and Strand’s lines have showed operationally
impracticable, due to the area size and the difficulty
to include trees of rare species in the sampling units.
Thus, the results confirm the second hypothesis,
that the adaptive cluster sampling reduces the
zero-plots to estimate the commercial volume (Table II),
and is a quite appropriated procedure for sampling
rare populations of many kinds (Thompson 1990,
Roesch Jr 1993, Brown 2003, Talvitie et al. 2006,
Soares et al. 2009, Lei et al. 2012).
The estimator’s effectiveness of the sampling
procedures is directly related to spatial patterns,
levels of aggregation and species density, where the
adaptive clusters enable to concentrate the sampling
effort to plots with occurrence of trees, reducing
the percentage of zero-plots and maximizing the
accuracy of commercial volume estimates in
Amazon Forest inventories. However, the sampling
procedures applied independently to species could
result in unsatisfactory statistical performance in
the volumetric estimations, due to the low density
of individuals and to the high number of zero-plots.
ACKNOWLEDGMENTS
We thank to Conselho Nacional de Desenvolvimento
Científico e Tecnológico - Brazil (CNPq) for a
research scholarship and to Amata Company for
providing the database.
REFERENCES
ACHARYA B, BHATTARAI G, GIER A AND STEIN A. 2000. Systematic adaptive cluster sampling for the assessment of rare tree species in Nepal. For Ecol Manage 137(1-3): 65-73.
AMARAL MK, PÉLLICO NETTO S, LINGNAU C AND FIGUEIREDO FILHO A. 2015. Evaluation of the Morisita index for determination of the spatial distribution of species in a fragment of Araucaria Forest. Appl Ecol Env Res 13(2): 361-372.
ANDRADE DF, GAMA JRV, MELO LO AND RUSCHEL AR. 2015. Inventário florestal de grandes áreas na Floresta Nacional do Tapajós, Pará, Amazônia, Brasil. Biota Amaz 5(1): 109-115.
BARROSO JG, SALIMON CI, SILVEIRA M AND MORATO EF. 2011. Influência de fatores ambientais sobre a ocorrência e distribuição espacial de cinco espécies madeireiras exploradas no Estado do Acre, Brasil. Sci For 39(92): 489-499.
BROWN JA. 2003. Designing an efficient adaptive cluster sample. Environ Ecol Stat 10(1): 95-105.
BROWN JA AND MANLY BJF. 1998. Restricted adaptive cluster sampling. Environ Ecol Stat 5(1): 49-63.
CARVALHO PER. 2003. Espécies Arbóreas Brasileiras. Embrapa Florestas, Colombo, 1039 p.
CAVALCANTI FJB, MACHADO SAM, HOSOKAWA RT AND CUNHA US. 2011. Comparação dos valores estimados por amostragem na caracterização da estrutura de uma área de floresta na Amazônia com as informações registradas no censo florestal. Arvore 35(5): 1061-1068. CONDIT R ET AL. 2000. Spatial patterns in the distribution of
tropical tree species. Science 288(5470): 1414-1418. CRAWLEY MJ. 1986. Plant Ecology. Blackwell Scientific
Publications, Oxford, 496 p.
DALE MRT. 1999. Spatial Pattern Analysis in Plant Ecology. Cambridge University Press, Cambridge, 340 p.
ESRI - ENVIRONMENTAL SYSTEMS RESEARCH INSTITUTE. 2016. Software ArcGIS desktop: version 10.3. Redlands: Environmental Systems Research Institute. HEINSDIJK D. 1965. Zero sampling units in forest inventories.
Rio de Janeiro, 54 p.
HIGUCHI N. 1987. Amostragem Sistemática Versus Amostragem Aleatória em Floresta Tropical Úmida. Acta Amaz 16/17: 393-400.
HIGUCHI N, SANTOS J AND JARDIM FCS. 1982. Tamanho de parcela amostral para inventários florestais. Acta Amaz 12(1): 91-103.
HOPKINS MJG. 2007. Modelling the known and unknown plant biodiversity of the Amazon Basin. J Biogeogr 34(8): 1400-1411.
HUSCH B, MILLER CI AND BEERS TW. 2002. Forest mensuration. 4th
. New York: J Wiley & Sons, 456 p. LEI Y, SHI J AND ZHAO T. 2012. Efficiency of adaptive
cluster sampling and traditional sampling for coastal mangrove in Hainan of China. J For Scienc 58(9): 381-390.
MATTEUCCI SD AND COLMA A. 1982. Metodologia para el estúdio de la vegetación. The General Secretarial of The Organization of American States, Washington, 168 p. MORISITA M. 1962. Id-index, a Measure of Dispersion of
Individuals. Res Popul Ecol 4: 1-7.
MOYA R, LEANDRO L AND MURILLO O. 2009. Wood characteristics of Terminalia amazonia, Vochysia guatemalensis and Hyeronima alchorneoides planted in Costa Rica. Bosques 30(2): 78-87.
MÜELLER-DOMBOIS D AND ELLENBERG H. 1974. Aims and methods of vegetation ecology. J Wiley & Sons, New York, 547 p.
ODUM EP AND BARRET GW. 2008. Fundamentos de Ecologia. CENGAGE Learning. São Paulo, 612 p. OLIVEIRA MM, HIGUCHI N, CELES CH AND HIGUCHI
FG. 2014. Tamanho e formas de parcelas para inventários florestais de espécies arbóreas na Amazônia Central. Cienc Florest 24(3): 645-653.
OLIVEIRA FILHO AT AND FONTES MAL. 2000. Patterns of floristic differentiation among Atlantic Forests in Southeastern Brazil and the influence of climate. Biotropica 32(4b): 793-810.
PÉLLICO NETTO S AND BRENA DA. 1997. Inventário florestal. Universidade Federal do Paraná, Curitiba, 316 p. PENNINGTON TD. 1981. Meliaceae. Flora Neotropica 28:
1-470.
PERES CA ET AL. 2003. Demographic threats to the sustainability of Brazil nut exploitation. Science 302(5653): 2112-2114.
PIANKA ER. 1994. Evolutionary Ecology. Harper Collins College Publishers, New York, 486 p.
PIELOU EC. 1969. An introduction to mathematical ecology. J Willy & Sons. Inc., New York, 286 p.
PIOTTO DF, MONTAGNINI L, UGALDE M AND KANNINEN M. 2003. Performance of forest plantations in small and medium sized farms in the Atlantic lowlands of Costa Rica. For Ecol Manage 175(1-3): 195-204. PLOTKIN JB, POTTS MD, LESLIE N, MANOKARAN N,
LAFRANKIE J AND ASHTON PS. 2000. Species-area curves, spatial aggregation, and habitat specialization in tropical forests. J Theor Biol 207(1): 81-99.
QUEIROZ WT, PÉLLICO NETTO S, VALENTE MDR AND PINHEIRO JG. 2011. Análise estrutural da unidade conglomerada cruz de malta na Floresta Nacional do Tapajós, estado do Pará, Brasil. Floresta 41(1): 9-18. R CORE TEAM. 2013. R: A language and environment for
statistical computing. Vienna: R Foundation for Statistical Computing.
ROESCH JR FA. 1993. Adaptive cluster sampling for forest inventories. Forest Sci 39(4): 655-669.
SALOMÃO RP. 2009. Densidade, estrutura e distribuição espacial de castanheira-do-brasil (Bertholletia excelsa
H. & B.) em dois platôs de floresta ombrófila densa na
Amazônia setentrional brasileira. Bol Mus Para Emilio Goeldi Cienc Nat 4(1): 11-25.
SEIDLER TG AND PLOTKIN JB. 2006. Seed dispersal and spatial pattern in tropical tree. PLoS Biol 4(11): 2132-2137.
SHANNON CE AND WEAVER W. 1949. The mathematical theory of communication. University of Illinois Press, Urbana, 117 p.
SILVERMAN B. 1986. Density Estimation for Statistics and Data Analysis. London: Chapman and Hall.
SIMPSON EH. 1949. Measurement of diversity. Nature 163: 688-688.
SOARES CPB, RODELLO CM, SOUZA AL, LEITE HG, SOARES OS AND SILVA GF. 2009. Comparação entre procedimentos de amostragem para espécies florestais raras e padrão de distribuição espacial agregado. Arvore 33(3): 545-553.
SVENNING JC. 1999. Microhabitat specialization in a species-rich palm community in Amazonian Ecuador. J Ecol 87(1): 55-65.
TALVITIE M, LEINO O AND HOLOPAINEN M. 2006. Inventory of sparse forest populations using adaptive cluster sampling. Silva Fenn 40(1): 101-108.
TASSIN J AND RIVIERE JN. 2003. Species richness altitudinal gradient of invasive plants on Reunion Island (Mascareigne archipelago, Indian Ocean). Rev Ecol Terre Vie 58: 257-270.
TER STEEGE H ET AL. 2013. Hyperdominance in the Amazonian Tree Flora. Science 342(6156): 324-334. THOMAS E, CAICEDO CA, LOO J AND KINDT R. 2014.
The distribution of the Brazil nut (Bertholletia excelsa) through time: from range contraction in glacial refugia, over human-mediated expansion, to anthropogenic climate change. Bol Mus Goeldi 9(2): 267-291.
THOMPSON SK. 1990. Adaptive Cluster Sampling. J Am Stat Assoc 85(412): 1050-1059.