Experimental investigation of damping force of twin tube shock
absorber
Sandip K. Kadu
1, Milind S. Mhaske
21
(Department of Mechanical engineering, PUNE University, India)
2
(Department of Mechanical engineering, PUNE University, India)
ABSTRACT
A shock absorber is a mechanical device to damp shock impulse and convert kinetic energy into thermal energy. The damping effect of shock absorber depends on damping force and damping force is affected by various process parameters. In this analysis three process parameters damping diameter(A), number of holes(B) and suspension velocity(C) were considered and their effect on damping force of shock absorber was studied and accordingly suitable orthogonal array was selected by taguchi method. Experiment conducted on servo hydraulic testing machine and after conducting experiments damping force was measured and with the help of S/N ratio, ANOVA, Regression analysis optimum parameter values can be obtained and confirmation experiments was carried out. Twin tube shock absorber was used to carry out experimentation.
Keywords
–
Twin tube shock absorber, Taguchi method, damping force, process parametersI.
INTRODUCTION
Shock absorber is used to absorbs or dissipate energy. In vehicle it reduces the effect of travelling over rough road. Leading to improved ride quality and increase in comfort due to reduced amplitude and disturbances.
Twin tube type shock absorber also known as a "two-tube" shock absorber, this device consists of two nested cylindrical tubes, an inner tube that is called the "working tube" or the "pressure tube", and an outer tube called the "reserve tube". At the bottom of the device on the inside is a compression valve or base valve. When the piston is forced up or down by bumps in the road, hydraulic fluid moves between different chambers via small holes or "orifices" in the piston and via the valve, converting the "shock".
Twin tube type shock absorber consists of two tube like inner tube and outer tube. Also, consists components like spring, piston, piston rod, retracting spring, piston plate, shims etc. Out of these components piston plate has holes called damping holes of different diameter which plays more important role in damping effect along with the suspension velocity. For achieving maximum damping force, optimisation is done by varying process parameters such as, A) Damping diameter B) Number of damping holes C) Suspension velocity by using L9 orthogonal array of Taguchi method. The objective of optimization of damping force is to provide ride comfort and driving safety for passenger.
In this paper test parameters was optimized for maximum damping force by taguchi method. It is
proved that signal to noise ratio is used to optimize various process parameters.[1][2][3]
II.
T
HEORY1. Elements of Twin tube rear shock absorber: Basically the shock absorber consists of a piston which moves up and down in a fluid-filled cylinder. The cylinder is fastened to the axle or, wheel suspension, and the piston is connected via the piston rod to the frame of' the vehicle. As the piston is forced to move with respect to the cylinder, a pressure differential is developed across the piston, causing the fluid to flow through orifices and valves in the piston. The portion of the cylinder above the piston is known as the rebound chamber, and the portion of the cylinder below the piston is known as the compression chamber. And the volume which surrounds the cylinder is known as the reservoir chamber. The reservoir chamber is partially filled with fluid and partially filled with a gas phase, normally air. The fluid flow between the compression and reservoir chambers passes through the body valve assembly at the bottom of the compression chamber shown in fig1.[4]
Fig 1. Elements of Twin tube rear shock absorber
1. Top Spring Cover.
2. Outer Cylinder-Reservoir tube. 3. Spring Adjuster.
4. Axle Eye.
5. Inner helical Spring-Helper Spring. 6. Outer Helical Spring-Main Spring. 7. Spring Supporter.
8. Spring Seat.
9. Inner Tube-Reservoir. 10. Piston-Assembly. 11. Chassis Eye. 12. Base Valve. 2. Experimental set up:
An experiment was carried out on servo hydraulic testing machine. The test system contains servo control system, signal acquisition system, function generator, security monitoring system, digital A/D interface system, servo valve driver and the twin-tube hydraulic shock absorber and so on.
Fig.2. Servo hydraulic testing machine The specific scheme of the testing is designed, as follows:
Clamping the shock absorber: The lower end of a shock absorber is vertically fixed to the hydraulic servo-platform the upper end is fastened to the rigid beam equipped with force sensor. The shock absorber is adjusted along the vertical direction to ensure that piston does not produce eccentric wear during loading process. Then the initial position of servo-console should be adjusted to ensure the piston locate in the middle of effective stroke.
Loading the shock absorber: The excitation frequency, amplitude and sampling frequency are all typed into computer. The driving signal of sinusoidal displacement is produced through a function generator. The signal is amplified by the digital A/D interface to make servo platform excite the shock absorber according to pre input frequency and amplitude.
Collecting the data: Because the excitation method is displacement driving, the displacement signal of the shock absorber piston can be directly obtained by pre-input signal and the damping force can be recorded through force sensor on rigid beam. [5]
. Experimental Details:
number of experiments is reduced. In this method, two important tools are used: (1) orthogonal array and (2) signal-to noise ratio. In this study we have consider 3 factors which affect majorly on quality characteristic such as (A) Damping Diameter, (B) Number of damping holes (C) Suspension velocity. The design of experiment was carried out by Taguchi methodology In this technique the main objective is to optimize damping force of rear suspension that is influenced by various process parameters.
2) Selection of control factors: As damping force has adverse effect on riding comfort, driving safety and vehicle stability. So the damping force was considered as a response parameter for experimentation.
3)Selection of orthogonal array:An orthogonal array for process design is applied on the knowledge of control factors and levels. The number of experiments can be reduced using orthogonal array In this study, L9 orthogonal array have been selected This orthogonal array has three columns and nine experiment Since 3 controllable factors and three levels of each factor were considered L9 (3**3) Orthogonal Array was selected for this study.
4) Process parameters: Twin tube shock absorber of two wheeler selected for experimentation. The experiments were carried out on Servo Hydraulic test system for damping force testing. There are three input controlling factors selected as different damping diameter, different number of holes and different suspension velocity having three levels. Details of parameters and their levels used shown in the table1
Table 1. Process parameters and levels A Damping Dia.(mm) 1.8 1.9 2.0 B No. of damping holes 4 6 8 C S-Velocity(m/s) 0.3 0.5 1
Table 2. Layout for experimental design Expt.
No.
A B C Result (Damping
Force) N 1 1.8 4 0.3 400 2 1.8 5 0.5 500
3 1.8 6 1 600
4 1.9 4 0.5 500
5 1.9 5 1 650
6 1.9 6 0.3 350
7 2 4 1 600
8 2 5 0.3 300
9 2 6 0.5 450
III.
R
ESULT AND DISCUSSIONS1. S/N Ratio Analysis:
Signal-to-noise (S/N) ratio is then derived from the loss function. There are three types of S/N ratios depending upon type of characteristics Lower is better (LB), nominal is best (NB), higher is better (HB). In vehicle suspension system higher damping force be as a sign of better ride quality. Therefore
“HB” is chosen for the damping force and it is calculated as the logarithmic transformation of the loss function as shown below. With the S/N and ANOVA analyses, the optimal combination of the process parameters can be predicted.
In this study, in order to minimize the defects, higher is better S/N ratio is chosen. Higher is better S/N ratios are computed, and the values are recorded.
………(1)
Where, n= number of repetitions or observations yi = the observed data.
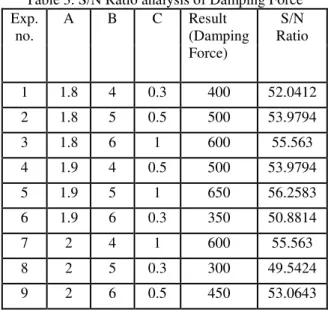
Table 3. S/N Ratio analysis of Damping Force Exp.
no.
A B C Result (Damping Force)
S/N Ratio
1 1.8 4 0.3 400 52.0412 2 1.8 5 0.5 500 53.9794 3 1.8 6 1 600 55.563 4 1.9 4 0.5 500 53.9794 5 1.9 5 1 650 56.2583 6 1.9 6 0.3 350 50.8814 7 2 4 1 600 55.563 8 2 5 0.3 300 49.5424 9 2 6 0.5 450 53.0643
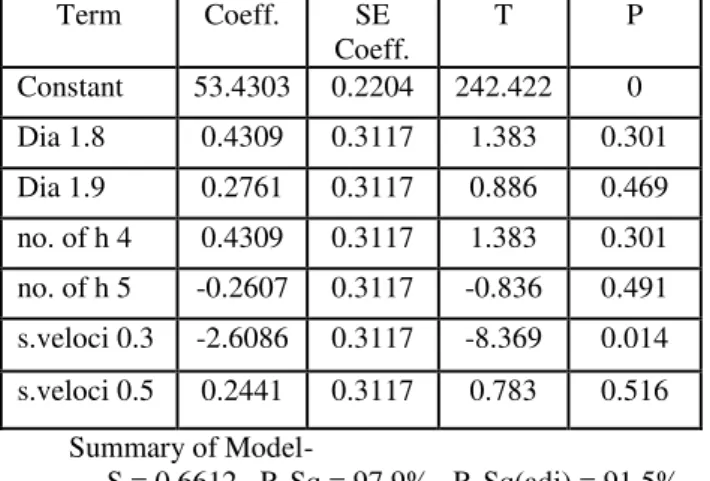
Table 4. Estimated model coefficient for S/N Ratio Term Coeff. SE
Coeff.
T P
Constant 53.4303 0.2204 242.422 0 Dia 1.8 0.4309 0.3117 1.383 0.301 Dia 1.9 0.2761 0.3117 0.886 0.469 no. of h 4 0.4309 0.3117 1.383 0.301 no. of h 5 -0.2607 0.3117 -0.836 0.491 s.veloci 0.3 -2.6086 0.3117 -8.369 0.014 s.veloci 0.5 0.2441 0.3117 0.783 0.516
Summary of Model-
S = 0.6612 R-Sq = 97.9% R-Sq(adj) = 91.5%
Table 5. Response table for signal to noise ratio larger the better
Level Diameter (mm)
No. of hole
Suspension velocity 1 53.86 53.86 50.82 2 53.71 53.17 53.67 3 52.72 53.26 55.79 Delta 1.14 0.69 4.97
Rank 2 3 1
2.Analysis of Variance (ANOVA):
ANOVA is objective decision making for determining the average performance of group of parameter tested and it is helpful in determining the significance of all parameters.
The analysis of variance was used to identify the important input parameters which effects Damping force. Once the experiment has been conducted, the ANOVA is carried out using the results of the experiments by making use of minitab14 software. The significant factors in the shock absorber defects were determined. The analysis of the experimental data is carried out using the software MINITAB 14 specially used for design of experiment applications. In order to find out statistical Significance of various factors like damping diameter (A), number of holes (B), and suspension velocity (C), and their interactions on damping force, analysis of variance (ANOVA) is performed on experimental data.
Table 6. Analysis of variance for S/N Ratios Source DF Seq
SS
Adj SS
Adj MS
F P
A 2 2.2855 2.2855 1.1427 2.61 0.277 B 2 0.848 0.848 0.424 0.97 0.508 C 2 37.366 37.366 18.683 42.7 0.023
Error 2 0.8744 0.8744 0.4372
Total 8 41.374
The results of ANOVA are shown in table 6 it is clear that the parameters A, C, and D significantly affect the damping force.
Larger F- value indicates that the variation of process parameters makes a big change on the performance. The last column of the table shows that p-value for the individual control factors. Smaller the p-value, greater the significance of the parameter. The ANOVA table for S/N ratio (Table 6) indicate that, the damping diameter (p=0.277), Number of hole (p= 0.508) and suspension velocity (p=0.023) in this order, are significant control factors affecting damping force. It means, the suspension velocity is the most significant factor followed by damping diameter and number of holes.
Percent contribution(P) to the total sum of square can be used to evaluate the importance of a change in the process parameter on these quality characteristics.
(P)=(SS’A/SST)*100……….(2)
Table 7. Optimum condition and Percentage contribution
Sr. Factors Level Description
Level Contribution
No. (%)
1 A: Damping Dia.
1.9 2 5.52
2 B: No. of Hole
5 3 2.04
3 C:
Suspension Velocity
3. Regression analysis:
The regression equation generated by minitab14 software is,
Y=826-250*A-16.7*B+359*C ………(3)
Where, Y is the response in terms of damping force and A, B, C is input parameters.
S = 42.5923 R-Sq = 92.1% R-Sq (adj) = 87.4% If we put optimum parameters which are drawn by ANOVA in equation 1 it will give optimum value of quality characteristic which will maximum Damping force.
Y = 826 - 250*A - 16.7*B + 359*C Y = 826 - 250*1.9 - 16.7*5 + 359*1
Y = 626.5 N predicted by regression equation.
4. Confirmation of Result:
Confirmation experiments were carried out on optimal parameters that are A2B2C3 by setting up three trials. The results shown by experimented evaluation and predicted by regression equation with error of 1.08% which less than 5%. Hence this mathematical model is feasible and effective.
IV.
C
ONCLUSIONIt is found that taguchi method of parameter design can be performed with minimum number of experimentations and it provides simple, efficient, systematic methodology for optimizing the process parameters. The Taguchi method was applied to find an optimum setting of the damping force parameters
process. The result from the Taguchi method chooses an optimum solution from combinations of factors The results are summarized as follows:
Parameters like damping diameter, number of holes and suspension velocity are selected for maximization of damping force.
The largest impact on the characteristics of the damping force is from parameters like suspension velocity followed by damping diameter, number of holes.
From results we come to conclusion that damping diameter at level 2, the number of holes at level 2, suspension velocity at level 3 is recommended for maximization of damping force.
The results of confirmation experiment well satisfied with optimal setting.
The result of present investigation is valid within specified range of process parameters.
Also the prediction made by Regression Analysis is in good agreement with Confirmation results.
The optimal levels of Damping force process parameters for optimum damping force are:
Parameters Optimum value Damping Diameter (mm) 1.9
Number of Hole 5 Suspension Velocity
(m/s) 1
R
EFERENCESJournal Papers:
[1] Arokiasamy Mariajayaprakash, Thiyagarajan Senthilvelan and Krishnapillai Ponnambal
Vivekananthan,” Optimisation of shock
absorber process parameters using failure mode and effect analysis and genetic
algorithm”, International Journal of Industrial Engineering 2013
[2] Hashmi Ayas Jameel Ahmed, Rathi M.G.,
“Analysis of damping force of two wheeler front suspension”, International Journal of Engineering Research & Technology (IJERT) ISSN: 2278-0181 Vol. 2 Issue 6 (2013) 428-434.
[3] J .C.Dixon, Shock Absorber Handbook, john wiley and sons.
[4] Choon-Tae Leea, Byung-Young Moon,
“Simulation and experimental validation of
vehicle dynamic characteristics for displacement-sensitive shock absorber using fluid-flow modeling” Mechanical Systems and Signal Processing 20 (2006) 373– 388.(elements of shock absorber)
error 2%
B: 2%
A: 6%
C:90.31 % Pie Chart
1 2 3 4
Obs.
Trial
Avg. damping force (N)
S/N Ratio 1 2 3 Expe. Predi.
% Error
[5] Yongijie Lu, Shaohua Li, Na Chen, “ Research on damping Charecteristics of
shock absorber for heavy vehicle”, Reaserch journal of applied sciences, engineering and technology 5(3): 842-847, 2013.(Test rig)
[6] Rama Rao. S, Padmanabhan Application of Taguchi methods and ANOVA in optimization of process parameters for metal removal rate in electrochemical machining of
Al/5%SiC composites”, International Journal of Engineering Research and Applications (IJERA) ISSN: 2248-9622 Vol. 2, Issue 3, May-Jun 2012, pp. 192-197
[7] P.Senthil kumar, R.Kalidas, K.Sivakumar,
E.Hariharan, B.Gautham,“Application of
Taguchi method for
optimizingpassenger-friendly vehicle suspension system”, International Journal of Latest Trends in Engineering and Technology (IJLTET), Vol. 2
[8] Douglas C.Montgomery , Design and Analysis of Experiments pp 393
[9] Taguchi G, Konishi S. Taguchi methods, orthogonal arrays and linear graphs, tools for quality American supplier institute. American Supplier Institute; (1987) 8–35.
[10] M.A.Jadhav, S.B.Belkar, R.R.kharde,
“Analysis of Displacement Sensitive Twin Tube Shock Absorber”International Journal of Engineering Research and Development, Volume 5, Issue 5 (2012) 31-41.
[11] Keith Wordena, DarylHickey, et.al,
“Nonlinear system identification of automotive dampers: A time and