SAGE Open April-June 2015: 1 –15 © The Author(s) 2015 DOI: 10.1177/2158244015581187 sgo.sagepub.com
Creative Commons CC BY: This article is distributed under the terms of the Creative Commons Attribution 3.0 License
(http://www.creativecommons.org/licenses/by/3.0/) which permits any use, reproduction and distribution of the work without further permission provided the original work is attributed as specified on the SAGE and Open Access page (http://www.uk.sagepub.com/aboutus/openaccess.htm). Article
Introduction
Since the late 1960s, equitable K-12 school funding has been pursued through litigation in most states of the Union. As of 2009, only five states have not been involved in a court dis-pute over the equity of their school finance formulas: Delaware, Hawaii, Mississippi, Nevada, and Utah (National Center for Educational Statistics, 2009). One of those states, Mississippi, deterred litigation through the passage of the Mississippi Adequate Education Program (MAEP) in the 1994 state legislative session (Augenblick & Myers, 1993). However, Mississippi’s funding formula has been fraught with disparity and discord. To understand how MAEP has traversed this difficult trek, a closer look at the historical backdrop of the creation of MAEP and preceding funding formulas is necessary.
National Legislative and Litigious Review
From the nation’s early formative years through the mid-1800s, the United States was divided into four geographical regions: New England, the Mid-Atlantic States, the South, and the frontier. Although the economy of each region was based on different commodities, from manufacturing and seaports to agriculture and livestock, education in all four regions came at a high cost even for the select population
who could afford it (Tozer, Senese, & Violas, 2008). Males and females could attend grammar school, yet the rationale for each was different. Males were to be educated for busi-ness purposes whereas females were educated to take care of the home. Males also had the opportunity to go to college if their families could afford the cost.
Funding for K-12 education across the nation in the early 1800s was consigned to local governments to provide reve-nue through taxation, individual tuition payments, private donations, and Sixteenth Section land leases. In the late 1800s and into the early 1900s, urban populations grew at such an exponential rate that some local government entities raised enough funding to build brick buildings, pay consis-tent wages to the teachers, and keep the schools open for more than 6 months of the year. In 1853, the first sales tax in the nation to fund K-12 education was enacted in the state of California, and the allocation of these funds came to be known as flat grants (Monroe, 1911-1913). Flat grants were
1
Western Kentucky University, Bowling Green, USA 2
Delta State University, Cleveland, MS, USA
Corresponding Author:
Michael Putnam, Western Kentucky University, 3079 Gary Ransdell Hall, Bowling Green, KY 42101, USA.
Email: [email protected]
Mississippi: One State’s Search for Equity
in School Finance
Michael Putnam
1and Jill Cabrera
2Abstract
The funding mechanism for the public schools in the state of Mississippi had been surprisingly stable for a number of years. The funding formula existed in its same form for over a half century before it was substantially changed in 1994 when the Mississippi Adequate Education Program (MAEP) legislation was passed. This is the first external analysis of the MAEP since its inception. An analysis of the horizontal equity is undertaken to determine the state of equality between districts in the state. Vertical equity is examined to determine if disparity exists between unequal circumstances of school districts. In addition, the federal range ratio is scrutinized for appropriate variances between the highest funded school districts and their counterparts in the state of Mississippi. Although this study shows gains in horizontal equity, it reveals a weakening of vertical equity. In combination, more funding is available per student overall, but school districts are not receiving sufficient funds to equitably educate children with specific needs, such as living in an area with extremely low socioeconomic conditions. Results of this research strongly suggest Mississippi will continue to languish in academic achievement until MAEP is fully funded on a consistent basis.
Keywords
equal amounts of funding a state would allocate to each of that state’s school districts without regard to district size or wealth; and, over the years, the flat grants came to be paid to districts more as a legislative, political process than as true funding streams (Springer, Houck, & Guthrie, 2008).
As early as the 1900s, litigation over K-12 education funding began appearing in state courts across the nation. Some of the early pivotal cases pertaining to funding educa-tion, shown in Table 1, have significant implications for the current discussion. Education reformists believed flat grants were an ineffectual method of funding K-12 education due to political posturing and manipulations. The equality of educa-tion was being deterred due to the political influence in fund-ing of school districts. One such case, Sawyer v. Gilmore
(1912), tried in the Maine Supreme Court, was one of the first state landmark cases over flat grants. Education reform-ists argued the funding of schools through political flat grants was detrimental to the education of children from less politi-cally influential school districts. The Maine Supreme Court decreed school finance was the responsibility of a state’s leg-islature and therefore should not be tried in the court system. Across the nation, state legislators began searching for a more equal method of financing K-12 education. In 1923, George Strayer and Robert Haig created the Strayer–Haig education funding formula for K-12 education in an attempt to settle court disputes over flat grants between school dis-tricts and school reformists. Utilizing a foundation formula that requires a state to provide a base-per-pupil allocation to school districts and further requires local governments to contribute a portion of their local taxes to the overall allo-cated state education budget, the state could then equally dis-burse a determinate amount of money per pupil to each of a state’s school districts. This formula thus provided a basic form of equity for every school child in the state utilizing foundational funding (Springer et al., 2008). Because there was no scientific method of determining the actual cost of equitably educating children, the process of determining the base cost-per-pupil eventually became a product of the polit-ical machinery, and the minimum dollar amount that could be allocated to education became the preferred funding strat-egy (Augenblick & Myers, 1993). The Strayer–Haig educa-tional funding formula became one of the preferred methods for satisfying litigation. However, some states continued to rely on the local government methodology of financing education.
The Brown v. Board decision in 1954 established all persons held the right to be treated as equals. Education reformists used
this federal court case to begin litigation in multiple states for the equal education of all children. One of the earliest land-mark cases was the 1971 Serrano v. Priest decision. In this case, the State of California Supreme Court ruled the finance system California used at the time unconstitutional, and the Proposition One ruling came into being. Proposition One stated a school district’s funding could not be a function of the district’s individual wealth, and all school districts must contribute the majority portion of their ad valorem taxes to the state to be redistributed to all school districts in the said state. Educational researchers labeled this type of equity fis-cal neutrality. The basis of fisfis-cal neutrality begins with hori-zontal equity and adds the supposition that we should account for the equal treatment of unequals utilizing vertical equity through a system of add-ons or weights when creating fund-ing for schools.
In 1973, another landmark ruling was handed down in Texas. A federal court, in the San Antonio School District v. Rodriguez ruling, held that litigation of school education funding could no longer be heard in a federal court because public education was not a right provided by the United States Constitution. In effect, this ruling forever shifted all further litigation over school funding back to state courts. All states have embedded in their constitutions a provision estab-lishing the necessity to provide some form of equality in edu-cation (Baker & Green, 2008). Thus, the stage was set for the next 20 years to move from the theory of equality to the search for equity in K-12 education budgets (Putnam, 2011).
In the text, The Measurement of Equity in School Finance
(1984), Robert Berne and Leanna Stiefel examine several equity components among which are horizontal equity and vertical equity. Furthermore, Berne and Stiefel (1984) describe the methodological procedures necessary to mea-sure and create equitable funding solutions for states’ inter-district allocations and intrainter-district allocations.
The most prevalent and recognized form of equity is hori-zontal equity. Berne and Stiefel (1984) refer to horihori-zontal equity as the equal treatment of equals. Horizontal equity requires resources be equally available to all students across a state. Horizontal equity also is blind to the unequal needs of students. Its premise is all students are similar and will be treated equally, and allocations will then be given in an equal per-pupil base to school districts. Baker and Green (2008) typify horizontal equity as a minimal rule of fairness because it does not take into account any differences in student needs or district wealth. Typically, a state would determine a flat grant approach to allocations for school districts, and state legislative bodies would approve or modify the base-per-pupil funding amounts going to all districts regardless of dis-trict size, wealth, student needs, or geographical location.
Vertical equity is perhaps one of the more controversial forms of equity. Due to the inherent nature of vertical equity, it is more difficult to determine where the limit of vertical equity should be and whether it can ever be truly attained. Derived from a progressive tax philosophy system, vertical equity quickly becomes a matter of political debate when a
Table 1. Pivotal Educational Finance Court Cases Between 1912
and 1973.
Brown v. Board of Education of Topeka, 347 U.S. 483 (1954).
San Antonio School District v. Rodriguez, 411 U.S. 1, 93 S Ct. 1278, 36L. Ed.2d 16 (1973).
Sawyer v. Gilmore, 83 A. 673 (me. 1912).
state attempts implementation (Baker & Green, 2008). In definitional terms, vertical equity takes on the appearance of horizontal equity and makes the addition of the unequal treat-ment of unequals. Vertical equity enables states to fund unequally those districts which are in unequal circumstances. The essence of vertical equity is the idea that students who need significantly more to attain the same achievement level will receive whatever significantly more means to achieve those equal outcomes (Baker & Green, 2008). As one exam-ple, a district with a high population of students with special needs, in this case low socioeconomic status (SES), would need greater state funding per pupil than a high wealth district with a low population of students with special needs, here again low SES. The necessary appropriateness of vertical equity is difficult to ascertain because the meaning of vertical equity differs in relation to the states attempting to apply it.
Statement of the Problem and Purpose
of the Study
Governors and state legislators nationwide have made equi-table funding a premier portion of their educational initia-tives (Ko, 2006). With revenues falling drastically in recent years, state legislators are having difficulty finding other areas of their state’s budget to cut further without cuts in funding for PK-12 education. Historically, state budget cuts in Mississippi take place in the middle of a fiscal year (FY), which leaves superintendents hastily attempting to under-stand, plan, and implement budget cuts within their own local school district. Equity formulas are driving educational leaders in the decisions they are making in terms of what can be afforded to educate all students.
Budget cuts and political maneuvering require a review of the MAEP. To date, the only studies on record are state requested reports written by the original consulting firm hired by the state of Mississippi to create the funding pro-gram and a state legislature subcommittee Performance Evaluation and Expenditure Review (PEER) written for the FY 2003 Mississippi legislative session. There has not been an independent, comprehensive study of the current equity provided by the MAEP in relation to the intended horizontal equity developed into the original formula.
The purpose of this quantitative study is to conduct an analysis of the level of the equity of the MAEP funding for-mula through an analysis of the base-per-pupil per district allocation system. Quantitative statistical analysis will be used to determine the level of equity of the current funding system in relation to the level of equity the program was intended to have when the formula was passed into law.
The impetus to provide an equitable education for students brings forth the question of whether the funding formulas are still equitable. Examining one case study—Mississippi—pro-vides an in-depth analysis of the alignment between the intent of funding formula in theory and the actual funding provisions in practice. The present study provides a model for examining
Mississippi’s funding formula and research-based findings to inform legislators and educators in the state. In addition, the study provides a thorough model for analyzing funding for-mulas, which could be utilized or adapted for research on funding formulas in other states.
Research Question
The main question driving this study is whether the MAEP continue to be true to the equity premise first involved in its design in 1993. To answer this question, the following con-siderations must be addressed:
Research Question 1. Does MAEP meet the criteria for horizontal equity?
Research Question 2. Does MAEP meet the criteria for vertical equity?
Research Question 3. Does MAEP meet the criteria for fiscal neutrality?
Research Question 4. Does the current funding meet the level of horizontal equity (range, federal range, standard deviation, coefficient of variance [CV]) as was intended in its original design?
Mississippi Legislative Review
Similar to most states, Mississippi, prior to 1821, funded K-12 education through local efforts, which included Sixteenth Section land leases, private donations, and indi-vidual tuition payments. With the opening of the Franklin Academy for Boys in Columbus, the state of Mississippi began the journey toward the funding of K-12 education. Franklin Academy was the only school in the state whose funding came solely from state dollars (Jackson State University, Department of History and Philosophy, 2010). The Mississippi Constitution was drafted in 1868, and provi-sion was made for “a uniform system of free public schools, by taxation or otherwise, for all children between the ages of five and twenty-one years . . .” (Commission, 2005, p. 18). The Mississippi Constitution further stipulated that the fund-ing for K-12 education was to be from several local revenue streams, in particular Sixteenth Section land leases, a tax on alcohol beverages, military exemption fees, public and pri-vate donations, a poll tax of two dollars per person, and local taxes as needed.
When soldiers began to return home after World War II, education became a matter of national urgency. Due to com-petition in the workforce, a more mechanized industry, and scientific innovations, reading and mathematical skills were quickly becoming indispensable to employers and employ-ees alike (Tozer et al., 2008). K-12 education in Mississippi became a poster child of the ills in education for the news media. The February 8, 1953, edition of the New York Times
Schools of Nation; Big Deficiencies Burden Schools,” writ-ten by Benjamin Fine (1953), expounded on the large num-ber of Mississippi teachers who were ill-trained to educate students, the high level of illiteracy and corresponding low graduation rates of Mississippi students, and the miserable condition of its school buildings.
Mississippi Governor Hugh White immediately gave the executive order for the creation of an education task force to give recommendations to solve the K-12 education problems Fine had exposed. In the same year, 1953, this task force rec-ommended and the Mississippi state legislature enacted into law a new education funding initiative identified as the Minimum Education Program (MEP), which was a modified Strayer–Haig formula.
The state of Mississippi modified the Strayer–Haig for-mula by requiring local school districts to deliver a prorated assessment totaling 3% of the state’s education budget. The formula was driven by an average daily attendance (ADA) weighting system. The MEP formula specifically identified the number of teachers for which a district would receive funding. If a district felt more teachers were needed than MEP would supply, the district could compensate those teachers utilizing its local revenues. Thus, overnight, the state had substantially altered its stance on the state funding of Mississippi’s school districts by funding all teachers iden-tified through the ADA weighting system. However, MEP did not account for the residential size and wealth of a dis-trict, the geographical adversity of a disdis-trict, the SES of a district’s students, or the needs of the community within a school district. Because MEP guaranteed a base-per-pupil allocation predicated on a district’s ADA and for the exclu-sive funding of teachers for the district based on those ADA numbers, school districts had to determine how to build new buildings, athletic facilities, provide transportation, and pro-vide funding for support staff solely through local ad valorem taxation. In a rudimentary sense, the Mississippi Education Program represented a form of equity known as horizontal equity. This type of equity funds all students equally, but fails to recognize some students and districts require more fund-ing due to extraneous circumstances. Horizontal equity funds education in a uniform base-cost-per-pupil allocation which, although essentially fair, does not reduce the funding dispari-ties between intrastate school districts to educate low SES children, or nearly the same, as their student counterparts in wealthier school districts (Downes & Stiefel, 2008).
In the early 1990s, as litigation over K-12 education equity funding continued to advance through the states, leg-islators in the state of Mississippi foresaw the inevitable liti-gation over what was fast becoming seen as an inherent flaw in the MEP formula (Augenblick & Myers, 1993). The MEP provided no form of vertical equity. Court systems were demanding equal treatment for unequals in other state rul-ings, which Mississippi legislators recognized was not designed into MEP.
Mississippi State Senator, and Chair of the Senate Education Committee, Ronnie Musgrove, was the driving force behind
the creation of the Task Force on Restructuring the MEP in 1993. The task force was charged with submitting an alterna-tive approach to MEP. The committee did not want to move away from the foundation funding program currently in use, but the task force did want to see more dollars being allo-cated to those students and school districts that were in less equal circumstances (Augenblick & Myers, 1993). The task force immediately hired the consulting firm of Augenblick, Van de Water & Myers of Denver, Colorado, to create the design of the new funding formula, create a computer model that would calculate the budget each year, and present the proposal to the Education Committee.
The task force presented its proposal to the Senate Education Committee on December 15, 1993. The commit-tee named the formula the “Mississippi Adequate Education Program” and submitted the new program to the 1994 Mississippi state legislative session for immediate approval. The Mississippi legislators approved the bill and sent it to then-governor Kirk Fordice who vetoed the bill. Documentation reveals Governor Fordice did not believe the state of Mississippi could afford the new funding formula and requested another study be conducted (Mississippi Parent’s Campaign, 2010). The Mississippi state legislative body successfully held a veto-override vote, and the MAEP was passed into law. The state legislators understood that the revenues necessary to pay for the new funding program were not readily available, and the program and its funding modal-ities would have to be phased in to allow the state financial coffers to be adequate enough to pay for the increased educa-tion budget. Therefore, both MEP and MAEP would be funded simultaneously from FY 1997 to FY 2002 when MAEP would be fully funded and MEP would cease to exist. The MAEP funding began in FY 1997 with a funding level of 9.4%, FY 1998—20%, FY 1999—40%, FY 2000—60%, FY 2001—80%, and full funding of MAEP in FY 2002. The new program funds were initially given to school districts to use for capital improvements, pay off of existing debt, equipping physical plants, or enlarging school buildings (Commission, 2005).
The MAEP not only gave school districts more funds, but it also allowed school districts the flexibility necessary to expend the funds as needed in individual districts. The state would no longer mandate how many teachers a district may hire, and districts no longer had to expend their local funds on extra teachers, buildings, or otherwise unless they felt it necessary.
MAEP Funding Dynamics
at the writing of this article. The formula generates a base-per-student allocation to every school district in the state of Mississippi which provides horizontal equity. Vertical equity is funded through categorical add-ons, and a form of fiscal neutrality is embedded in the formula so as not to punish school districts for having either a low or extremely high level of local wealth in their respective community (Putnam, 2011). The aggregate funding formula for MAEP is as fol-lows (Commission, 2005):
Base Student Cost District ADA At-Risk Student Add-On
Adeq
× +
=
u
uate Education Program Cost Local Contribution Basic Prog
− =
rram Cost Add-Ons State Program Cost.
+ =
The MAEP formula has set criteria for determining the base student cost. A sampling of school districts meeting the state-mandated criteria will be used as a guide for determin-ing the base-per-pupil calculations. First, a district must meet the academic standards to be labeled Successful by the Mississippi Department of Education (MDE). Calculations of the instructional, administrative, operations, and ancillary costs for each Successful district are used to develop means and standard deviations for funding purposes. To be selected as a qualifying school district, the costs must be no more than one standard deviation above and no less than two standard deviations below the mean for the cost component (Commission, 2005). Once this group of school districts has been formed, the MDE will calculate the mean allocation of each category, sum the means, and determine the average to establish the base-per-pupil cost as shown by the following flowchart (Joint Legislative Committee on PEER, 2002; see Figure 1).
In essence, MAEP is designed to be a practical, dynamic formula. Mississippi statute requires the reevaluation of the program and formula after every Mississippi gubernatorial election (Senate Bill 2731 of 2005). Since the inception of the formula in 1997, there have been three studies of the MAEP. Two studies, which were conducted due to govern-mental regulations, are the 2002 Joint Legislative Committee on PEER and the Commission on Restructuring the Mississippi Adequate Reform Program (Commission, 2005). There was no apparent study undertaken in 2010, therefore spawning the need for independent assessment. In 2011, an independent study for a dissertation titled Equity in Mississippi: A Study of Public School Funding (Putnam, 2011) was conducted at the University of Mississippi.
The 2002 PEER study reflects that the MAEP delivered adequate funding for children across the state of Mississippi. The study also recommended a form of efficiency screening to discover the most effective use of funds allocated to dis-tricts to achieve the goals of the schools. In a memo dated
November 21, 2002, the MDE Director of the Office of Educational Accountability outlined how cost prohibitive an efficiency screening would be to implement (Joint Legislative Committee on PEER, 2002). However, the MDE did hire the consulting firm of Augenblick, Palaich and Associates
Figure 1. Base cost formula.
(APA), the consulting firm which created MAEP and was formerly known as Augenblick, Van de Water & Myers, to study the costs and methods of implementation of an effi-ciency screen.
The APA firm delivered the model for an efficiency screen on May 29, 2004. This screen would be based on numbers of teachers a district has employed per 1,000 students enrolled, the number of administrators per 1,000 teachers, the number of custodians per 100,000 square feet, and the number of counselors and librarians per 1,000 students. The mean for all Successful districts would be calculated and those values which were no more than one standard deviations above or two standard deviations below the mean were used in the calculations for efficiency (APA, 2004). However, the effi-ciency screen was not put into effect at that time.
In July 2005, Mississippi Governor Haley Barbour cre-ated the Commission on Restructuring the MAEP. The final report was to include efficiency, local contributions, a cost analysis of the base formula, and the method of determining Successful school status. The Commission hired the firm APA to study and provide a recommendation on each compo-nent. In October 2005, APA reported their findings to the Commission, and on January 18, 2006, the Commission reported its findings to the Mississippi legislature. The rec-ommendations for the definition of the term Successful and an efficiency screen, as were determined in the 2004 study by APA, were immediately approved by the state legislature and signed into law by the governor. Three additional recom-mendations given to the legislature were not approved.
The first recommendation not approved would have pro-vided a second tier of funding for school districts with sub-stantial numbers of students of low SES. This funding would have provided more fiscal neutrality and made the wealth of an individual district less impactful when providing alloca-tions to school districts. The second recommendation failing to achieve approval was an adjustment to the at-risk compo-nent. MAEP currently provides a level equal to 5% of alloca-tions to a given school district for their at-risk students, which is one of the lowest funding percentages in the nation. The real cost of serving these children ranges from 50% to 100% more than the state of Mississippi currently funds (Commission, 2005). The third recommendation not approved was the request to incorporate all federally recognized cate-gorical add-on components into the formula itself. Mississippi has funded transportation, special education, gifted educa-tion, vocational educaeduca-tion, alternative educaeduca-tion, and capital outlay. Since the phase-in program was completed in 2002, the state of Mississippi no longer funds capital outlay for school districts. MAEP has never funded the balance of cate-gorical add-ons, specifically, class-size reduction, bilingual education, early childhood education, and technology since its inception. Thus, the formula could provide greater verti-cal equity and educational adequacy for the children of the state of Mississippi.
Throughout these lengthy studies, some legislators believed the MDE’s MAEP budgetary requests were larger than the formula required. Indeed, from FY 2002 until FY 2010, the state legislature fully funded MAEP only 4 of its 8 years of existence. Even then, 2 of those 4 years saw midyear budget reductions due to lower than anticipated state reve-nues. Embedded in the Scope and Purpose section of the PEER review was a request for oversight of the budgetary process (Joint Legislative Committee on PEER, 2002). Governor Barbour, in the 2006 legislative session, added the language that stipulated an independent source must verify the MAEP calculations of the MDE each FY before the bud-get goes to the Office of the State Auditor (OSA). The MDE hired an external accounting firm to perform the independent calculations as required by Mississippi statute.
Internal memos from the State Auditor, Stacey Pickering, to the governor of Mississippi, the lieutenant governor, the speaker of the House of Representatives, the chairman of the Senate Education Committee, the chairman of the House Education Committee, the chairman of the Senate Appropriations Committee, the chairman of the House Appropriations Committee, and the Legislative Budget Office, dated March 13, 2008, and January 14, 2009, respec-tively, reported the budgetary calculations for FY 2009 and FY 2010 were flawed. Although the memos went on to clear the independent firm of error due to miscalculations by the MDE, the auditor goes further to state the budget was indeed overinflated and would continue to increase if immediate corrections were not implemented. State Auditor Pickering continued by stating the MDE and the OSA should have legal latitude to make corrections as errors are detected. Pickering further stated that although his memos were meant only for the parties specifically addressed to in his letters, he realized these are public documents and their “distribution is not limited” (Pickering, 2008, 2009).
Method
A third and independent study, this doctoral research was conducted to ascertain whether MAEP maintained the equity intended in the original 1993 formula despite recent budget cuts as a result of lower than normal tax revenue. The state of Mississippi has a statute embedded in Mississippi Code, Section 37-151, which requires the Mississippi legislature to fully fund MAEP each year; however, the statute does not prohibit the state legislature or the governor from cutting the budget midyear if tax revenues fall below projected levels.
Research Design
Population and Sample
For the study, the MAEP district allocations for FY 2004 and FY 2010 garnered from the MDE are examined. Thus, the quantitative target population for this study will be the MAEP allocations budgeted to Mississippi school districts, and the total population is the 152 school districts of Mississippi. Because the entire population of districts will be used, the N
count will be 152 and there will be no sample.
Instruments
The original calculations used to determine horizontal equity in the MAEP were range, federal range ratio (FRR), and CV (Augenblick & Myers, 1993). This study utilizes the same procedure to determine if the equity originally intended in the 1993 proposal exists in the current FY 2010 allocation. The FY 2004 and the FY 2010 budget allocations garnered from the MDE are the data sets used to determine the equity in range, FRR, and the CV.
Research Questions
The following research questions guide this study:
Research Question 1. Does MAEP meet the criteria for horizontal equity?
Research Question 2. Does MAEP meet the criteria for vertical equity?
Research Question 3. Does MAEP meet the criteria for fiscal neutrality?
Research Question 4. Does MAEP meet the criteria for horizontal equity (range, federal range, standard deviation, and CV as was intended in its original design?
Data Analysis
The first, second, and third questions will be analyzed using a criterion rubric as seen in Table 2. The researcher created the checklist from research compilations of the necessary components to accomplish the goals to attain these forms of equity as defined by Picus, Goertz, and Odden (2008) as well as Rubenstein and Sjoquist (2003).
The fourth question uses a three-step process for analysis. Although there are many formulas written by many research-ers to determine equity, the researcher has chosen to replicate the formulas used by Bennett (2003), which are based on the Business Statistical Analysis Software (SAS) because these are finance formulas. The formulas for the Pearson Product– Moment Correlation and Correlation of Determination are compatible with the SPSS when transformed to a Fisher’s z
formula as illustrated in the SPSS Survival Manual (Pallant, 2007). The “r” contained in the SPSS package must be changed to the “z” formula due to the nature of the business data.
Horizontal Equity
The calculations used to determine intended horizontal equity by Augenblick and Myers in 1993 were range, FRR (derived from restricted range), and the CV. The statistical notations are as follows:
X, average equity per pupil;
Xi, average equity per pupil in a given district i; Xp, mean equity per pupil for all pupils in a state; Xi(P95), equity per pupil at the 95th percentile;
Xi(P5), equity per pupil at the fifth percentile;
n, number of districts.
Range is the measurement of the difference between the highest and lowest per-pupil allocation to the school districts. The allocations are ranked in descending order from highest to lowest. Typically, the greater the range, the greater the funding inequity is within a given state. This is the least accurate measure of equity (Bennett, 2003; Ko, 2006). Range will be calculated using the formula:
Range= Xi
(
Max)
−Xi(
Min)
.FRR was designed to incorporate range and restricted range into a less sensitive model of equity. The restricted range is the difference between the 95th and the 5th percen-tiles of the per-pupil district allocations given in descending order and is calculated using the formula:
Restricted range=Xi
(
P95)
−Xi( )
P5 .The established standard for the FRR is 0.20 and is described as a percentage (Bennett, 2003). Therefore, pupils in a district who are at the 95th funding percentile must not receive an allocation level of 120% per-pupil greater than the students at the 5th percentile according to federal guidelines
Table 2. Criterion for Equity in the Mississippi Adequate
Education Program.
Horizontal equity
Vertical equity
Fiscal neutrality
Criterion needed Yes No Yes No Yes No
Recognized tax program Base-per-pupil allocation
Adjusts for student needs NA NA
District contribution NA NA NA NA
Note. Once each type of equity is determined to have met the threshold
(U.S. Department of Education, Institute of Education Sciences, National Center of Educational Statistics, 2010). The level is determined by adding the 20% ratio to 95% of the population with an additional 5% for a confidence inter-val, which equals 120%. Both restricted range and FRR will be calculated using the formula:
Federal range ratio 95 5
5
=
(
)
( )
( )
X P X P
X P
i i
i −
.
The third step in the determination of equity utilizes a CV. This is a widely used standard to determine horizontal equity and can give an indication of fiscal neutrality in a given funding formula (Bennett, 2003; Ko, 2006). The stan-dard deviation of variation is determined using the SPSS statistical software. The standard deviation is divided by the mean and then expressed as a percentage. The coefficient will range from 0 to 1.0. Generally, a range of 0.1 or less is a moderate level of equity. The lower the range of variation the greater the level of equity found in a state funding for-mula (Bennett, 2003; Ko, 2006). The CV forfor-mula is as follows:
Variation andCV VAR
2
=
(
)
=X X
N XP
−
.
Fiscal Neutrality
Two methods used to determine Fiscal Neutrality are to uti-lize the SPSS software and run a product-moment correla-tion to determine the correlacorrela-tion coefficient and a correlacorrela-tion of determination (r2) to explain the percent of range attribut-able to wealth among districts (Ko, 2006). The statistical notations for these formulas are as follows:
Pi, number of pupils in a given district i;
n, number of districts;
Xi, average equity per pupil in a given district i;
X, mean per-pupil allocation for all pupils in a given state;
W1, per-pupil wealth;
W, mean per-pupil wealth;
σX, standard deviation of per-pupil allocation;
σW, standard deviation of per-pupil wealth.
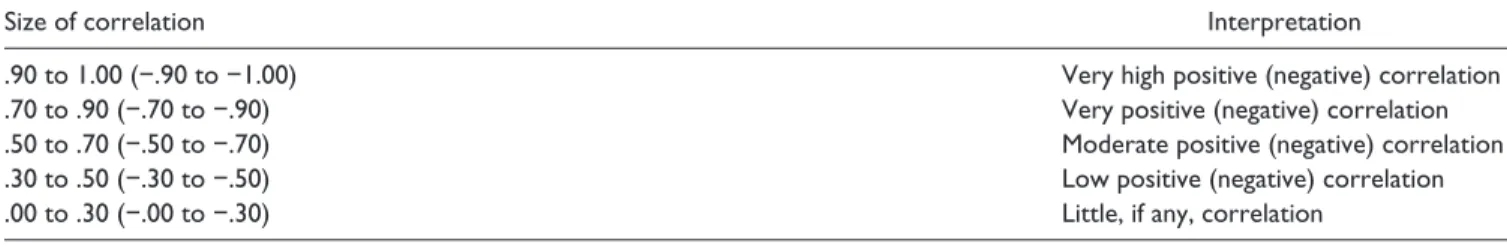
A correlation coefficient, according to Hinkle, Wiersma, and Jurs (2003), is a relational measurement between two variables and describes the degree of the relationship between the two variables. The strength of the correlation is measured in a range from a negative one to a positive one. The closer the score is to a negative one or a positive one, the greater the correlation. A score of zero implies no correlation between the two variables. Hinkle et al. use the following information in Table 3 to interpret the degree of correlation.
S IM C O R R
2 2
=
(
)(
)
(
)
(
)
=
= =
∑
∑
∑
P
P P
X X W W X X W W
i
i
i N
i
i N i
N
i i
i i
1
1 1
− −
− −
.
The Coefficient of Determination (r2) shows the level of variance caused by wealth. There should be little or no dif-ferences in per-pupil district expenditures if there is equity.
The formula for Coefficient of Determination is (SIM CORR)2.
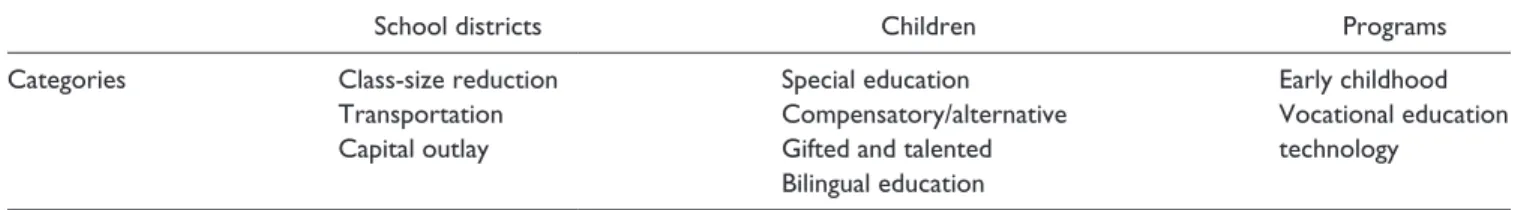
Vertical Equity
As noted by Odden and Picus (2004), different states use dif-ferent means to achieve vertical equity. Due to the variations in attempts at vertical equity, one standard statistical measure cannot be applied. However, there are three distinct categories defined by researchers as indicators of attempts by states to attain some degree of vertical equity. These categories are usu-ally defined as add-ons and are clarified by categorical titles, such as types of children, school districts, and types of pro-grams (Odden & Picus, 2004). These are as shown in Table 4. The third study did not concentrate on the allocations after the budget cuts because the question remained as to whether the formula provided the amount of equity intended by the original framers. Todd Ivey, Director, MDE Office of Policy and School Financial Services, when directed by the Mississippi state legislature, used a simple formula to prorate the budget to all districts according to the percentage of rev-enue cuts as approved by the governor of Mississippi. Thus, the MAEP formula used to create the current budget retained its viability and was not an issue in this study.
Table 3. Degrees of Correlation.
Size of correlation Interpretation
.90 to 1.00 (−.90 to −1.00) Very high positive (negative) correlation
.70 to .90 (−.70 to −.90) Very positive (negative) correlation
.50 to .70 (−.50 to −.70) Moderate positive (negative) correlation
.30 to .50 (−.30 to −.50) Low positive (negative) correlation
.00 to .30 (−.00 to −.30) Little, if any, correlation
Results
The data sets used for the third study were the MDE FY 2004 and FY 2010 per-pupil per district allocations as approved by the Mississippi legislature in comparison with the proposed 1993 framework. These data sets were selected because they were the only 2 years the Mississippi legislature fully funded the formula in all of the years of its existence. The time dif-ferential between the data sets reflects a weakness in the study. Certainly, looking from 1 year to the next year would give the study more reliable data. However, the ability to have a longitudinal view of the formula is a strength in that it allows for the researcher to see the depth of the overall for-mula in terms of horizontal and vertical equity. FY 2004 and FY 2010 were first compared with one another in terms of horizontal equity and vertical equity, and then assessed as they related to the 1993 framework. As the original MAEP formula was used in calculating annual allocations for school districts, the researcher found the formula showed gains in horizontal equity and fiscal neutrality while the vertical equity component was regressing (Putnam, 2011). The origi-nal design did not posit a range or a FRR; however, the fram-ers did propose a standard deviation of US$290.00 and a CV of .094. The FY 2004 standard deviation was US$788.50 as compared with the FY 2010 standard deviation of US$587.00. The difference of US$201.50 represents a 40.42% reduction in the gap between projected and real standard deviations of all 152 school district allocations between FY 2004 and FY 2010. The intended standard deviation was much narrower than the actual standard deviation from FY 2004 and FY 2010 indicating a serious discrepancy from the intended dis-tribution. These statistical numbers imply that although a balance of equal dollars is being given to individual districts per student, these districts are not truly receiving the vertical dollars originally built into the formula to provide for the individual needs of the children within those districts.
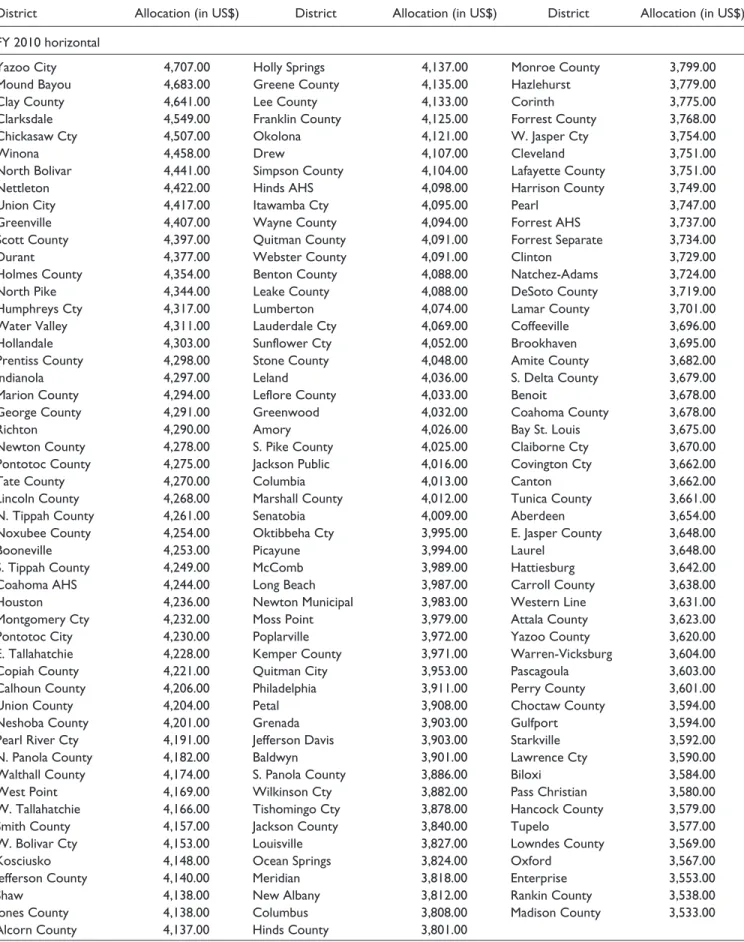
FY 2004 and FY 2010 allocations per child are shown in Table 5 and identified by the individual school districts.
An analysis of longitudinal input illustrates a trend mov-ing more district allocations toward horizontal equity. FY 2004 had a CV of 0.30 compared with the FY 2010 CV of 0.142. Although both practical applications of the formula resulted in higher CVs than the original framework, the FY
2010 CV reflects Mississippi school districts have a per-pupil allocation within 14.2% of the average allocation as opposed to a 30% variance in FY 2004 and 9% in the frame-work model. Thus, the FY 2010 allocations were becoming more horizontally equitable than the FY 2004 allocations as determined by the areas of range, restricted range, and FRR. The summary table of the FY 2004 and FY 2010 equity com-ponents is described in Table 6.
The MAEP was not designed specifically for vertical equity; therefore, the original 1993 framework did not sug-gest applicable ranges as a guide for future studies. The for-mula used a series of categorical add-ons to provide specific allocations for unequal student needs in categories such as transportation, special education, alternative programs, gifted programs, and vocational education.
The funding levels for these add-ons were determined uti-lizing specific formulas in each category. An example, trans-portation is determined by the ADA of transported students in a given district divided by a density rate table, which is furnished by MDE. Special education, gifted programs, vocational, and alternative education are funded based on the number of students approved for the district’s programs according to the base cost per teacher formula established by MDE.
The cost for each program per district is calculated and then followed by a total add-on allocation added to a dis-trict’s base-per-pupil allocation to determine the total MAEP allocation per district and total MAEP program costs state-wide. This independent study utilized the overall MAEP state allocations for FY 2004 and FY 2010 to determine the level of vertical equity unintentionally generated by MAEP through FRR measures.
FRR is determined by subtracting the fifth percentile of the allocations after add-ons from the 95th percentile and dividing the difference by the fifth percentile. Federal regu-lations suggest the optimal FRR should be 0.20 or lower. FY 2004 produced a FRR of 0.22 whereas FY 2010 generated a FRR of 0.27. The growing variance between the 95th percen-tile of add-on funding and that of the fifth percenpercen-tile amounts to slightly over a 100% increase in the restricted range of add-on funding in Mississippi school districts. The increase indicates a weakening of the vertical equity component in the funding structure of the MAEP.
Table 4. Programs of Vertical Equity.
School districts Children Programs
Categories Class-size reduction Special education Early childhood
Transportation Compensatory/alternative Vocational education
Capital outlay Gifted and talented technology
Bilingual education
Table 5. FY 2004 and FY 2010 Per-Pupil Per District Allocations.
District Allocation (in US$) District Allocation (in US$) District Allocation (in US$)
FY 2010 horizontal
Yazoo City 4,707.00 Holly Springs 4,137.00 Monroe County 3,799.00
Mound Bayou 4,683.00 Greene County 4,135.00 Hazlehurst 3,779.00
Clay County 4,641.00 Lee County 4,133.00 Corinth 3,775.00
Clarksdale 4,549.00 Franklin County 4,125.00 Forrest County 3,768.00
Chickasaw Cty 4,507.00 Okolona 4,121.00 W. Jasper Cty 3,754.00
Winona 4,458.00 Drew 4,107.00 Cleveland 3,751.00
North Bolivar 4,441.00 Simpson County 4,104.00 Lafayette County 3,751.00
Nettleton 4,422.00 Hinds AHS 4,098.00 Harrison County 3,749.00
Union City 4,417.00 Itawamba Cty 4,095.00 Pearl 3,747.00
Greenville 4,407.00 Wayne County 4,094.00 Forrest AHS 3,737.00
Scott County 4,397.00 Quitman County 4,091.00 Forrest Separate 3,734.00
Durant 4,377.00 Webster County 4,091.00 Clinton 3,729.00
Holmes County 4,354.00 Benton County 4,088.00 Natchez-Adams 3,724.00
North Pike 4,344.00 Leake County 4,088.00 DeSoto County 3,719.00
Humphreys Cty 4,317.00 Lumberton 4,074.00 Lamar County 3,701.00
Water Valley 4,311.00 Lauderdale Cty 4,069.00 Coffeeville 3,696.00
Hollandale 4,303.00 Sunflower Cty 4,052.00 Brookhaven 3,695.00
Prentiss County 4,298.00 Stone County 4,048.00 Amite County 3,682.00
Indianola 4,297.00 Leland 4,036.00 S. Delta County 3,679.00
Marion County 4,294.00 Leflore County 4,033.00 Benoit 3,678.00
George County 4,291.00 Greenwood 4,032.00 Coahoma County 3,678.00
Richton 4,290.00 Amory 4,026.00 Bay St. Louis 3,675.00
Newton County 4,278.00 S. Pike County 4,025.00 Claiborne Cty 3,670.00
Pontotoc County 4,275.00 Jackson Public 4,016.00 Covington Cty 3,662.00
Tate County 4,270.00 Columbia 4,013.00 Canton 3,662.00
Lincoln County 4,268.00 Marshall County 4,012.00 Tunica County 3,661.00
N. Tippah County 4,261.00 Senatobia 4,009.00 Aberdeen 3,654.00
Noxubee County 4,254.00 Oktibbeha Cty 3,995.00 E. Jasper County 3,648.00
Booneville 4,253.00 Picayune 3,994.00 Laurel 3,648.00
S. Tippah County 4,249.00 McComb 3,989.00 Hattiesburg 3,642.00
Coahoma AHS 4,244.00 Long Beach 3,987.00 Carroll County 3,638.00
Houston 4,236.00 Newton Municipal 3,983.00 Western Line 3,631.00
Montgomery Cty 4,232.00 Moss Point 3,979.00 Attala County 3,623.00
Pontotoc City 4,230.00 Poplarville 3,972.00 Yazoo County 3,620.00
E. Tallahatchie 4,228.00 Kemper County 3,971.00 Warren-Vicksburg 3,604.00
Copiah County 4,221.00 Quitman City 3,953.00 Pascagoula 3,603.00
Calhoun County 4,206.00 Philadelphia 3,911.00 Perry County 3,601.00
Union County 4,204.00 Petal 3,908.00 Choctaw County 3,594.00
Neshoba County 4,201.00 Grenada 3,903.00 Gulfport 3,594.00
Pearl River Cty 4,191.00 Jefferson Davis 3,903.00 Starkville 3,592.00
N. Panola County 4,182.00 Baldwyn 3,901.00 Lawrence Cty 3,590.00
Walthall County 4,174.00 S. Panola County 3,886.00 Biloxi 3,584.00
West Point 4,169.00 Wilkinson Cty 3,882.00 Pass Christian 3,580.00
W. Tallahatchie 4,166.00 Tishomingo Cty 3,878.00 Hancock County 3,579.00
Smith County 4,157.00 Jackson County 3,840.00 Tupelo 3,577.00
W. Bolivar Cty 4,153.00 Louisville 3,827.00 Lowndes County 3,569.00
Kosciusko 4,148.00 Ocean Springs 3,824.00 Oxford 3,567.00
Jefferson County 4,140.00 Meridian 3,818.00 Enterprise 3,553.00
Shaw 4,138.00 New Albany 3,812.00 Rankin County 3,538.00
Jones County 4,138.00 Columbus 3,808.00 Madison County 3,533.00
Alcorn County 4,137.00 Hinds County 3,801.00
District Allocation (in US$) District Allocation (in US$) District Allocation (in US$)
FY 2010 vertical
Clay County 6,116.00 Leland 5,229.00 Tishomingo Cty 4,905.00
Coahoma County 5,932.00 Clarksdale 5,218.00 Covington Cty 4,896.00
Mound Bayou 5,870.00 Smith County 5,199.00 Columbus 4,888.00
North Bolivar 5,868.00 Drew 5,193.00 New Albany 4,867.00
Prentiss County 5,861.00 Indianola 5,189.00 Philadelphia 4,866.00
Montgomery Cty 5,832.00 Quitman Sep 5,177.00 Marshall County 4,842.00
Hollandale 5,803.00 Tate County 5,173.00 Choctaw County 4,836.00
Marion County 5,770.00 Monroe County 5,159.00 Hattiesburg 4,835.00
Franklin County 5,748.00 Wayne County 5,159.00 Jackson Public 4,806.00
Okolona 5,740.00 Baldwyn 5,143.00 Meridian 4,805.00
Oktibbeha Cty 5,727.00 Pontotoc City 5,136.00 Perry County 4,797.00
Winona 5,665.00 Kosciusko 5,126.00 Aberdeen 4,794.00
Chickasaw Cty 5,569.00 Leflore County 5,125.00 Corinth 4,790.00
Union City 5,522.00 Greenville 5,117.00 Enterprise 4,786.00
N. Tippah Cty 5,507.00 Columbia 5,098.00 Lamar County 4,752.00
Nettleton 5,492.00 Itawamba Cty 5,092.00 S. Panola County 4,752.00
Yazoo City 5,476.00 Amory 5,088.00 Natchez-Adams 4,743.00
Richton 5,469.00 Union County 5,087.00 Amite County 4,724.00
Holly Springs 5,462.00 Louisville 5,087.00 Ocean Springs 4,720.00
Alcorn County 5,429.00 McComb 5,083.00 Western Line 4,707.00
Houston 5,423.00 Coahoma County 5,073.00 E. Jasper County 4,706.00
W. Tallahatchie 5,422.00 Holmes County 5,070.00 Starkville 4,672.00
Lumberton 5,375.00 Neshoba County 5,070.00 Lawrence County 4,663.00
East Tallahatchie 5,359.00 Forrest AHS 5,060.00 S. Delta County 4,658.00
Scott County 5,344.00 Lincoln County 5,056.00 Yazoo County 4,655.00
Calhoun County 5,330.00 West Point 5,053.00 Hazlehurst 4,645.00
Noxubee County 5,320.00 Grenada 5,053.00 Pass Christian 4,644.00
Newton 5,317.00 Lee County 5,053.00 Pascagoula 4,637.00
George County 5,309.00 Forrest County 5,047.00 Tupelo 4,608.00
Wilkinson Cty 5,309.00 Kemper County 5,046.00 Cleveland 4,600.00
Water Valley 5,305.00 Long Beach 5,044.00 Brookhaven 4,584.00
S. Tippah County 5,302.00 Hinds AHS 5,038.00 Harrison County 4,558.00
Jefferson County 5,287.00 Humphreys Cty 5,037.00 Biloxi 4,542.00
N. Panola County 5,287.00 Stone County 5,037.00 Gulfport 4,539.00
Pontotoc County 5,287.00 Carroll County 5,035.00 Claiborne Cty 4,534.00
Durant 5,278.00 Picayune 5,032.00 Forrest City 4,534.00
Newton County 5,275.00 Simpson County 5,030.00 Jackson County 4,532.00
Moss Point 5,267.00 N. Pike County 5,017.00 Laurel 4,522.00
Jefferson Davis 5,267.00 Sunflower Cty 5,004.00 Hinds County 4,506.00
Coffeeville 5,266.00 Pearl River Cty 4,989.00 Hancock County 4,505.00
W. Bolivar Count 5,265.00 S. Pike County 4,981.00 Warren-Vicksburg 4,502.00
Greene County 5,259.00 W. Jasper Cty 4,978.00 Clinton 4,495.00
Shaw 5,258.00 Poplarville 4,970.00 Lowndes County 4,483.00
Webster County 5,252.00 Lafayette County 4,969.00 Pearl 4,466.00
Jones County 5,249.00 Attala County 4,959.00 Canton 4,464.00
Benton County 5,247.00 Senatobia 4,958.00 Tunica County 4,424.00
Benoit 5,245.00 Leake County 4,950.00 Oxford 4,396.00
Quitman County 5,245.00 Petal 4,947.00 DeSoto County 4,377.00
Walthall County 5,241.00 Copiah County 4,916.00 Rankin County 4,269.00
Lauderdale Cty 5,238.00 Greenwood 4,916.00 Madison County 4,145.00
Booneville 5,232.00 Bay St. Louis 4,910.00
(continued)
District Allocation (in US$) District Allocation (in US$) District Allocation (in US$)
FY 2004 horizontal
Mound Bayou 3,381.00 Forrest Separate 2,441.00 Lawrence County 2,276.00
Richton 3,076.00 George County 2,440.00 Lincoln County 2,272.00
Drew 2,966.00 Tate County 2,433.00 Hazlehurst 2,265.00
Yazoo City 2,935.00 Jefferson County 2,427.00 Attala County 2,256.00
Winona 2,922.00 Wayne County 2,425.00 Noxubee County 2,256.00
W. Tallahatchie 2,904.00 Aberdeen 2,421.00 Alcorn County 2,255.00
Montgomery Cty 2,869.00 Hinds AHS 2,417.00 Pearl River Cty 2,251.00
N. Bolivar Cty 2,862.00 Quitman County 2,413.00 Pearl 2,250.00
Clarksdale 2,854.00 Greene County 2,404.00 Oxford 2,249.00
Shaw 2,818.00 Humphreys Cty 2,401.00 Stone County 2,247.00
Clay County 2,811.00 Brookhaven 2,396.00 New Albany 2,240.00
Oktibbeha Cty 2,753.00 N. Tippah Cty 2,388.00 Grenada 2,237.00
Hollandale 2,742.00 Forrest County 2,384.00 Tishomingo/Iuka 2,230.00
West Bolivar 2,694.00 Petal 2,384.00 Pascagoula 2,223.00
South Pike 2,693.00 S. Tippah County 2,380.00 Biloxi 2,222.00
Scott County 2,681.00 Bay St. Louis 2,376.00 Quitman 2,219.00
Prentiss County 2,659.00 Meridian 2,374.00 Lumberton 2,214.00
Durant 2,642.00 Pontotoc County 2,374.00 Union County 2,210.00
Indianola 2,627.00 Warren-Vicksburg 2,373.00 Hattiesburg 2,207.00
Greenwood 2,617.00 Columbus 2,367.00 N. Pike County 2,205.00
Walthall County 2,611.00 Baldwyn 2,364.00 S. Panola County 2,199.00
Webster County 2,605.00 Claiborne County 2,363.00 Pontotoc City 2,191.00
Marion County 2,603.00 Benton County 2,361.00 Philadelphia 2,189.00
Wilkinson Cty 2,602.00 Copiah County 2,360.00 Lowndes County 2,187.00
Leland 2,600.00 Covington Cty 2,360.00 Enterprise 2,184.00
Okolona 2,596.00 Gulfport 2,360.00 East Jasper 2,183.00
East Tallahatchie 2,579.00 McComb 2,356.00 Benoit 2,174.00
Greenville 2,578.00 Lafayette County 2,355.00 Senatobia 2,173.00
Union Separate 2,564.00 Western Line 2,354.00 Tunica County 2,173.00
Choctaw County 2,555.00 Newton 2,353.00 Clinton 2,168.00
Nettleton 2,553.00 Louisville 2,351.00 Ocean Springs 2,161.00
Franklin County 2,541.00 Kosciusko 2,343.00 Lee County 2,142.00
Water Valley 2,534.00 Jackson Public 2,342.00 Jackson County 2,121.00
Long Beach 2,529.00 Newton County 2,342.00 Pass Christian 2,118.00
Sunflower Cty 2,511.00 Coffeeville 2,341.00 Booneville 2,110.00
Jones County 2,491.00 Moss Point 2,338.00 Hinds County 2,102.00
Coahoma County 2,489.00 North Panola 2,330.00 West Point 2,093.00
Cleveland 2,485.00 Laurel 2,326.00 Lamar County 2,091.00
Lauderdale Cty 2,484.00 Monroe County 2,322.00 Houston 2,085.00
Chickasaw Cty 2,470.00 Corinth 2,317.00 Yazoo County 2,073.00
Smith County 2,467.00 Itawamba 2,313.00 Harrison County 2,065.00
Holmes County 2,465.00 Leake County 2,311.00 Hancock County 2,064.00
Starkville 2,461.00 W. Jasper Cty 2,305.00 Rankin County 2,056.00
Kemper County 2,459.00 Leflore 2,303.00 Forrest AHS 2,036.00
Natchez-Adams 2,456.00 Poplarville 2,301.00 Amory 2,035.00
Calhoun County 2,452.00 Neshoba 2,297.00 Holly Springs 2,026.00
Coahoma AHS 2,449.00 Columbia 2,294.00 Madison 1,946.00
Picayune 2,448.00 Tupelo 2,293.00 DeSoto County 1,810.00
Simpson County 2,446.00 Perry County 2,280.00 Carroll County 1,804.00
Amite County 2,442.00 Jefferson Davis 2,276.00
FY 2004 vertical
Shaw 3,673.00 Laurel 3,205.00 DeSoto County 2,960.00
Yazoo County 3,576.00 Pascagoula 3,204.00 Forrest County 2,960.00
(continued)
District Allocation (in US$) District Allocation (in US$) District Allocation (in US$)
Benoit 3,538.00 Philadelphia 3,203.00 Tate County 2,958.00
Holmes County 3,533.00 Pearl River Cty 3,203.00 Hinds AHS 2,943.00
Montgomery Cty 3,454.00 Sunflower Cty 3,203.00 Leake County 2,941.00
Coahoma AHS 3,440.00 N. Panola County 3,187.00 Oxford 2,932.00
Lee County 3,411.00 N. Pike County 3,187.00 Copiah 2,931.00
Carroll County 3,399.00 Lumberton 3,182.00 Greene County 2,927.00
Pearl 3,389.00 Columbia 3,179.00 South Tippah 2,925.00
Cleveland 3,387.00 Leflore County 3,177.00 Union County 2,909.00
Clinton 3,387.00 East Jasper 3,175.00 Jefferson County 2,907.00
Western Line 3,386.00 Smith County 3,166.00 Forrest City 2,902.00
Madison County 3,383.00 Stone County 3,166.00 Rankin County 2,901.00
Perry County 3,377.00 Booneville 3,164.00 Brookhaven 2,875.00
Warren-Vicksburg 3,369.00 Simpson County 3,164.00 Covington Cty 2,866.00
Benton County 3,367.00 Hattiesburg 3,160.00 Oktibbeha Cty 2,866.00
Newton Separate 3,349.00 Tupelo 3,156.00 Lowndes County 2,856.00
Tunica County 3,342.00 East Tallahatchie 3,156.00 Poplarville 2,853.00
Canton 3,331.00 Humphreys Cty 3,152.00 Meridian 2,849.00
Indianola 3,328.00 Pontotoc County 3,151.00 W. Bolivar Cty 2,840.00
Houston 3,319.00 Picayune 3,150.00 Jackson Public 2,839.00
Union City 3,314.00 Attala 3,141.00 Lauderdale Cty 2,834.00
Drew 3,314.00 Hollandale 3,136.00 Bay St. Louis 2,830.00
S. Panola County 3,309.00 Jackson County 3,132.00 Itawamba Cty 2,830.00
Franklin County 3,300.00 S. Delta County 3,125.00 Choctaw County 2,827.00
Coahoma County 3,292.00 Prentiss County 3,106.00 West Point 2,825.00
Senatobia 3,287.00 Okolona 3,101.00 Corinth 2,813.00
W. Tallahatchie 3,272.00 Scott County 3,099.00 Jones County 2,812.00
Pontotoc City 3,264.00 Amory 3,098.00 Tishomingo Cty 2,812.00
Jefferson Davis 3,261.00 Webster County 3,097.00 Monroe County 2,807.00
George County 3,260.00 Moss Point 3,088.00 Leland 2,805.00
West Jasper 3,259.00 Lawrence County 3,087.00 Forrest AHS 2,803.00
McComb 3,259.00 Marion County 3,077.00 Water Valley 2,798.00
Greenwood 3,253.00 Baldwyn 3,074.00 Grenada 2,794.00
Winona 3,250.00 Aberdeen 3,050.00 Neshoba 2,780.00
Greenville 3,248.00 South Pike 3,048.00 Calhoun County 2,780.00
Clarksdale 3,245.00 Wilkinson Cty 3,046.00 Biloxi 2,774.00
Petal 3,243.00 Gulfport 3,040.00 Walthall County 2,773.00
Coffeeville 3,243.00 N. Bolivar Cty 3,036.00 Lincoln County 2,773.00
Chickasaw 3,242.00 Quitman City 3,035.00 Hancock County 2,772.00
Starkville 3,234.00 Hinds County 3,030.00 Ocean Springs 2,768.00
Richton 3,225.00 Wayne County 3,030.00 Long Beach 2,765.00
Durant 3,224.00 Amite County 3,016.00 Harrison County 2,763.00
Clay County 3,221.00 Natchez-Adams 3,011.00 Alcorn County 2,760.00
Marshall County 3,218.00 Hazlehurst 3,005.00 Pass Christian 2,756.00
New Albany 3,217.00 Enterprise 3,004.00 Lafayette County 2,754.00
Lamar County 3,216.00 Claiborne 2,989.00 Nettleton 2,748.00
Kosciusko 3,215.00 Louisville 2,989.00 Quitman County 2,747.00
Newton County 3,213.00 Noxubee County 2,973.00 Columbus 2,727.00
N. Tippah 3,211.00 Kemper County 2,971.00 Yazoo City 2,724.00
Mound Bayou 3,210.00 Holly Springs 2,967.00
Source. Adapted from the Mississippi Department of Education (2004).
Note. The title of City has been left off for space concerns. East and West Tallahatchie School Districts are county schools. E., W., N., and S. represent
East, West, North, and South, respectively. AHS = Agricultural High School. Cty = County.
Conclusion
The following conclusions are based on the findings of this study as related to the intended design and practical applica-tions of the MAEP.
1. The FY 2010 allocation is more horizontally equita-ble than FY 2004.
2. MAEP has a moderate level of fiscal neutrality and reflects an increasing fiscally neutral tendency rela-tive to the add-ons employed within the funding formula.
3. The practical application of the formula is not as equitable as the design; however, the horizontal CV for FY 2010 is within federal guidelines reflecting a moderate level of horizontal equity.
4. The FRR for FY 2010 is within the federal guidelines for a moderate level of horizontal equity and reflects a weakening of vertical equity.
5. The formula does not provide direct categorical fund-ing for class-size reduction, capital outlay, bilfund-ingual education, early childhood education, or technology. 6. The minimum and maximum level of mills a district
may levy has not changed since 1993 despite the eco-nomic upheavals in the past 5 years.
Recommendations
The current MAEP formula continues to use the 1993 finan-cial variants, which results in gains in horizontal equity but a regression in vertical equity. Todd Ivey (personal communi-cation, October 20, 2010) of the MDE, characterized the flaws in the funding formula as the opportunity for Mississippi to become embroiled in litigation due to a lack of
adequacy in the current formula. If MAEP is to continue as a dynamic formula, it must meet the needs of students today as well as tomorrow
The data from this study support several recommenda-tions regarding the MAEP. First, due to the impact of the recent economic downturn beginning in 2008 in the state of Mississippi, the required 4-year reevaluation, due in 2012, of the base student cost should be implemented immediately to ensure districts are receiving the resources necessary to meet the changing needs of students.
Second, as reported by APA in 2005, at-risk components within the funding formula should be adjusted to provide more vertical equity. For example, the base student cost line item for free lunch participants should be changed to reflect free and reduced lunch participants for funding purposes. Currently, Mississippi law prohibits the use of the reduced lunch count when assessing the allocation for low socioeco-nomic students in the state of Mississippi.
Third, the minimum and maximum level of tax mills which districts may levy should be adjusted upwards to match the current rate of inflation. In doing so, districts could raise their tax millage to help offset the cost of educating children.
The fourth recommendation is that class-size reduction, capital outlay, bilingual education, early childhood educa-tion, and technology should be funded as add-ons. Currently, MAEP does not fund these categories, which further weaken the vertical equity.
Last, an independent study of the vertical equity of the MAEP should be conducted. This study could provide edu-cational leaders and legislative members the information and guidance necessary to realign, increase, and maximize the resources being provided to the students.
Table 6. Summary Table for Horizontal Equity, Vertical Equity, and Fiscal Neutrality.
Measure Horizontal Vertical Fiscal neutrality
Fiscal year 2004 2010 2004 2010 2004/2010
Maximum (in US$) 3,381.00 4,707.00 3,673.00 6,116.00
Minimum (in US$) 1,804.00 3,533.00 2,724.00 4,145.00
Range (in US$) 1,577.00 1,174.00 949.00 1,971.00
95th percentile (in US$) 2,854.00 4,417.00 3,389.00 5,584.00
5th percentile (in US$) 2,065.00 3,584.00 2,765.00 4,495.00
Restricted range (in US$) 789.00 833.00 624.00 1,253.00
Federal range ratio 0.38 0.23 0.22 0.27
M (in US$) 2.592.50 4,120.00 3,198.50 5,053.09
Median (in US$) 2,360.00 4,012.50 3,115.50 5,054.50
SD (in US$) 788.50 587.00
Coefficient of variance 0.30 0.143
Correlation coefficient .566
Coefficient of Determination .966
Correlation significance at .01 level (two-tailed) .983
Declaration of Conflicting Interests
The author(s) declared no potential conflicts of interest with respect to the research, authorship, and/or publication of this article.
Funding
The author(s) received no financial support for the research and/or authorship of this article.
References
Augenblick, J., & Myers, J. (1993). School finance in Mississippi: A proposal for an alternate system. Denver, CO: Augenblick, Van de Water & Myers.
Augenblick, Palaich and Associates. (2004, May 29). Memorandum. Denver, CO: APA Consulting.
Baker, B., & Green, P. (2008). Conceptions of equity and ade-quacy in school finance. In H. F. Ladd & E. B. Fiske (Eds.),
Handbook of research in education finance and policy (pp. 203-219). New York, NY: Routledge.
Bennett, R. A. (2003). An analysis of the equity of Nevada’s public school funding system (Doctoral dissertation). Available from http://www.library.unlv.edu/
Berne, R., & Stiefel, L. (1984). The measurement of equity in school finance: Conceptual methodological and empiri-cal dimensions. Baltimore, MD: Johns Hopkins University Press.
Commission on Restructuring the Mississippi Adequate Education Program (MAEP) Act, Mississippi Code Section 37-151-85 (as amended) (2005).
Downes, A., & Stiefel, L. (2008). Measuring equity and adequacy in school finance. In H. F. Ladd & E. B. Fiske (Eds.), Handbook of research in education finance and policy (pp. 220-237). New York, NY: Routledge.
Fine, B. (1953, February 8). Millions more pupils a year burdening schools of nation; Big deficiencies burden schools. The New York Times. Retrieved from http://query.nytimes.com/search/site-search/#/Millions+more+pupils+a+year+burdening+schools+of+ nation%3B+Big+deficiencies+burden+schools./
Hinkle, D. E., Wiersma, W., & Jurs, S. G. (2003). Applied statistics for the behavioral sciences (5th ed.). Boston, MA: Houghton Mifflin.
Jackson State University, Department of History and Philosophy. (2010). Voices from as shared past: Origins of public education. Joint Legislative Committee on Performance Evaluation and
Expenditure Review. (2002). A review of the Mississippi Adequate Education Program funding process (Report No. 436). Jackson, MS: Performance Evaluation and Expenditure Review.
Ko, J. W. (2006). The impact of new funding formula on school finance equity in Missouri. Education Week, 126(3), 559-568. Mississippi Department of Education, Department of Finance.
(2004). Available from http://www.mde.k12.ms.us
Mississippi Parent’s Campaign. (2010). Mississippi Adequate Education Program. Retrieved from http://www.mspar-entscampaign.org/component/content/article?id=34
Monroe, P. (Ed.). (1911-1913). A cyclopedia of education (Vol. 1). New York, NY: Macmillan.
National Center for Educational Statistics. (2009). Public school finance programs of the United States and Canada: 1998-1999. Washington, DC: Office of Educational Research and Improvement, U.S. Department of Education.
Odden, A., & Picus, L. (2004). School finance: A policy perspec-tive. Boston, MA: McGraw-Hill.
Pallant, J. (2007). SPSS survivor manual (3rd ed.). New York, NY: McGraw-Hill.
Pickering, S. (2008). Memoranda to Governor Haley Barbour & et al. (Archival document). Jackson: Mississippi Department of Education.
Pickering, S. (2009). Memoranda to Governor Haley Barbour & et al. (Archival document). Jackson: Mississippi Department of Education.
Picus, L. O., Goetz, M., & Odden, A. (2008). Intergovernmental aid formulas and case studies. In H. F. Ladd & E. B. Fiske (Eds.), Handbook of research in education finance and policy
(pp. 257-275). New York, NY: Routledge, Taylor, & Francis. Putnam, M. (2011). Equity in Mississippi: A study of public school
funding (Doctoraldissertation) University of Mississippi. Rubenstein, R., & Sjoquist, D. L. (2003). Financing Georgia’s
schools: A primer (FRC Report No. 87). Atlanta: Georgia State University.
Senate Bill 2731, Mississippi Code Section 37-151-85 (as amended) (2005).
Springer, M., Houck, E., & Guthrie, J. (2008). History and schol-arship regarding United States education finance and policy. In H. F. Ladd & E. B. Fiske (Eds.), Handbook of research in education finance and policy (pp. 3-22). New York, NY: Routledge.
Strayer, G., & Haig, R. (1923). Educational finance inquiry com-mission. New York, NY: Macmillan.
Tozer, S., Senese, G., & Violas, P. (2008). School and society: Historical and contemporary perspectives (6th ed.). New York, NY: McGraw-Hill.
U.S. Department of Education, Institute of Education Sciences, National Center of Educational Statistics. (2010). Litigation: School finance litigation, by year, case, and status, by state: 1970-2009. Washington, DC: National Center of Educational Statistics.
Author Biographies
Michael Putnam currently serves as an associate professor in the educational administration leadership and research department at Western Kentucky University in Bowling Green, Kentucky. After serving P-12 education as a teacher and administrator for 28 years in Mississippi, he received his PhD at the University of Mississippi and moved into higher education to continue his work.