American Journal of Engineering Research (AJER)
e-ISSN: 2320-0847 p-ISSN : 2320-0936
Volume-5, Issue-10, pp-30-36
www.ajer.org
Research Paper Open Access
w w w . a j e r . o r g
Page 30
Analysis on Dispersion & Propagation Optical Fiber of Different
Materials at Different Temperatures
Md. Fuzlul Karim
1, Md. Faruque Islam
2, Tanwy Barua
3,Shakh Md.
Alimuzjaman Alim
41, 2(EEE, American International University-Bangladesh, Bangladesh) 3(MEEE, American International University-Bangladesh, Bangladesh)
4
(EEE, Royal University of Dhaka, Bangladesh)
ABSTRACT:
Temperature dependent Sell Meier coefficients are necessary for determining different optical design parameters which are important for optical fiber communication system. These coefficients are calculated for fused Silica (SiO2), Aluminosilicate and Vicar Glasses, to find the dependence of chromatic dispersion on temperature and at any wavelengths encompassing the profile dispersion parameter. In this paper, we analyzed the zero-dispersion wavelengths, for single mode fiber is modeled and investigated for all three materials, considering step-index fiber model. Temperature effects on zero-dispersion wavelengths, are also investigated for a wide range (-120 0 C to 120 0 C) as well as including the relative refractive index difference. The two important modal properties, the effective area and power propagation through the fiber are calculated first solely and then considering the perfectly matched layer. It was found that the power propagation increased and the corresponding effective area decreased due to the use of perfectly matched layer which strongly supports the theory of confinement of light within the core region. We calculated the dependence of modal birefringence and polarization mode dispersion upon wavelength for different fiber materials. We also determined the sensitivities of these two parameters to temperature. Our results show that in the analyzed spectral range both modal birefringence and polarization mode dispersion decreases with wavelength.Keywords:
Communication, Step index, Fiber, GaAs, Transmitter.I.
INTRODUCTION
The need of communication is an all-time need of human beings. For communication some channel is needed. Fiber is one among many other channels for communication. Optical fibers are thin long strands of ultra-pure glass or plastic that can transmit light from one end to another without much attenuation or loss. Fiber optic systems transmit using infrared light, invisible to the human eye, because it goes further in the optical fiber at those wavelengths. In the field of communication, introduction of microwaves in the 1λ20‟s for communication between two distant points, this technology has gone through a remarkable amount of
development. However, these links were limited to distances within the „line of sight‟ (roughly 30 kilometers)
[1]. Thus, the need for orbiting satellites to rely information over long distances was conceived as real. Today satellites of all shapes and capabilities have been introduced to serve almost all the countries of the world. However, signals are weakened about a hundred times after travelling these large link distances, thus necessitating the usage of high gain antennas and powerful transmitters [2]. A more relevant problem, however, is the delay and echo often experienced in long distance phone calls that use these satellites, popularly known as sat phone. The settlement of even increasing traffic needs the usages of higher frequency bands for satellite communications. The limitations on the performance of satellite communication systems at frequencies more than 10GHz result from a strong interaction of radio waves with rain and ice in the lower atmosphere. Attenuation due to rain dominates the power margin for system operating above 10GHz; hence multiple sites are conditioned to cope up high availability objectives. In addition, the capacity per beam is strongly reduced by rain. For example, to ensure the same quality of transmission during rainy period, the capacity may have to be halved. Conclusively, a substantial number of terrestrial relays (microwave radio links that operate only within
„line of sight‟ distances) are needed to transmit the information.
w w w . a j e r . o r g
Page 31
point where the information source provides an electrical signal. A transmitter comprises electrical or electronics components which converts the signal into suitable form for propagating over the light medium by modulating a carrier. The transmission medium consists of a pair of wires, a coaxial cable or a radio link. Through the transmission medium signal is transmitted to the destination or receiver. Over a transmitted medium the signals are attenuated or loss. The general block diagram of optical fiber communication system is shown in the figure below:Fig. 1 Optical fiber communication system
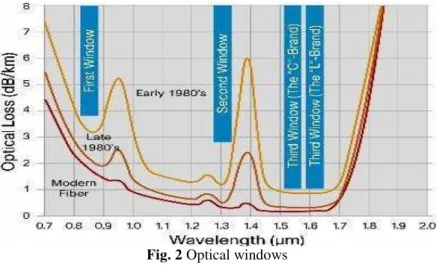
The first window at 800–900 nm was originally used. GaAs/AlGaAs-based laser diode and light emitting diodes (LEDs) served as transmitters, and silicon photodiodes were suitable for the receivers. However, the fiber losses are relatively high in this region, and fiber amplifiers are not well developed for this spectral region. Therefore, the first telecom window is suitable only for short-distance transmission.
Fig. 2 Optical windows
The second telecom window utilizes wavelengths around 1.3 m, where the loss of silica fibers is much
lower and the fiber‟s chromatic dispersion is very weak, so that pulse broadening is minimized. This
window was originally used for long-haul transmission.
The third telecom window, which is now very widely used, utilizes wavelengths around 1.5 m. The losses of silica fibers are the lowest in this region, and erbium doped fibers are available which offer very high performance. Fiber dispersion is usually anomalous but can be tailored with great flexibility. The figure below shows the operating range of optical fiber systems.
The second and third telecom windows are further subdivided into the following wavelength bands:
w w w . a j e r . o r g
Page 32
II.
THE TEMPERATURE DEPENDENCE OF THE REFRACTIVE INDICES
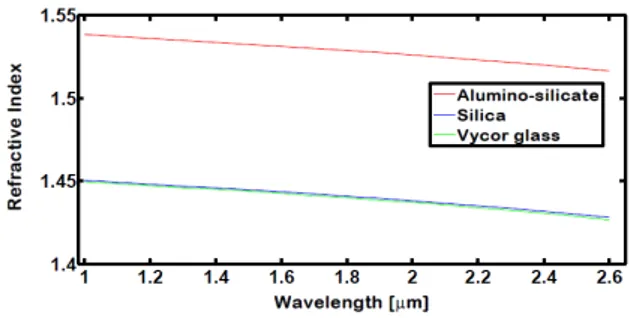
The temperature dependent Sellmeier coefficients using equation (3.30) are calculated for the three optical fiber glasses from which the refractive indices are calculated at any wavelength and at any operating temperature. The results are shown in Fig. (3) and Fig. (4).
Fig. 3: Refractive index vs. wavelength for three optical glasses
For all three types of glasses are found to follow a decreasing trend for refractive index vs. wavelength and nicely fit to straight line for refractive vs. temperature. For a given wavelength the refractive index of Aluminosilicate is high as compared to the others two [3], SiO2 and Vycor respectively. A typical plot of the
temperature dependent Sellmeier coefficients (A, B, C, D) for all three types of materials is shown in Fig. (4), Fig. (4) and Fig. (5) .It is evident that all are nicely fitted into straight lines. For fused silica (SiO2) glass, the
result is identical with.
Fig. 4 Sellmeier coefficients vs. temperature for SiO2 glass
Fig. 5 Sellmeier coefficients vs. temperature Aluminosilicate glass
w w w . a j e r . o r g
Page 33
III.
EFFECTIVE REFRACTIVE INDEX
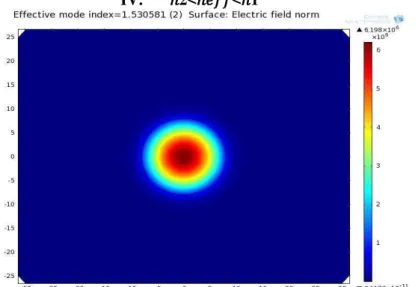
The effective refractive index for Aluminosilicate is simulated at 1.55 m wavelength, 260
C with core
�1 = 1.532 and cladding 2% less than core. The simulation result is found shown in Fig. (7). It satisfies the
condition for effecttive index [2]:
IV.
�
2<
�
<
�
1
Fig. 7 Effective mode index for Aluminosilicate with normalized electric field.
Only the fundamental mode is found. For other two materials the same procedure is done. Also the normalized electric field is shown, which signifies that the electric field is maximum inside the core region and decreases far from the core. It is evident of strong guiding of light within the core of the step-index fiber where bend losses and others effect of external disturbances are weak. A plot of effective mode index vs. wavelength at 260C for SiO2 glass is shown in Fig. (7), which decreases with the increase of wavelength.
Fig. 8 Effective mode index vs. wavelength for SiO2 glass at 26 0
C
The dependence of effective mode index is calculated in the temperature range of 00C to 1000C at 1.55 m wavelength is shown in Fig. (4.8), which is nicely fit into straight lines in the increasing trend for all three glasses.
w w w . a j e r . o r g
Page 34
V.
DISPERSION
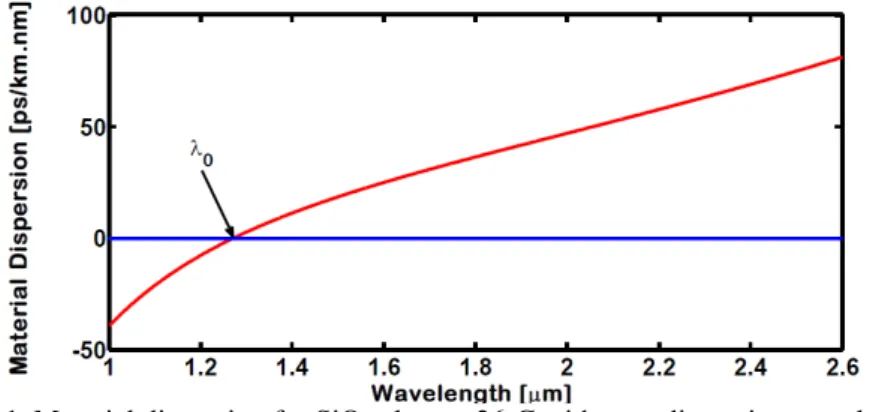
Material Dispersion
Material dispersion is calculated for the three optical fiber glass types (SiO2, Aluminosilicate, Vycor
glass) at 260C using the temperature dependent Sellmeier coefficients in Equation . It is shown in Fig. (10).
Fig. 10 Material dispersion at 260C for all three glasses
The zero material dispersion wavelengths are 1.2726, 1.3921 and 1.2677 for SiO2, Aluminosilicate and
Vycor glass respectively which is nearly by shown. The dispersion characteristics are not linear for whole spectral region. A sample of the results is shown in Fig. (10) for SiO2 glass.
Fig. 11. Material dispersion for SiO2 glass at 260C with zero dispersion wavelength
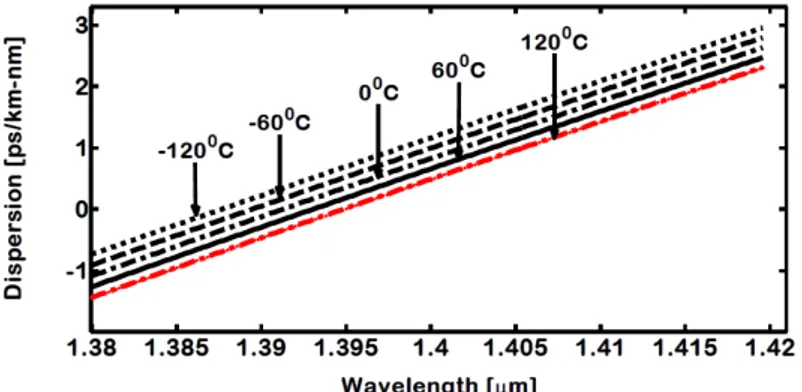
For a wide of temperature (-1200C to 1200C), the material dispersion and the zero-material dispersion wavelength has been calculated for three glasses. The obtained results are shown in Fig. (11), Fig. (12) and Fig. (13) For SiO2, Alumniosilicate, and Vycor glass, respectively [4]. The material dispersion linearly related to
temperature, and increases with the increase of wavelength for all three tested optical fiber materials. The zero material dispersion wavelength as a function of temperature, T is displayed in Fig. (14) For all three types of glasses [5]. It is seen that the temperature dependence is linear and d 0�=0.025 nm/0C for silica and this is perfectly matched with. This value is fair agreement with the published experimental values of 0.029 ±0.004 nm/0C and 0.031±0.004 nm/0C for two dispersion shifted fibers within the experimental accuracy. The corresponding values of d 0
� is found 0.03 nm/
0
C for both Aluminosilicate and Vycor glasses [6].
w w w . a j e r . o r g
Page 35
Fig. 13 Material dispersion vs. wavelength for a wide range of temperature for Aluminosilicate glass
Fig. 14 Material dispersion vs. wavelength for a wide range of temperature for Vycor glass.
Fig. 15 Zero-dispersion wavelength vs. temperature
VI.
CONCLUSION
w w w . a j e r . o r g
Page 36
REFERENCES
[1]. Shaymol Badra, Ajoy Ghotok, Guided wave optics and photonic devices.
[2]. J. M. Senior, Optical Fiber Communications, Principles and Practice, (Publisher:Prentice Hall International, Hertfordshire,UK), 1992; 2nd Edition
[3]. G. Kaiser, Optical fiber communications, 4th edition.
[4]. SEA-ME- WE 4 Network Administration System. Videsh Sanchar Nigam Limited. 2004. Archived from the original on 2007-07- 06. Retrieved 2008-01- 31.
[5]. G. Ghosh, M. Endo, T. Iwasaki, “Temperature-dependent Sellmeier coefficients and chromatic dispersions for some optical fiber
glasses,” Journal of Lightwave Technology, Vol. 12, No. 8, Aug. 1994.
[6]. W. EI Shirbeeny, Moustafa H. Aly, Ahmed E. EI-Samahy, Khaled M. Emad, “Temperature dependence of zero dispersion
wavelength in single mode optical fibers for different materials,” International Journal of Pure and Applied Physics,Vol. 3,No.1, pp. 122-131,2007