pISSN 1899-5241 eISSN 1899-5772
2(36) 2015, 323–328
dr hab. Joanna Szwacka-Mokrzycka, Katedra Polityki Europejskiej, Finansów Publicznych i Marketingu, Szkoła Główna
Abstract. The aim of this article is to present differences in
concentration of production and their impact on the market position of the companies active in the fat and dairy sectors. The analysis covered the period from 2ŃŃ8 to 2Ńń2, including the global crisis and post-crisis situation in Poland, which ac-companied it. The conducted research shows that the process-es of adjustment of supply to market demand includeŚ changprocess-es in the profi le of manufacturing enterprises, rationalisation of behaviour in the sphere of production and resource manage-ment. Żor the research two branchesŚ fat and dairy products, which are diverse in terms of supply and demand and concen-tration of production. This paper focuses on the production and revenue concentration in the branches of the food industry selected for the study. The study used a rich empirical mate-rial based on both the author’s own research and secondary sources.
Key words: fat branch, dairy branch, concentration of
pro-duction, market position of companies
INTRODUCTION
Żood market in Poland is characterised by continued trend of consolidation processes through company mergers and acquisitions. The result of these activities is relatively high diversity of companies in terms of size and market share. There are both versatile enter-prises (competing using the same methods and means)
and specialized businesses. Żrom the perspective of as-sessment of future development of the food industry it is important to determine the differences in concentra-tion of producconcentra-tion and revenues between the individual branches.
The aim of this article is to present differences in concentration of production and their impact on the market position of the companies active in the fat and dairy branches. Choice of these branches for the re-search was dictated by their different characteristics in terms of supply and demand. The presented branches are characterised by different concentration of pro-duction and capital as well as the varied pressure of demand for the products they offered. The analysis covered the period from 2ŃŃ8 to 2Ńń2, including the global crisis and post-crisis situation in Poland, which accompanied it.
TRENDS IN THE FOOD MARKET IN POLAND
In řŃs of the last century the economic transformation began in Poland, which concerned also the food mar-ket. The internationalisation of the economy was initi-ated, which was connected with the infl ow of foreign capital, including the largest global companies. źntry of the international companies into the Polish market initiated the process of globalisation of the economy,
THE IMPACT OF CONCENTRATION OF PRODUCTION
ON
MARKET POSITION OF SELECTED BRANCHES
OF
FOOD INDUSTRY IN POLAND
Joanna Szwacka-Mokrzycka
consisting of the introduction of new technologies, products as well as methods of organisation and man-agement. Since 2ŃŃ2 we have seen considerable pro-gress in the process of concentration and consolidation, involving, for instance, acquisition of Polish enterpris-es by foreign and domenterpris-estic strategic inventerpris-estors, both in-dustry and fi nancial, and mergers of Polish companies. This situation has arisen in connection with źuropean integration and the associated Polish accession to the źU, as well as the ongoing economic globalisation (Kraciuk, 2ŃŃ8). The modern food market in Poland has a characteristic of the oligopolistic competition model. The trend of consolidation processes through mergers and acquisitions can be seen (Szwacka-Mok-rzycka, 2Ńń3). Polish accession to the źU has contrib-uted to a signifi cant development of the food industry. Over the years 2ŃŃ3-2ŃńŃ average growth rate of food production (expressed in fi xed prices) stayed at 5.2% per annum, which was almost three times higher than in the period from ńřř8 to 2ŃŃ2 (Urban and Mroczek, 2Ńńń). It is important to note the presence of a large similarity in the structure of the agricultural and food processing industry and the structure of food enter-prises functioning in Poland and in other źU countries. Starting from 2ŃŃ4, the consolidation actions have been taken to encourage the concentration of the food industry in Poland (Pawlak and Poczta, 2Ńńń). As a re-sult of the action taken, the position of large enterprises has been strengthened, while position of medium and small enterprises has been undermined. This has result-ed in an increase in the proportion of large businesses, with a simultaneous decline of small businesses in food production in Poland. Similar trends have appeared throughout the źU market.
RESEARCH METHODS AND SOURCES OF INFORMATION
The research covered an analysis of concentration in the fat and the dairy branches based on Herfi ndahl--Hirschman Index (HHI), żini coeffi cient) and Lorenz curve. The calculations were made on the basis of data from the fi nancial statements of companies submitting fi nancial statements to the National Court Register (KRS) and publishing the fi nancial results in Infoveriti.
Analysis of concentration1
The following measures were used to determine the branch concentrationŚ Herfi ndahl-Hirschman Index (HHI)2, żini coeffi cient3, and the results were presented using Lorenz curve4.
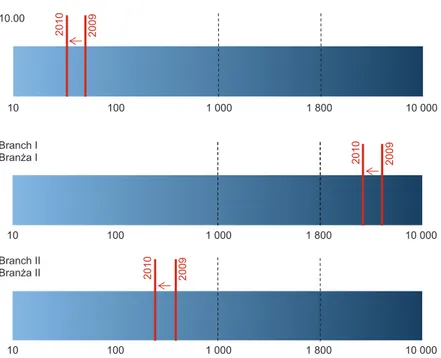
Table ń shows the development of the Herfi ndahl--Hirschman Indices in the years 2ŃŃ8-2ŃńŃ in the branch cross-section ńŃ.ŃŃ (food industry) and fat (I) and dairy (II) branches.
According to the HHI in total food sector and in branch II there is a low concentration. The data contained
ń This elaboration is constructed on the basis of data from the
fi nancial statements of companies submitting fi nancial statements to the National Court Register (KRS) and publishing the fi nancial results in Infoveriti (www.infoveriti.pl).
2 HHI Index is a measure of market concentration and
deter-mines the estimated level of concentration in the branch and the level of competition in the relevant market. HHI is calculated as sum of squares of market shares expressed as a percentage. Its value ranges between ńŃ ŃŃŃ/n and ńŃ ŃŃŃ (where n is the num-ber of enterprises). Żall of the Herfi ndahl-Hirschman Index im-plies a decrease in strength of the manufacturers and an increase in competition and rise of the index vice versa. Żood Industry (ńŃ.ŃŃ).
3 żini coeffi cient is a measure of concentration (unevenness)
of the distribution of a random variable. is the area between the Lorenz curve and the diagonal of the unit square multiplied by 2. Its values range from Ń to ńŃŃ%, where Ń% means a full evenness of the distribution and ńŃŃ% means a full evenness of the distri-bution (only one variable cam have a positive value).
4 The curve describes the degree of concentration, that is the
unevenness of the distribution of global resource characteristics.
Table 1. Herfi ndahl-Hirschman Indices in the years 2ŃŃ8–
2ŃńŃ
Tabela 1. →ska niki Herfi ndahla-Hirschmana w latach
2ŃŃ8–2ŃńŃ
2ŃŃ8 2ŃŃř 2ŃńŃ Żood Industry
Przemysł spo ywczy 65 66 5ř Branch I
Bran a I ń 574 3 Ń2ř 2 467 Branch II
Bran a II 473 47ř 3ř8
in Table ń show that the total food production is charac-terised by a high dispersion of production and the rev-enues from the sales of the products. In branch I (fat) in 2ŃŃ8 there was a moderate concentration (HHI index > ńŃŃŃ), which in the years 2ŃŃř-2ŃńŃ decreased (HHI index > ń8ŃŃ) – chart ń and Table ń.
Lorenz concentration ratio
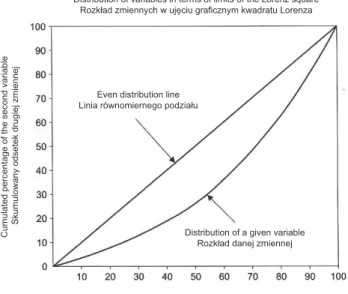
The subject of the analysis of the Lorenz concentration ratio is the distribution of two variables in spatial terms (Mruk, 2ŃŃ3). In the light of the interpretation of the method shown in Chart ń, it can be concluded that the closer to the main diagonal of the even distribution is the actual distribution, the lower is the concentration, but it becomes higher as the actual distribution gets more remote from the diagonal.
The Lorenz concentration ratio is a dimensionless measure in the range Ń = k = ń. →here k = Ń, the phe-nomena are spread out evenly, when k = ń – there is a complete concentration.
After a comparative analysis of concentration of revenues in 2ŃńŃ and 2ŃŃř, a slight fall for manufac-turers of foodstuff (including branch I and II) has been observedś seeŚ charts 3 and 4. The likely reason for this change was an increased competition in the mar-ket, forced by post-crisis situation, in which the com-panies were in 2ŃńŃ. They were forced to lead a more aggressive pricing policy to maintain the previous level
10
2010 2009
10.00
Branch I
2010 2009
%UDQĪD,
Branch II
2010 2009
%UDQĪD,,
100 1 000 1 800 10 000
10 100 1 000 1 800 10 000
10 100 1 000 1 800 10 000
Fig. 1. HHI indices in 2ŃŃř and 2ŃńŃ
SourceŚ own elaboration.
Rys. 1. →spółczynniki HHI w 2ŃŃř i 2ŃńŃ roku
ródłoŚ opracowanie własne.
Table 2. Number of analysed enterprises in the years 2ŃŃ8–
2ŃńŃ
Tabela 2. Liczba analizowanych przedsiębiorstw w latach
2ŃŃ8–2ŃńŃ
2ŃŃ8 2ŃŃř 2ŃńŃ ńŃ.ŃŃ ń 3ŃŃ ń 388 ń 74Ń Branch I
Bran a I ń8 2ń 25
Branch II
Bran a II ń3Ń ń37 ń86
of income. The studies carried out on the concentra-tion of producconcentra-tion and the income of the food industry have contributed to a view that its relatively high level is characteristic of the vegetable oil industry (it signifi -cantly exceeds the concentration ratio for the developed countries of the źU). In contrast, the Polish dairy indus-try is characterised by a much lower concentration than in the źU (cf. Urban and Mroczek, 2Ńńń). In the light of these fi ndings it can be concluded that the concentra-tion ratio is very strongly associated with the degree of globalisation of the branch.
Major players and their market shares
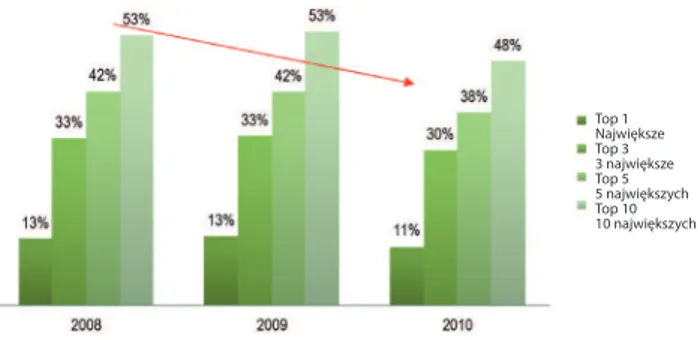
Another part of the analysis concerns the presentation of the market position of the leading companies in the analysed branches. This was done through the prism of the market share of the largest enterprise in the branch, as well as of three, fi ve and ten largest companies.
In assessment of the participation of the largest com-panies of the food industry it can be concluded that the concentration of income is not largeŚ ten biggest enter-prises generate approximately 2Ń% of income, and the “largest market player” generates only 2-3% (with the number of analysed companies in 2ŃńŃ equal to ń74Ń) – fi gure 5.
Distribution of variables in terms of limits of the Lorenz square 5R]NáDG]PLHQQ\FKZXMĊFLXJUDILF]Q\PNZDGUDWX/RUHQ]D
(YHQGLVWULEXWLRQOLQH /LQLDUyZQRPLHUQHJRSRG]LDáX
'LVWULEXWLRQRIDJLYHQYDULDEOH 5R]NáDGGDQHM]PLHQQHM
&XPXODWHGSHUFHQWDJHRIWKHILUVWYDULDEOH 6NXPXORZDQ\RGVHWHNSLHUZV]HM]PLHQQHM
&XPXODWHGSHUFHQWDJHRIWKHVHFRQGYDULDEOH
6NXPXORZDQ\RGVHWHNGUXJLHM]PLHQQHM
Fig. 2. Lorenz curve
SourceŚ Mruk, 2ŃŃ3.
Rys. 2. Krzywa Lorenza
ródłoŚ Mruk, 2ŃŃ3.
Ideal distribution curve .U]\ZDLGHDOQHJRUR]NáDGX
Lorenz curve Krzywa Lorenza
Gini coefficient = 82.8% :VSyáF]\QQLN*LQLHJR
Cumulated market share
6NXPXORZDQ\XG]LDáZU\QNX
Percentage of enterprises 2GVHWHNSU]HGVLĊELRUVWZ
Fig. 3. Lorenz curve in 2ŃńŃ for branch I
SourceŚ own elaboration.
Rys. 3. Krzywa Lorenza w 2ŃńŃ roku dla bran y I
ródłoŚ opracowanie własne.
Ideal distribution curve .U]\ZDLGHDOQHJRUR]NáDGX
Lorenz curve Krzywa Lorenza
Gini coefficient = 72.2% :VSyáF]\QQLN*LQLHJR
Cumulated market share
6NXPXORZDQ\XG]LDáZU\QNX
Percentage of enterprises 2GVHWHNSU]HGVLĊELRUVWZ
Fig. 4. Lorenz curve in 2ŃńŃ for branch II
SourceŚ own elaboration.
Rys. 4. Krzywa Lorenza w 2ŃńŃ roku dla bran y II
The situation is completely different in branch I (fat) (where in 2ŃńŃ number of companies was small – 25). The described situation poses an increased risk for con-centration in the market (due to the oligopolistic ten-dencies in the market organisation). The data show that ten largest companies generate ř6% of revenues of the whole branch, see fi gure 6.
The concentration of income in branch II (dairy products) is bigger than in the entire food industry. In the analysed period, the largest company had approx. ńń% share in revenues of the whole branch, and ten larg-est companies generate nearly 5Ń% of revenues of the whole branch (with ń86 enterprises analysed in 2ŃńŃ) – fi gure 7.
CONCLUSIONS
In the light of the carried out analysis, it can be con-cluded that there were large differences in concentration in the branches selected for the research. The research shows that the fat branch is characterised by a relatively high concentration ratio. Several major manufacturers fi ght for spheres of infl uence in the analysed market. Źue to the weak relative position of suppliers and cus-tomers related to fat manufacturers, companies in the industry are forced to strongly compete in the conditions of limited demand (despite of the fact that they dictate prices to consumers and suppliers).
In contrast, the dairy branch is characterised by a rel-atively low level of concentration, the presence of many manufacturers and the moderate development of com-petition. Thus it should be concluded that the situation and the development opportunities for dairy manufac-turers are different from the ones of fat manufacmanufac-turers. Considering the increasing bargaining power of sup-pliers (farmers and producers of feed) and purchasers (large retailers), dairy producers are “trapped” in the value chain without the possibility of backward or for-ward horizontal integration due to lack of the necessary resources and competencies.
The conducted analysis of prospects for the develop-ment of dairy branch shows a moderate possibility of growth of its revenues. Źevelopment opportunities for fat manufacturers are dependent on market demand po-tential and the possibility of emergence of and support to new market niches.
In conclusion we can say that concentration is a positive phenomenon – it strengthens the position of Top 1
Największe Top 3 3 największe Top 5 5 największych Top 10 10 największych
Fig. 5. Cumulated market shares of the largest companies in
the ńŃ.ŃŃ sector
SourceŚ own elaboration.
Rys. 5. Skumulowane udziały rynkowe największych
przed-siębiorstw w dziale ńŃ.ŃŃ ródłoŚ opracowanie własne.
Top 1 Największe Top 3 3 największe Top 5 5 największych Top 10 10 największych
Fig. 6. Cumulative market share of the largest companies in
branch I
SourceŚ own elaboration.
Rys. 6. Skumulowane udziały rynkowe największych
przed-siębiorstw w bran y I ródłoŚ opracowanie własne.
Top 1 Największe Top 3 3 największe Top 5 5 największych Top 10 10 największych
Fig. 7. Cumulative market share of the largest companies in
branch II
SourceŚ own elaboration.
Rys. 7. Skumulowane udziały rynkowe największych
enterprises in the community and global markets. On the other hand, it supports the tendency to monopolise the Polish industry.
REFERENCES
żP→. Retrieved fromŚ httpŚ//www.gpw.pl/.
Kraciuk, J. (2ŃŃ8). Koncentracja produkcji w polskim prze-my le spo ywczym. Concentration of production in the Polish food industry. Retrieved fromŚ www.wne.sggw.pl/ czasopisma/pdf/PRS_2ŃŃ8_T5(2Ń)_s33.pdf
KRS. Retrieved fromŚ httpŚ//www.infoveriti.pl/.
Mruk, H. (źd.). (2ŃŃ3). Analiza rynku. →arszawaŚ P→ź. Pawlak, K., Poczta, →. (2Ńńń). Międzynarodowy handel
rol-ny. Teorie konkurencyjno ć scenariusze rozwoju. →arsza-waŚ P→ź.
Szwacka-Mokrzycka, J. (2Ńń3). Tendencje rozwojowe popytu i poda y ywno ci w Polsce. →arszawaŚ →yd. Sżż→. Urban, R., Mroczek, R. (2Ńńń). Postępy integracji
europej-skiej w sektorze ywno ciowym. →arszawaŚ IźRiż .
WP
Ł
YW KONCENTRACJI PRODUKCJI NA POZYCJ
Ę
RYNKOW
Ą
WYBRANYCH
BRAN
Ż
PRZEMYS
Ł
U SPO
Ż
YWCZEGO W
POLSCE
Streszczenie. Celem artykułu jest przedstawienie zró nicowania poziomu koncentracji produkcji i jego wpływu na pozycję
rynkową przedsiębiorstw działających w bran y tłuszczowej i przetworów mlecznych. Analizą objęto lata 2ŃŃ8-2Ńń2, obej-mujące kryzys wiatowy i towarzyszącą mu sytuację pokryzysową w Polsce. Z przeprowadzonych bada wynika, e procesy dostosowawcze poda y do popytu rynkowego obejmują zmiany w profi lu wytwórczo ci przedsiębiorstw oraz racjonalizację zachowa podejmowanych w sferze produkcji i gospodarowania zasobami. Źo bada wybrano dwie bran eŚ tłuszczową i prze-tworów mlecznych, odmienne pod względem charakterystyki poda owej i popytowej oraz poziomu koncentracji produkcji. Przedmiotem bada w prezentowanym opracowaniu jest poziom koncentracji produkcji i przychodów wybranych do bada bran przemysłu spo ywczego. → opracowaniu wykorzystano bogaty materiał empiryczny, pochodzący zarówno z bada włas-nych, jak i ródeł wtórnych.
Słowa kluczowe: bran a tłuszczowa, bran a przetworów mlecznych, koncentracja produkcji, pozycja rynkowa przedsiębiorstw
Zaakceptowano do druku – Accepted for print:
Do cytowania – For citation