EPIDEMIOLOGY
OF ACUTE RESPIRATORY
DISEASE AT THE
PEDIATRIC
EMERGENCY
ROOM OF THE SOCIAL SECURITY
MEDICAL
CENTER IN PANAMA CITY, PANAMA’
W. C. Reeves,2 L. Dillman,
E. Quiroz,4 S. Loo,’ S. Luque,6 S. Harris,6
M. M. Brenes,’ M. E. de la Guardia,’ R. Centeno,’ V. SBnchez,’
P. Barrios,’ N. Mendoza,”
L. de Pbrez,” and M. Cuevas”
Within Latin America, longitudinal hospital surveillance studies of acute childhood respiratory diseases are very rare. This article reports the results of one such study conducted at the pediatric emergency ward of the Social Security Hospital in Panama City from March through December 1983. In all, 340 children with lower respiratory tract diseases (primary admission diagnoses of asthma, bronchiolitis, obstructive reversible bronchitis, or pneumonia) were included in the study.
Introduction
Acute respiratory disease (ARD) is a major public health problem throughout Middle Amer- ica, being a particularly important problem for young children. More specifically, it is typically among the first three causes of infant mortality in every country of the region (1). For example, data for Mexico in 1976 show that 27% of all infant deaths in Mexico were attributed to ARD,
‘This article has also been published in Spanish in the September 1984 issue of the Rev&a Medica de la Caja de Seguro Social, (Panama, 16:373-387, 1984). The study re- ported here was partly supported by a research grant from the Pan American Health Organization.
‘Chief, Division of Epidemiology, Gorgas Memorial Lab- oratory, Panama.
3Chief, Pediatric Emergency Room Service, Social Security Metropolitan Medical Center (CHM-CSS), Panama City, Panama.
%2hief, Department of Clinical Virology, Gorgas Memo- rial Laboratory.
‘Epidemiologist, Gorgas Memorial Laboratory. 6Pediatrician, CHM-CSS.
‘Epidemiologist, CHM-CSS.
‘Chief, Clinical Laboratory, CHM-CSS.
‘Chief, Data Processing Department, Gorgas Memorial Laboratory.
%edical Technologist, Clinical Laboratory, CHM-CSS. “Virology Technician, Gorgas Memorial Laboratory.
the resulting apparent mortality being 15 deaths per thousand live births. Data available for Panama in 1978 show a lesser but still marked effect, ARD being held responsible for 10% of all recorded infant deaths (2.2 deaths per thousand live births) (2). ARD is also an impor- tant cause of overall mortality. For instance, ARD was named on 6% of all certified deaths in Panama in 1978, being responsible for 26 deaths per hundred thousand population (2). This death rate is similar to ARD mortality elsewhere in Central America.
In general, pneumonia and other lower respi- ratory diseases are the most important contribu- tors to respiratory disease mortality; indeed, data available for the middle and later 1970s show that diseases diagnosed as influenza or pneumo- nia together tended to constitute the fourth or fifth leading cause of mortality (usually being held responsible for 3% to 8% of all deaths) in most Central American countries. One noteworthy exception to this pattern was Guatemala, where data for 1978 indicate “pneumonia and influenza” accounted for 14% of all deaths (134.5 deaths per 100,000 population) (I). In Panama, pneu- monia was the sixth leading cause of death be- tween 1974 and 1978 (2).
222 PAHO BULLETIN l vol. 19, no. 3, 198.5
Such data demonstrating excess mortality show only part of the burden ARD imposes. In
1978, for instance, 24,000 Panamanian children younger than 1.5 were admitted to public hospi- tals (3), and 24% of all pediatric hospital admis- sions were for treatment of ARD. This latter rate is far higher than the admission rate for trauma, the second most frequent pediatric hos- pital discharge diagnosis, which accounted for 14% of all pediatric hospitalizations. Likewise, during 1980 ARD was the most common reason for pediatric hospitalization in the Panama City Metropolitan Area, accounting for 33% of all admissions to the Children’s Hospital (Hospital de1 Nirio) (3) and 34% of all pediatric admissions to the Social Security Metropolitan Medical Center (4). Overall, 57% of the hospitalized ARD cases were diagnosed as “pneumonia,” 26% as “bronchitis-emphysema-asthma,” and 17% as “other acute respiratory infections”; chil- dren hospitalized for ARD generally spent be- tween 3.9 and 7.3 days as inpatients (3-5). Even more striking, at least 55% of all visits to pediatric emergency rooms in Panama City were for ARD.
Panama’s Social Security System provides complete health care for employed and retired Panamanians and their dependents. A modem So- cial Security Medical Center (CHM-CSS) serves the Panama City Metropolitan Area and is responsible for all pediatric inpatient services. Be- tween 1977 and 1979 the CHM-CSS Pediatric Emergency Room attended 236,948 patients, of whom 11,345 (5%) were admitted to the medical center’s hospital. In total, 34% of all CHM-CSS pediatric admissions were for ARD (4). The five most common diagnoses were pneumonia (15% of the admissions), diarrhea (12%), bronchial asthma (12%), dehydration (lo%), and bron- chiolitis (7%). A recent review article by our group indicated that this general pattern continued through 1982 and 1983 (5).
In order to better understand the clinical epide- miology of ARD at the CHM-CSS Pediatric Emergency Room, we initiated a detailed hospi- tal surveillance study in March 1983. This article reports results of that surveillance program through December 1983. The program’s specific
dromes accounting for ARD in children admitted to the CHM-CSS emergency room; (2) to define populations at high risk for specific ARD syn- dromes; (3) to define risk factors for specific ARD syndromes as well as factors likely to en- hance the severity of various syndromes; and (4) to define the etiologic agents responsible for ARD syndromes. To accomplish these objec- tives, the study recorded summary information on all children with ARD who were seen at the emergency room and collected detailed epide- miologic, clinical, and laboratory data on chil- dren who required hospital admission for ARD.
Materials and Methods
Study Population
The eligible study population included all children below 15 years of age with ARD of less than five days duration who were admitted to the social security hospital beginning on 17 March
1983. All these children were admitted to the pediatric emergency room observation ward and then, if necessary, were transferred to the gen- eral hospital pediatric service.
Gorgas Memorial Laboratory (GML) epide- miology staff members were present at the emer- gency room between 0730 and 2300 hours Mon- day through Friday. In consultation with emer- gency room staff members, they identified eligi- ble patients. If an eligible child was present dur- ing this time period, and if the child’s parents agreed to participate, the patient was included in the study.
Clinical Data
Reeves etal. l ACUTE RESPIRATORY DISEASES 223
form.” At discharge, the chart was again re- viewed and the data were abstracted to a “dis- charge form.” Each discharged patient was given a follow-up appointment at the emergency room clinic two weeks after discharge for the purpose of collecting a specimen of convalescent blood.
Epidemiologic Data
GML epidemiology staff members inter- viewed the parents or guardians of ARD patients who were admitted to the study and recorded information on a standardized epidemiology form. They also helped the emergency room medical staff collect diagnostic specimens and ensured that the specimens were properly main- tained and were sent to the appropriate labora- tory.
Clinical Specimens
Each study patient provided an acute blood specimen at admission and a convalescent blood specimen two weeks following discharge for the purpose of serologic testing. We also collected four nasopharyngeal swab specimens, one each for viruses, Chlamydia, Mycoplasma, and other bacteria. In addition, a tracheal aspirate was ob- tained, using either a DeLee or Lukens trap, and was processed for the same agents. Each tracheal aspirate was examined microscopically, using standard criteria, to assure that the specimen was adequate (6); if necessary, a repeat tracheal aspirate was obtained.
Laboratory Methods
Virology. All specimens intended for viral iso- lation were held on wet ice and inoculated on the day of collection into tube cultures of Vero, HEp-2, and FT cells (7). The Vero and HEp-2 cul- tures were maintained stationary and at 35”C, while the FT cultures were placed in a roller apparatus and kept at 33’C. All the cultures were observed twice weekly for cytopathic effects; negative cultures were discarded at 14 days. Vero cultures with no evidence of cytopathic
effects were hemadsorbed with guinea pig red blood cells at days 5-7 and 12-14 to detect para- influenza virus growth (7). Viral isolates were identified using standard methods (7,8). In order to detect influenza viruses, all specimens were also inoculated into the allantoic and amniotic cavities of embryonated chicken eggs and pro- cessed according to standard methods (7).
Chlamydia and Mycoplasma. Swabs for Chlamydia and Mycoplasma isolation were frozen at -7O’C until processing, which was done twice- weekly. Chlamydia were assayed using a micro- test procedure that involved centrifugation of specimens onto microplate cultures of IUDR- treated McCoy cells, routine blind passage, and examination after iodine staining (9). Myco- plasma cultures were done in both PPLO agar and PPLO broth according to standard methods (7).
Bacteria. Specimens for bacterial isolation were collected using CulturettesB, were trans- ported to the hospital’s clinical laboratory, and were inoculated onto blood agar, chocolate agar (for incubation in 5% CO*), and MacConkey agar. Isolates were identified using standard methods.
Data Processing
All the data forms obtained were checked and coded at the GML Division of Epidemiology according to standard procedures. All clinical, interview, and laboratory information was key- punched, verified, and entered into the GML computer. Files were managed utilizing the CCSS data processing system to maintain, up- date, and analyze patient data (10).
Results
224 PAHO BULLETIN l vol. 19, no. 3, 1985
tract disease (LRD); clinical diagnoses included bronchiolitis, obstructive reversible bronchitis, pneumonia, and asthma.
Between 60% and 74% of these LRD patients had a single clinical admission diagnosis of bron- chiolitis (17 of 27 with bronchiolitis, or 63%), obstructive reversible bronchitis (21 of 28 with obstructive reversible bronchitis, or 7 1%) , pneumonia (37 of 62 with pneumonia, or 60%), or asthma (164 of 223 with asthma, or 74%), the remainder having secondary clinical admis- sion diagnoses. The secondary admission diag- noses included the following: (1) another lower respiratory tract disease--bronchitis, bron- chiolitis, obstructive reversible bronchitis, pneumonia, or asthma; (2) upper respiratory tract disease-nasopharyngitis, pharyngitis, tonsillitis, or disease at multiple sites; (3) major complications of severe lower respiratory tract disease--circulatory or pulmonary failure and dehydration; (4) assorted complications involv- ing sickle cell disease, febrile seizure, or purine reactions; and (5) unrelated diseases-diarrhea, congenital heart disease, etc. In general, the proportion of patients with multiple clinical ad- mission diagnoses was roughly the same in each of the four primary diagnostic categories.
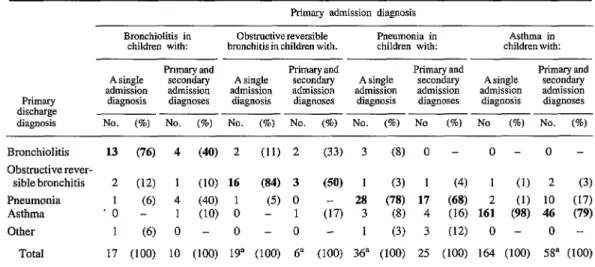
As Table 1 shows, most of the patients in each major admission diagnosis category were discharged with the same primary diagnosis as the one with which they were admitted. There was particularly close agreement between the admission and discharge diagnoses for patients with a single admission diagnosis, and most asthma and pneumonia patients with a secondary admission diagnosis were also given a discharge diagnosis of asthma or pneumonia. However, four of the 10 children (40%) admitted with bronchiolitis and a secondary clinical diagnosis had a discharge diagnosis of pneumonia, and two of the six children (33%) admitted with obstructive reversible bronchitis and a secondary clinical diagnosis were given a discharge diag- nosis of bronchiolitis. As Table 2 indicates, ad- mission chest X-ray findings were consistent with this overall pattern.
The distribution of clinical signs and symptoms on admission was compatible with the various diagnostic categories. For example, 62% of the asthma patients and 59% of the obstructive re- versible bronchitis patients presented to the hos- pital with moderate or severe respiratory dis- tress, as compared to 45% of the bronchiolitis patients and 34% of the pneumonia patients.
Table 1. A comparison of admission diagnoses and discharge diagnoses of study children with primary clinical admission diagnoses of lower respiratory tract disease.
Primary admission diagnosis Bronchiolitis in Obstructivereversible
children with: bronchitis in children with. Pneumonia in children with: children with: Asthma in
Primary discharge diagnosis
Pnmary and Primary and Primary and Primary and
A single secondary A single secondary A single secondary A single secondary admission admission admission admission admission admission admission admission diagnosis diagnoses diagnosis diagnoses diagnosis diagnoses diagnosis diagnoses No. (%) No. (%) No. (o/o) No. (%) No. (o/o) No (so) No (%) No. (%)
Bronchiolitis 13 (76) 4 (40) 2 (11) 2 (33) 3 (8) 0 - 0 - 0 -
Obstructiverever-
sible bronchitis 2 (12) 1 (10) 16 (84) 3 (50) 1 (3) 1 (4) 1 (1) 2 (3)
Pneumonia 1 (6) 4 (40) 1 (5) 0 - 28 (78) 17 (68) 2 (1) 10 (17)
Asthma ‘0 - 1 (10) 0 - 1 (17) 3 (8) 4 (16) 161 (98) 46 (79)
Other 1 (6) 0 - 0 - 0 - 1 (3) 3 (12) 0 - 0 -
Total 17 (100) 10 (100) 19a (100) 6” (100) 36” (100) 25 (100) 164 (100) 58” (100)
Reeves et al. l ACUTE RESPIRATORY DISEASES 225
Table 2. Admission chest X-ray fmdings for children with primary admission diagnoses of lower respiratory tract disease, by type of diagnosis.
Primary admission diagnosis
Radiologic interpretation
Bmnchiolitis
No. of
children @)
Obstructive reversiblebronchitis
No. of
children (%)
Pneumonia
No. of
children (%I
Asthma
No. of
children (%)
Nonnid Alveolar infiltrate Interstitial infiltrate Consolidation Trapped air Trapped air plus
secretions Increased secretions Other
Total
1 (4) 0 - 0
3 (11) 4 (16) ~4
2 (7) 1 (4) 2
0 - 0 - 7
8 (30) 4 (16) 1
7 6’6) 9 (36) 1
5 (18) 4 (16) 5
1 (4) 3 (12) 2
27 (100) 25= (100) 62
(71) (3) (11)
(2)
(2) (8)
(3) (100)
11 11 2 1 47
80 (39)
33 (16)
21 (10)
206” (100)
(3
(5) (1) (0.5) (23)
“The totals shown differ from those indicated in the text because 20 of the patients (three with a primary admission diagno- sis of obstructive reversible bronchitis and 17 with a primary admission diagnosis of asthma) did not have an admission chest X-ray.
Similarly, 62% of the pneumonia patients and 37% of the bronchiolitis patients had admission temperatures in excess of 38”C, as compared to only 22% of the asthma or obstructive reversible bronchitis patients.
There were striking differences in the clinical severity of the patients’ conditions in different diagnostic categories, and this was reflected in the patients’ course within the hospital. That is, 23 (37%) of the 62 pneumonia patients and seven (26%) of the 27 bronchiolitis patients required transfer from the emergency room to the pediat- rics ward, as compared to only two (7%) of the 28 children with obstructive reversible bron- chitis and 12 (5%) of the 223 children with asthma. As would be expected, treatment re- ceived in the hospital also varied according to the problem’s diagnostic category and clinical severity. This variation was most evident with regard to the antibiotic therapy provided for dif- ferent patients. As shown in Table 3, nearly all the pneumonia patients received antibiotics; for patients in other categories, antibiotic therapy was more commonly provided to patients with multiple admission diagnoses.
There was a higher proportion of boys than girls in all diagnostic categories. Specifically, boys accounted for 59% of the bronchiolitis pa- tients, 61% of the obstructive reversible bron- chitis patients, 53% of the pneumonia patients, and 68% of the asthma patients. It should also be noted that the age distributions of the patients differed markedly in the four different diagnostic categories, as shown in Table 4. However, the patients’ distribution by race was similar in the four diagnostic categories. Overall, 76% of the patients were classified as mestizo, 14% as white, 9% as black, and 1% as belonging to other racial groups.
226 PAHO BULLETIN l vol. 19, no. 3, 1985
Table 3. A comparison of the proportion of children in each diagnostic category who received antibiotic therapy while hospitalized.
Primary admission diagnosis
Obstructive
Bronchiobtis reversible bronchitis Pneumonia Asthma
No. receiving /
No. No recewing No No receiving No- No. recewing No
antibiotics admitted (%I antibiotics / admitted (o/o) antibiotics / admitted (%) antlblotics / admltted (%)
Patients with one admission diag- nosis
Patients with more than one admis- sion diagnosis
2117 (12) 3121 (14) 35137 (95) 8/164 (5)
6110 (60) 217 (2% 24125 (96) 32159 (54)
Table 4. The ages of the 340 study children, grouped according to primary admission diagnosis.
Pronary admission diagnosis
Age group
Bronchiolitis
No. of
patients (%)
Obstructive reversible bronchitis
No. of
patients (%)
Pneumonia Asthma
No. of No. of
patients (%) patients (%)
O-5 months 6-l 1 months 1 year 2 years 3 years 4 years 5-9 years 2 10 years
15 (55) 2
8 (30) 9
3 (11) 11
1 (4) 2
0 1
0 2
0 - 1
0 - 0
(7) 9
(32) 12
(39) 9
(7) 14
(4) 8
(7) 3
(4) 6
- 1
(14) 1 (0.5)
(19) 4 (2)
(14) 21 (9)
(23 35 (16)
(13) 21 (9)
(5) 28 (13)
(10) 90 (40)
(2) 23 (10)
Total 27 (100) 28 (100) 62 (100) 223 (100)
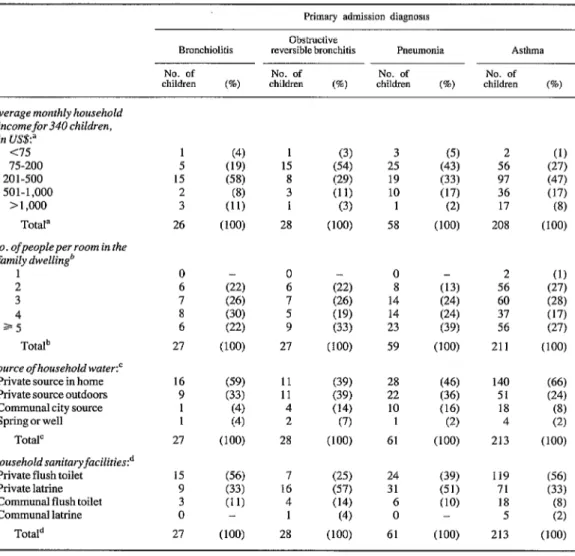
was US$ZOO or less. This difference is statistical- ly significant (X2= 16.85; pC.001). Similarly, 59% of the children with obstructive reversible bronchitis or pneumonia, as compared to 45% of those with bronchiolitis or asthma, lived in homes where four or more people shared one bedroom (X*=5.20; pC.025); 81% as com- pared to 90% came from homes served by city water (X2 = 4.90; p< .05); and 35% as compared to 56% lived in homes with private flush toilets (X2= 11.5; pC.001).
Family composition was similar in all four diagnostic categories. That is, 79% of the study children came from two-parent families, and most of the rest (17%) came from families with a female head of household. Only 20% of the study subjects were only children, and the per- centage of only children was similar in all diag- nostic categories. Likewise, the ages of the pa- tients’ siblings did not appear to differ signifi- cantly from one diagnostic category to another.
Reeves et al. l ACUTE RESPIRATORY DISEASES 227
Table 5. Socioeconomic data on the 340 study subjects’ families-including average monthly household income, the average number of people living in each room of the family dwelling, the source of household water,
and the nature of available toilet facilities.
Primary admission diagnoses
Bronchiolitis No. of children (%)
Obstructive reversible bronchitis No. of
children (%I
PncIluKJllia Asthma
No. of No. of
children W) children @)
Average monthly household incomefor children, in lJS$:”
<I5 75-200 201-500 501-1,000
> 1,000 Total=
No. ofpeopleper room in the family dwellingb
1 2 3 4 25 To&
Source ofhousehold water:’ Private source in home Private source outdoors Communal city source Spring or well
Total’
Household sanitaryfacilities? Private flush toilet Private latrine Communal flush toilet Communal latrine
TotaId
1 (4) 1 (3) 3 (5) 2 (1)
5 (1% 15 (54) 25 (43) 56 (27)
15 (58) 8 (2% 19 (33) 97 (47)
2 (8) 3 (11) 10 (17) 36 (17)
3 (11) 1 (3) 1 (2) 17 (8)
26 (100) 28 (100) 58 (100) 208 (100)
0 6 7 8 6 27 (22) (26) (30) (22) (100) 0 6 7 5 9 27 (22) (2’3 (1% (33) (100) 0 8 14 14 23 59 (13) (24) (24) (3% (100)
2 (1)
56 (27)
60 (28)
37 (17)
56 (27)
211 (100)
16 (5% 11 (3% 28 (46) 140 (66)
9 (33) 11 (39) 22 (36) 51 (24)
1 (4) 4 (14) 10 (16) 18 (8)
1 (4) 2 (7) 1 (2) 4 (2)
27 (100) 28 (100) 61 (100) 213 (100)
15 (56) 7
9 (33) 16
3 (11) 4
0 - 1
(25) (57) (14) (4) (100) 24 31 6 0
27 (100) 28 61
(3% (51) (10) - (100) 119 71 18 5 213 (56) (33) (8) (2) (100)
aAverage monthly household income unlcllown in 20 cases. bOccupancy level (people per room) unknown in 16 cases. ‘Type of household water source unknown in 11 cases. dType of household sanitary facility unknown in 11 cases.
228 PAHO BULLETIN l vol. 19, no. 3, 1985
of the asthma patients had been hospitalized within the preceding three months because of acute respiratory disease.
Both these patterns of previous illness and the nature of the primary diseases involved were reflected in the length of time that symptoms persisted before study subjects consulted the CHM-CSS pediatric emergency room. As Table 7 shows, children with acute obstructive airway diseases (asthma and obstructive reversible
bronchitis) tended to seek medical care relatively early, while 33% and 40% of those with pneumo- nia and bronchiolitis, respectively, came to the emergency room after two or more days of illness.
In addition, there was a significant association between antibiotic treatment prior to admission and the admission diagnosis. Specifically, three (11%) of the 27 subjects with bronchiolitis, two (7%) of the 28 with obstructive reversible bron- chitis, 10 (17%) of the 60 with pneumonia, and
Table 6. Past histories of acute respiratory disease among those 225 study subjects with only one admission diagnosis for whom past histories were available.’
Admission diagnosis
17 oatients with bknchiolitis
NO. (%)
16patients with obstructive reversible bronchitis
NO. (%)
28 Datlents 164 Datients
with &unonia
NO. (%I
with ‘asthma
NO. (%)
Prior medical attention for acute respiratory disease”
Child previously visited a physician for acute respiratory disease
Child was hospitalized more than three months previously for acute respiratory disease Child was hospitalized within the
last three months for acute respiratory disease
5 (29) 16 (76) 28 (78) 145 (91)
1 (6) 6 (29) 16 (44) 109 (68)
1 (6) 4 (1% 9 (2% 39 (24)
“Prior medical attention was unknown for 14 of the 239 children with a single admission diagnosis.
bThe items listed are not mutually exclusive; for example, the same child with chronic or recurrent disease could have received all three types of care listed.
Table 7. The duration of acute respiratory disease symptoms experienced by the 340 study subjects before arrival at the CHM-CSS Pediatric Emergency Room.
Primary admission diagnosis
Radiologic interpretation
Bronchiolitis
No. of
children (%)
Obstructive reversible bronchitis
No. of
children (%I
Pneumonia
No. of
children (%)
Asthma
No. of
children (So)
<12 hours 7 cm 9 (32) 17 (27) 105 (47)
12-13 ” 8 (30) 11 (3% 14 (2% 84 (38)
24-47 ” 3 (11) 3 (11) (10) 22 (10)
5 48 9 (33) 5 (18)
2:
( 40) 12 (5)
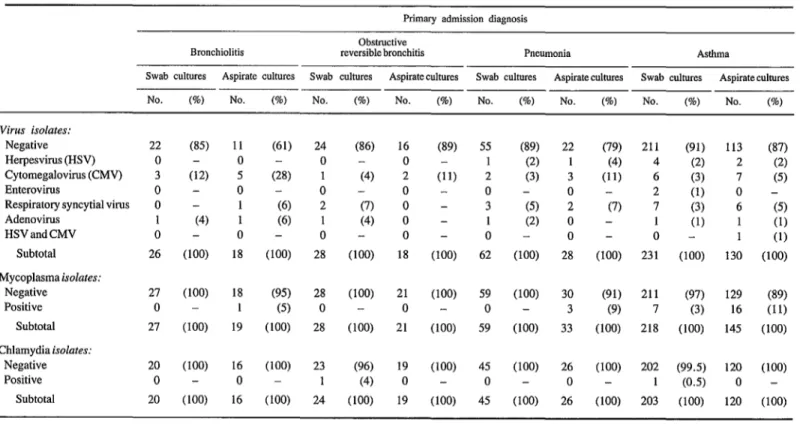
Table 8. Viral, mycoplasmal, and cblamydial isolates obtained from cultures of swab and aspirate specimens provided by the study subjects.
Primacy admission diagnosis Obstructive
Bronchiolitis reversible bronchitis Pneumonia Asthma
Swab cultures Aspirate cultures Swab cultures Aspirate cultures Swab cultures Aspirate cultures Swab cultures Aspirate cultures
No. (o/o) No. (%) No. (%) No. 6’0) No. (%) No. 6) No. (%) No. (%)
Virus isolates:
Negative 22 (85) 11 (61) 24 (86) 16 (89) 5.5 (89) 22 (79) 211 (91) 113 (87)
Herpesvirus (HSV) 0 - 0 - 0 - 0 - 1 (2)
:
(4) 4 (2) 2 (2)
Cytomegalovirus (CMV) 3 (12) 5 (28) 1 (4) 2 (11) 2 (3) (11) 6 (3) 7 (5)
Enterovirus 0 - 0 - 0 - 0 - 0 - 0 - 2 (1) 0 -
Respiratory syncytial virus 0 - 1 (6) 2 (7) 0 - 3 (5) 2 (7) 7 (3) 6 (5)
Adenovirus 1 (4) 1 (6) 1 (4) 0 - 1 (2) 0 - 1 (1) 1 (1)
HSV and CMV 0 - 0 - 0 - 0 - 0 - 0 - 0 - 1 (1)
Subtotal 26 (100) 18 (100) 28 (100) 18 (100) 62 (100) 28 (100) 231 (100) 130 (100)
Mycoplasma isolates:
Negative 27 (100) 18 (95) 28 (100) 21 (100) 59 (100) 30 (91) 211 (97) 129 (89)
Positive 0 - 1 (5) 0 - 0 - 0 - 3 (9) 7 (3) 16 (11)
Subtotal 27 (100) 19 (100) 28 (100) 21 (100) 59 (100) 33 (100) 218 (100) 145 (100)
Chlamydia isolates:
Negative 20 (100) 16 (100) 23 (96) 19 (100) 45 (100) 26 (100) 202 (99.5) 120 (100)
Positive 0 - 0 - 1 (4) 0 - 0 - 0 - 1 (0.5) 0 -
230 PAHO BULLETIN l vol. 19, no. 3, 1985
six (3%) of the 218 with asthma were treated September, and October (Table 9). Mycoplasnza, with antibiotics prior to consulting the emergen- as the table also shows, was isolated primarily cy room (Xg= 16.64; pc.001). from asthma patients.
As Table 8 shows, viral, chlamydial, and mycoplasmal isolation rates were low in all diag- nostic categories. We did not isolate influenza or parainfluenza viruses from any study patient. Isolation of bacteria did not fit any logical picture either with respect to pathogenic agents or clin- ical syndromes. We have modified our bacte- riologic criteria for the remainder of the study, and serologic studies for viral agents are not yet completed. Respiratory syncytial virus occurred equally in all clinical syndromes, but the agent was only isolated between June and November with most of the isolations occurring in August,
Discussion and Conclusions
This is one of the first detailed, longitudinal hospital surveillance studies of acute respiratory disease (ARD) reported from Latin America. In all, 89% of the children admitted to the CHM-CSS pediatric emergency ward with ARD during the study period had a primary clinical diagnosis of bronchiolitis, obstructive reversible bronchitis, pneumonia, or asthma. This finding is similar to that of our previous analysis of CHM-CSS ARD admission between 1977-1979 (5) and is also
Table 9. Respiratory syncytial virus (RSV) and Mycoplasma isolates, by month of isolation and the
patient’s diagnostic category.
Primary admission diagnosis
Bronchiolitis Pneumonia Asthma Total
RSV isolations in: Ma APT May Jun Jul Ax Sep Ott Nov Dee Mycoplasma iso-
lations in: MaI. Apr May Jun Jul Aug Sep Ott Nov O/l o/4 O/10 o/4 o/9 l/8 117 115 l/4 016 O/l o/4 o/10 Of4 o/9 O/8 l/7 o/5 o/4 O/6 - - - (13) (14) (20) (23 - - - - - - (14) o/5 O/8 o/13 o/14 O/6 l/3 214 o/3 O/l o/3 o/5 O/8 o/14 2114 l/6 o/3 014 o/3 O/l o/3 0112
- O/26
- 0131
- 5/30
- 0131
(33) 3125
(50) 1118
1112 O/8 O/26
- o/12
- 2127
513 1
(14) 513 1
(17) 313 1
- 4125
- 3118
- o/12
- 218
- O/26
Reeves et al. a ACUTE RESPIRATORY DISEASES 231
similar to the experience of others (II). The fact that clinical diagnostic standards were consistent was indicated by the close correlation between ad- mission and discharge diagnoses (Table 1). Most of the patients had a single clinical admission diagnosis, and of these 92% were discharged with the same diagnosis. A quarter of the children had a secondary admission diagnosis; of these, 79% of the asthma patients with a secondary admission diagnosis were discharged as asthma patients, and 68% of the pneumonia patients with a secondary admission diagnosis were discharged as pneumonia patients. As Table 1 shows, how- ever, four (16%) of the pneumonia patients with a secondary admission diagnosis were dis- charged as asthma patients; and 10 (17%) of the asthma patients with a secondary diagnosis were discharged as pneumonia patients. Regarding these latter changes, it should be noted that serial chest films following adequate rehydration and adrenalin treatment are often needed to distin- guish pneumonia from asthma in children who present with fever and dehydration (12).
The correlation between admission and dis- charge diagnoses was somewhat more disparate for patients admitted with a primary diagnosis of bronchiolitis or obstructive reversible bronchitis who also had a secondary admission diagnosis. Four (40%) of the bronchiolitis patients in this category were discharged as pneumonia patients; two (33%) of the obstructive reversible bron- chitis patients in this category were discharged as bronchiolitis patients; and one (17%) of the bronchiolitis patients in this category was dis- charged as an asthma patient. Most of the pa- tients involved were children less than one year old who arrived with fever and dehydration, and for whom a clear clinical and radiologic diag- nosis was developed after their initial treatment and stabilization in the emergency room.
The hospital treatment provided was consis- tent with the admission diagnoses. The majority of children with reversible obstructive airway disease were successfully treated in the emer- gency room. ln contrast, 26% of the bronchiolitis patients and 37% of the pneumonia patients re- quired admission to the pediatrics ward for two
with pneumonia receive antibiotic therapy, as they did during this study, because bacterial dis- ease cannot be ruled out with certainty (13). For other syndromes, antibiotic treatment (see Table 3) varied significantly for patients with one ad- mission diagnosis as compared to those with multiple admission diagnoses. Only 5% to 14% of the children with a single uncomplicated ad- mission diagnosis of asthma, bronchiolitis, or obstructive reversible bronchitis received anti- biotic therapy while at the hospital. Ine contrast, 54% of the patients with asthma and a secondary admission diagnosis received antibiotics, as did six (60%) of the patients with bronchiolitis and a secondary admission diagnosis.
In the United States bronchiolitis is almost always a viral disease (14). It is uncertain, how- ever, whether or not this is true in Panama or other tropical areas. In very young children the clinical and radiologic picture may suggest pos- sible pneumonia, and the leukocyte count may be elevated. Such children may have a secondary differential diagnosis and may receive antibiotic therapy to cover possible bacterial pneumonia. The age distribution of patients in this study was consistent with their clinical diagnoses. Bronchiolitis is an acute nonrecurrent disease of infancy, with the peak incidence occurring among patients less than six months old. Infants with repeat occurrences of bronchiolitis-like syndromes are more appropriately diagnosed as having obstructive reversible bronchitis (14). A variable proportion of children with obstructive reversible bronchitis continue as asthmatics (14, 1.5). Pneumonia, in contrast, encompasses all pediatric age groups and in many cases is a com- plication of the other clinical entities (16).
232 PAHO BULLETIN l vol. 19, no. 3, 1985
as ours, conducted within a single hospital set- ting, have not previously been published. Also, we are unaware of other studies indicating that children with obstructive reversible bronchitis typically come from socioeconomic backgrounds similar to those of children with pneumonia.
Obstructive reversible bronchitis may reflect an asthmatic respiratory response to common in- fection by the same viral agents that cause pneu- monia (14), and such an infectious etiology might be more common in crowded lower-class conditions. On the other hand, asthma is clearly an allergic phenomenon that, like some other allergic disorders, could be more common among children who are socioeconomically better off. Bronchiolitis is almost exclusively a problem of infancy, and its incidence patterns could reflect relative degrees of parental concern rather than clinical severity.
In addition to socioeconomic risk factors, many of the children with asthma, pneumonia, and obstructive reversible bronchitis had previous histories of acute respiratory disease. More than 75% of the children with these diagnoses had re- ceived formal medical care for ARD in the past, and approximately 25% had been hospitalized for ARD during the three months preceding the hospitalization studied. In thus appears that if these patients could be identified and followed more closely after the first hospital discharge, subsequent admissions might be avoided.
In this regard, the study children with pneu- monia offer a particularly appropriate example. Forty per cent of the pneumonia patients in this study waited more than 48 hours before being taken to seek medical treatment, and 17% re- ceived home antibiotic treatment before going to the CHM-CSS pediatric emergency room. If these children had been singled out and iden- tified for prompt intervention at the neighbor- hood health center, perhaps much of the excess
proportion of pneumonia patients requiring hos- pitalization would have been avoided.
Finally, brief mention should be made of our attempts to isolate etiologic agents from these patients. Up to now, no consistent pattern of bacterial isolation has become apparent. Diffi- culty using noninvasive techniques to isolate bacteria from children with pneumonia is a com- mon problem (18), and the role of bacteria as etiologic agents of pediatric lower respiratory disease is controversial (11, 16). A significant proportion of our study patients were treated with antibiotics before admission, and this may have contributed to low bacterial isolation rates. Most acute respiratory tract specimens yielded negative virus cultures, and we have yet to iso- late influenza or parainfluenza viruses from any study patient. In other studies of pediatric ARD, parainfluenza virus was an important etiologic agent (15, 19). We have not yet screened paired sera, and so the overall pattern of viral infection is unknown. However, respiratory syncytial virus (RSV) was the most commonly isolated single virus, a finding in keeping with findings of other studies (14, 15, 19, 20). Also, as Table 9 shows, RSV was isolated most consistently from children with bronchiolitis and showed a definite seasonal pattern, being isolated most commonly between August and November. Consultations for influenza-like illness at Health Ministry health centers also peaked during these months; in the United States, RSV is most com- mon during these same months (16, 21).
Reeves et al. 0 ACUTE RESPIRATORY DISEASES 233
ACKNOWLEDGMENTS
The authors wish to acknowledge the assistance of Gladys Oro, Berta Cedefio, Marita Ramos, Alaluz De Ince, and Edmund0 Chandler, with- out whom this study could not have been performed. We are also grateful for the collaboration of Dr. Ricardo Lawrence, Dr. Rosalia Quintero, and Linda Grayston, as well as the members of the medical staff, residents, and nurses of the Social Security Hospital Pediatric Emergency Room, whose enthusiastic cooperation was vital to this work. Thanks are also extended to Drs. Gabriel Schmunis, George Alleyne, and Fabio Luelmo at the headquarters of the Pan American Health Organization in Washington, D.C., for helping us initiate the study, for their support during the early phases, and for numerous helpful suggestions.
SUMMARY
Acute respiratory disease (ARD) accounts for ap- proximately one-third of all pediatric hospital admis- sions in the metropolitan area of Panama City, Panama. In order to describe the epidemiology of ARD and define risk factors, a surveillance study was initiated at the Pediatric Emergency Room of the So- cial Security Metropolitan Medical Center in Panama City. Between March and December 1983,383 children were admitted to the emergency room because of ARD and were enrolled in the study; 340 (89%) had a primary clinical diagnosis of bronchiolitis, obstructive reversible bronchitis, pneumonia, or asthma.
Overall, 60% of the asthma and obstructive rever- sible bronchitis patients presented with moderate to severe respiratory distress, but only 6% required hos- pitalization for more than 48 hours. In contrast, 30% of the bronchiolitis or pneumonia patients were hospi- talized for more than two days. Regarding socioeco-
nomic status, significantly more of the obstructive reversible bronchitis and pneumonia patients (as com- pared to the asthma and bronchiolitis patients) came from families living in relatively poor socioeconomic conditions.
The study children’s antecedent medical histories covarled with their diagnostic categories. Among other things, approximately 25% of the pneumonia and asthma patients had been admitted to the hospital for ARD in the three months preceding their enroll- ment in the study.
Regarding viral and bacterial disease agents, re- spiratory syncytial virus was the virus most frequently isolated from the study subjects, with most of the iso- lations occurring between August and November. Mycoplasma, which was also found frequently, was isolated from approximately 11% of all the asthma patients.
REFERENCES
234 PAHO BULLETIN l vol. 19, no. 3, 198.5
(4) Dillman, L., M. Diaz, and D. Lee. Revision estadistica de 10s pacientes atendidos en la sala de observation de urgencia pediatrica de1 CHMCSS durante el period0 comprendido entre el 1 de enero 1977 al 3 1 de diciembre 1979. Boletin de la Sociedad Panameiia de Pediatria 11:28-31, 1982.
(5) Reeves, W. C., L. Dillman, E. Quiroz, and R. Centeno. Opportunities for studies of children’s respiratory infections in Panama. Pediatr Res
17:1045-1048, 1983.
(6) Geckler, R. W., D. H. Gremillion, C. K. McAllister, and C. Ellenbogen. Microscopic and bac- teriological comparison of paired sputa and trans- tracheal aspirates. JClinMicrobiol 6:396-399, 1977. (7) Lennette, E. H., and N. J. Schmidt (eds.). Diagnostic Procedures for Viral, Rickettsial, and Chlamydial Infections (j‘?fth edition). American Public Health Association, Washington, D.C., 1979.
(8) Cooney, M. K., C. E. Hall, and J. P. Fox. The Seattle virus watch: III. Evaluation of isolation methods and summary of infections detected by virus isolations. Am J Epidemiol96:286-305, 1972.
(9) Yoder, B. L., W. E. Stamm, C. M. Koester, and E. R. Alexander. Microtest procedure for isola- tion of Chlamydia trachomatis. J Clin Microbial 13:
1036-1039, 1981.
(10) Kronmal, R. A., L. Bender, and J. Mortena- sen. A conversational statistical system for medical records. Journal of the Royal Statistical Society (Series C) 19:82-92, 1970.
(II) Pan American Health Organization. Acute Respiratory Infections in Children. PAHO Document RD21/1. Washington, D.C., 1983.
(12) Gershel, J., H. S. Goldman, R.E.K. Stein, S. P. Sheldon, and M. Ziprkowski. The usefulness of chest radiographs in first asthma attacks. N Engl J Med 309:336-339, 1983.
(13) Boyer, K. M., and J. D. Cherry. Nonbacterial Pneumonia. In: R. D. Feigin and J. D. Cherry. Text- book of Pediatric infectious Diseases. Saunders, Philadelphia, 198 1. pp. 186- 193.
(14) Cherry, J. D. Bronchiolitis and Asthmatic Bronchitis. In: R. D. Feigin and J. D. Cherry. Text- book of Pediatric Infectious Diseases. Saunders, Philadelphia, 1981. pp. 178-186.
(15) Evans, H. E. Infections of the Lower Respi- ratory Tract in Infancy and Early Childhood. In: J. E. Pennington (ed.). Respiratory infections, Diag- nosis, and Management. Raven Press, New York, 1983. pp. 143-158.
(16) Murphy, T. F., F. W. Henderson, W. A. Clyde, A. M. Collier, and F. W. Denny. Pneumonia: An eleven-year study in a pediatric practice. Am J Epidemiol 113:12-21, 1981.
(17) Bulla, A., and K. L. Hitze. Acute respiratory infections: A review. Bull WHO 56:481-498, 1978. (18) Glezen, P. W. Viral pneumonia as a cause and result of hospitalization. J Infect Dis 147:765- 770, 1983.
(19) Monto, A. S., and K. M. Johnson. A commu- nity study of respiratory infections in the tropics: I. Description of the community and observations on the activity of certain respiratory agents. Am J Epidemiol 86:78-92, 1967.
(20) Kimball, A. M., H. M. Foy, M. K. Cooney, I. D. Allan, M. Matlock, and J. J. Plorde. Isolation of respiratory syncytial and influenza viruses from the sputum of patients hospitalized with pneumonia. J infect Dis 147:181-184, 1983.