Effect of daily diet change from the start of
lactation to the peak of lactation diet on ruminal pH
with pH courses and changes during the feed day
Vplyv zmeny k
ŕ
mnej dávky z rozdoja na k
ŕ
mnu
dávku na vrchole laktácie na ruminálnu pH s
denným vývojom a zmenami pH po
č
as k
ŕ
mneho
d
ň
a
Ondrej HANUŠOVSKÝ*, Daniel BÍRO, Milan ŠIMKO, Branislav GÁLIK, Miroslav JURÁČEK, Michal ROLINEC and Róbert HERKEĽ
Department of Animal Nutrition, Slovak University of Agriculture in Nitra, Tr. A. Hlinku 2, Nitra, Slovak Republic, *correspondence: hanusovsky.ondrej@gmail.com
Abstract
The aim of the study was to find the effect of daily diet change from the start of lactation diet (SL) to the peak of lactation diet (PL) taking account into the lactation number (2nd lactation – groups S2L, P2L; 3rd lactation – groups S3L, P3L) using continuous monitoring of ruminal pH using e-bolus at school experimental farm in Oponice. Animals (7 Holstein cows) were fed once with Total Mix Ratio ad libitum
(between 4:00 and 5:00) and milked 3 times per day (6:00, 12:00 and 18:00). The bolus which was implemented through Esophagus measured pH and temperature
values every 15 minutes (96 data points per day) with accuracy ± 0.1 pH. Data were downloaded and collected with HathorHBClient v. 1.8.1 and statistically evaluated with IBM SPSS v. 20.0 (One-way ANOVA, Tukey Test, Indipendent Samples T-Test). The statistically significant difference (0.74%; P < 0.01) in the daily pH mean between SL and PL diet was found. Dairy cows in the SL group had average pH 6.30 ± 0.34 and in the PL group 6.25 ± 0.33. The daily pH mean of dairy cows in the 2nd lactation 6.45 ± 0.28 (S2L), 6.39 ± 0.25 (P2L) and in the 3rd lactation 6.14 ± 0.32 (S3L), 6.14 ± 0.34 (P3L) was determined. In the S3L (1.12 ± 1.20%) and P3L (1.19 ± 1.19%) group faster decrease of pH values during 6 hours after feeding than in the S2L (0.75 ± 0.41%) and in the P2L (0.55 ± 0.34%) group was found. During night better recover ability of pH values in the S3L (1.62 ± 0.88%) and P3L (2.10 ± 0.90%) group than in the S2L (1.00 ± 0.57%) and in the P2L (1.11 ± 0.70%) group per hour was observed. Overall 8.9% of measured pH under 5.8 in the SL group and 11.9% in the PL group was found. The S2L group had pH under the threshold 5.8 from measured values 1.6% and P2L group only 1.1%. On the other side the pH values in the S3L group formed 16.3% and in the P3L group 20.8%.
Keywords: daily diet change, lactation number, pH changes, pH monitoring, ruminal
Abstrakt
Cieľom štúdie bolo zistiť vplyv zmeny kŕmnej dávky skrmovanej na začiatku laktácie (SL) na kŕmnu dávku skrmovanú na vrchole laktácie (PL) s prihliadnutím na poradie laktácie (2. laktácia skupiny – S2L, P2L; 3. laktácia skupiny – S3L, P3L) využitím kontinuálneho monitoringu ruminálnej pH e-bolusom na univerzitnej experimentálnej farme v Oponiciach. Zvieratá (7 holsteinských dojníc) boli kŕmené raz denne
zmiešaninovou kŕmnou dávkou ad libitne (medzi 4:00 a 5:00) a dojené tri krát denne (6:00, 12:00 a 18:00). Bolus, ktorý bol zavedený cez pažerák, monitoroval pH
a teplotu každých 15 minút (96 dátových bodov denne) s presnosťou ± 0.1 pH. Namerané údaje boli stiahnuté a skompletizované pomocou HathorHBClient v. 1.8.1 a štatisticky vyhodnotené pomocou IBM SPSS v. 20.0 (Jednosmerná ANOVA, Tukeyho Test, Test nezávislých hodnôt T-Test). Boli zistené štatisticky preukazné rozdiely (0.74%; P < 0.01) v priemernej dennej pH medzi skupinami SL a PL. Dojnice v skupine SL mali priemernú dennú pH 6.30 ± 0.34 a v skupine PL 6.25 ± 0.33.
Priemerná denná pH bola zistená u dojníc na druhej laktácii 6.45 ± 0.28 (S2L), 6.39 ± 0.25 (P2L) a na tretej laktácii 6.14 ± 0.32 (S3L), 6.14 ± 0.34 (P3L). V S3L (1.12 ± 1.20%) a P3L (1.19 ± 1.19%) skupine bol zistený rýchlejší pokles pH počas šiestich hodín po nakŕmení ako v skupine S2L (0.75 ± 0.41%) a P2L (0.55 ± 0.34%). Počas noci bola zistená lepšia schopnosť stabilizácie pH v skupinách S3L (1.62 ± 0.88%) a P3L (2.10 ± 0.90%) ako v skupinách S2L (1.00 ± 0.57%) a P2L (1.11 ± 0.70%). Celkovo 8.9% z nameraných hodnôt boli pod pH 5.8 v skupine SL a v skupine PL 11.9 %. Skupina S2L mala pod hranicou pH 5.8 1.6% a skupina P2L len 1.1%
hodnôt. Na druhej strane pH hodnoty pod touto hranicou tvorili v S3L skupine 16.3% a v P3L skupine 20.8%.
Kľúčové slová: bachorová pH, monitoring pH, poradie laktácie, zmena kŕmnej
dávky, zmeny pH
Introduction
High-producing dairy cattle require large amounts of dietary energy to meet the demands of increased milk production. To accommodate this energy requirement, it has often been economical for producers to feed large amounts of cereal grains to provide energy to rumen microbes and their host (Kleen et al., 2003; Stone, 2004). In a survey of field nutritionists, dietary starch concentration in rations for lactating dairy cattle that supported both positive production and health were between 15 to 25% of ration DM (Hall and Eastridge, 2014).The optimal concentration of non-structural carbohydrates (NSC) or nonfibrous carbohydrate (NFC) in diets for lactating cows is not well defined. To avoid acidosis and other metabolic problems, the maximum concentration of NSC should be approximately 30 to 40 percent of the ration dry matter (DM) (Nocek, 1997). Fermentation of feedstuffs in the reticulo-rumen produces volatile fatty acids (VFA) and lactic acid. These acids can
protozoa numbers, lower milk fattening but higher milk proteins what is caused by higher starch content (Hassant et al., 2013). Subacute ruminal acidosis (SARA) is defined as periods of moderately depressed ruminal pH (about 5.5–5.0) that are between acute and chronic in duration (Garrett et al., 1999). Lactic acid does not consistently accumulate in the ruminal fluid of dairy cattle affected with SARA. The depression of ruminal pH in dairy cattle with SARA is apparently due to the total accumulation of volatile fatty acids (VFA) alone and is not due to lactic acid
accumulation (Oetzel et al., 1999). Subacute ruminal acidosis is a common disease in high yielding dairy cows that receive highly digestible diets, and has a high
economic impact. Due to the limited information on the prevelance of this disease and the non-specific nature of many of its manifestations, the importance of SARA is not fully appreciated. This disease not only affects feed intake and milk production, but can also compromise cow health by causing diarrhea, laminitis, liver abscesses, production of bacterial immunogens, and inflammation. Many of the mechanisms by which depression of rumen pH compromises cow health are not well understood (Plaizier et al., 2008). Measurement of pH values can by realised using rumen fistula, oro – ruminal probe, rumenocentesis and boluses (Duffield et al., 2004; Geishauser, 1993; Mottram et al., 2008; Nordlund and Garret, 1994). The main goal of this
research was to find the effect of daily diet change from the start of lactation diet to peak of lactation diet taking account into the lactation number using continuous monitoring of ruminal pH using boluses.
Materials and methods
Animals and Housing
Measured data from 7 dairy cows of Holstein breed (average age 3.57) in
cooperation with the University Experimental Farm in Oponice during 30 days were collected. Selected cows have average milk production 10 175 kg per lactation with 3.94% of fats, 3.10% of crude proteins and 4.7% of lactose. Dairy cows were 15 days fed with daily diet at the start of lactation and after that was daily diet changed for another 15 days to diet for dairy cows at the peak of lactation. Three of selected animals were in the 2nd lactation and 4 in the 3rd lactation. Experimental cows were loose housed with laying boxes system and automatic manure scraper in the manure corridor in the groups with another dairy cows together. Daily diet on the feeding table was folded.
Feeding
Animals were fed once daily with Total Mix Ratio (Table 1.) ad libitum between 4:00
alfalfa silage acidity (pH 4.85) with Sodium Bicarbonate (daily 550 g*head-1) and Magnesium Oxide (daily 51 g*head-1) were neutralised.
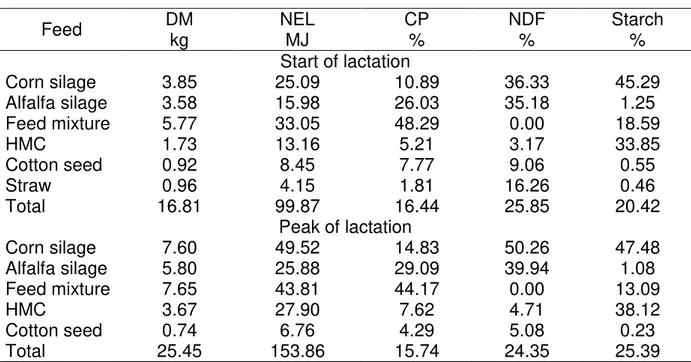
Table 1. Composition of daily diets Tabuľka 1. Zloženie kŕmnych dávok
Feed DM kg NEL MJ CP % NDF % Starch %
Start of lactation
Corn silage 3.85 25.09 10.89 36.33 45.29
Alfalfa silage 3.58 15.98 26.03 35.18 1.25
Feed mixture 5.77 33.05 48.29 0.00 18.59
HMC 1.73 13.16 5.21 3.17 33.85
Cotton seed 0.92 8.45 7.77 9.06 0.55
Straw 0.96 4.15 1.81 16.26 0.46
Total 16.81 99.87 16.44 25.85 20.42
Peak of lactation
Corn silage 7.60 49.52 14.83 50.26 47.48
Alfalfa silage 5.80 25.88 29.09 39.94 1.08
Feed mixture 7.65 43.81 44.17 0.00 13.09
HMC 3.67 27.90 7.62 4.71 38.12
Cotton seed 0.74 6.76 4.29 5.08 0.23
Total 25.45 153.86 15.74 24.35 25.39
abbreviations: dry matter (DM), netto energy of lactation (NEL), crude protein (CP), neutral detergent fiber (NDF), high moisture corn (HMC)
skratky: sušina (DM), netto energia laktácie (NEL), dusíkaté látky (CP), neutrálne detergentná vláknina (NDF), vlhké miagané zrno (HMC)
Table 2. Structural analysis of daily diets Table 2. Štrukturálna analýza kŕmnych dávok
Sieve Start of lactation x̄ SD Peak of lactation x̄ SD
19 mm 7.75 1.86 3.13 0.70
8 mm 42.57 1.46 42.20 5.57
4 mm 18.06 1.20 22.40 0.40
Bottom pan 31.57 2.38 32.27 6.56
abbreviations: sample mean (x̄), standard deviation (SD), milimetres (mm) skratky: priemer vzorky (x̄), smerodajná odchýlka (SD), milimetre (mm)
Data measuring, data collecting and statistical evaluation
Every dairy cow had implemented farm bolus for continual data measuring which was implemented through esophagus orally with the use of special balling gun. Ruminal
day) with accuracy ± 0.1 for pH. Used boluses (eCowDevon, Ltd., Great Britain) are characteristic with its small dimensions (135 * 27 mm) and weight 207 g. Data with the handset with antenna and dongle connected with USB dongle connector with the radio frequency 434 MHz in the milking parlour were downloaded. Collected data were summarized with HathorHBClient v. 1.8.1 and statistically evaluated with IBM SPSS v. 20.0 (One-way ANOVA, Tukey Test, Indipendent Samples T-Test).
Results
Difference between pH values after feeding of start and peak lactation diets
Results between pH values at the start of lactation and peak of lactation are shown in the Table 3. and Figure 1. After comparison of 2 different diets next results were found. Generally, average pH values at the peak of lactation (PL) were statistically significant lower by 0.74% in comparison with pH at the start of lactation (SL) (P < 0.01). Differences between SL and PL groups in the pH values every hour from 0.09% (11:00) to 1.71% (17:00) with average difference 0.81 ± 0.35% were found. In the Figure 1 is shown that dairy cows had the same feeding regime. Feeding was realised between 4:00 and 5:00 and after that there was determined a conclusive effect of highly digestible nutrients, mainly starch and pH values decreased from their maximal values. Average fall during the 1st 6 hours after feeding was at the SL 0.83 ± 0.76% and at the PL 0.90 ± 0.62%. Before 2nd milking between 12:00 and 13:00 weak stabilisation after the previous decrease in pH values by 0.09% (SL) and 0.07% (PL) was determined. Statistically significant decrease (P < 0.01) between maximal average pH 6.62 (SL) and 6.60 (PL) at 4:00 and pH 6.27 (SL) and 6.23 (PL) at 12:00 in the SL group 5.35% and in the PL group 5.63% was found. After 2nd milking pH values decreased slowly to pH 6.19 ± 0.29 (SL) and 6.15 ± 0.26 (PL) at 14:00. In the time period before 3rd milking animals were resting and ruminating. This fact in the recovery of ruminal pH at the SL 0.51% (15:00 and 16:00), 0.76% (17:00) and at the PL 0.25% (15:00), 0.50% (16:00), 0.10% (17:00) and 0.72% (18:00) was reflected. At the time of 3rd milking (18:00) pH values were 6.28 ± 0.29 (SL) and 6.23 ± 0.32 (PL) and the difference between maximal pH at 4:00 was 5.10% (SL) and 5.56% (PL). After 18:00 animals ate residual of daily diets and ruminal pH decreased again. In the SL group ruminal pH declined by 1.08% (19:00), 0.91% (20:00), 0.42% (21:00) and 0.55% (22:00). Ruminal pH in the PL group drop by 0.66% (19:00), 0.92% (20:00), 0.97% (21:00) and 0.15% (22:00). At 22:00 the lowest average values of ruminal pH were found. At the SL was ruminal pH 6.10 ± 0.29 and at the PL 6.07 ± 0.26. After comparison with maximal ruminal pH values at 4:00 statistically
Table 3. Difference between start and peak lactation diet
Tabuľka 3. Rozdiel medzi kŕmnou dávkou na začiatku a vrchole laktácie
Hour Start of lactation Peak of lactation
x̄ pH SD Cv min. max. x̄ pH SD Cv min. max.
0 6.20ajmnopqsv 0.33 5.25 5.40 6.76 6.14aghij 0.33 5.35 5.43 6.76
1 6.30abghir 0.34 5.39 5.39 6.87 6.21bf 0.36 5.84 5.42 6.85
2 6.42cf 0.32 5.00 5.48 6.93 6.34ce 0.36 5.72 5.60 6.89
3 6.51df 0.28 4.37 5.66 7.05 6.47d 0.32 5.01 5.65 6.96
4 6.62e 0.27 4.01 5.89 7.11 6.60cd 0.29 4.35 5.93 7.09
5 6.62de 0.24 3.70 6.10 7.10 6.54ef 0.28 4.33 5.77 7.02
6 6.47f 0.27 4.20 5.78 7.07 6.41fx 0.32 4.95 5.59 6.97
7 6.39cfg 0.33 5.13 5.61 7.25 6.34bgklopqx 0.35 5.45 5.53 6.95
8 6.36chkl 0.34 5.27 5.36 7.15 6.29bhklnopqx 0.34 5.41 5.50 6.89
9 6.33ci 0.33 5.28 5.47 7.15 6.27biklmnopqx 0.31 4.90 5.51 6.90
10 6.30bghij 0.33 5.30 5.45 6.97 6.25bjklnopqx 0.28 4.52 5.60 6.77
11 6.26bikn 0.32 5.12 5.51 7.12 6.26ak 0.28 4.47 5.69 6.83
12 6.27biln 0.31 5.02 5.49 7.06 6.23alu 0.29 4.73 5.56 6.98
13 6.25bim 0.30 4.87 5.48 6.87 6.20amstu 0.27 4.44 5.56 6.90
14 6.19mnopstuv 0.29 4.73 5.47 6.87 6.15anstu 0.26 4.21 5.61 6.77
15 6.22bor 0.30 4.85 5.39 6.79 6.16aou 0.29 4.64 5.58 6.81
16 6.25bip 0.31 4.95 5.43 6.86 6.20apu 0.31 4.94 5.54 6.74
17 6.30bghiq 0.31 5.00 5.47 6.89 6.19ab 0.32 5.16 5.45 6.88
18 6.28hinrs 0.29 4.65 5.56 7.03 6.23aqu 0.32 5.07 5.55 6.88
19 6.22bstux 0.29 4.66 5.44 7.07 6.19ar 0.28 4.47 5.51 6.74
20 6.16kmoptv 0.34 5.48 5.35 7.25 6.13rsv 0.28 4.51 5.48 6.66
21 6.13ouv 0.32 5.22 5.32 7.19 6.08rtv 0.26 4.36 5.45 6.62
22 6.10v 0.29 4.83 5.38 6.74 6.07ruv 0.26 4.33 5.43 6.59
23 6.14ovx 0.31 5.02 5.37 6.70 6.10av 0.29 4.83 5.41 6.66
Daily
Average 6.30A 0.34 5.36 5.32 7.25 6.25B 0.33 5.32 5.41 7.09
abbreviations: start of lactation (SL), peak of lactation (PL) skratky: začiatok laktácie (SL), vrchol laktácie (PL)
Figure 1. Daily courses of ruminal pH at the start (SL) and peak of lactation (PL)
Graf 1. Denný vývoj ruminálnej pH na začiatku (SL) a vrchole laktácie (PL)
Difference between lactation numbers in pH values according to start and peak of lactation diet
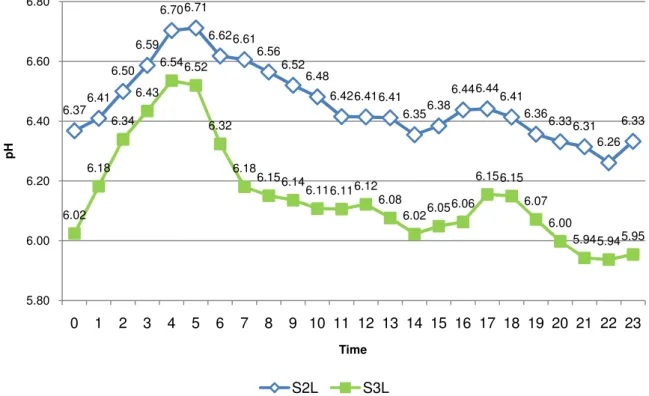
More significant differences than between groups at SL and at PL in lactation number were found. After comparison of groups (Figure 2.) of 2nd lactation cows (S2L) and 3rd lactation cows (S3L) at the start of lactation statistically significant difference 4.77% (P < 0.01) was detected. Average ruminal pH values were 6.45 ± 0.28 (S2L) and 6.14 ± 0.32 (S3L). In daily courses of ruminal pH the same trends were found. Maximal pH in the rumen at 4:00 6.54 (S3L) and at 5:00 6.71 (S2L) was determined. Ruminal pH of S3L cows decreased faster than pH of S2L cows during 1st 6 hours after feeding (1.12 ± 1.20% vs. 0.75 ± 0.41%). This drop at 11:00 and 12:00 was stopped and pH values (6.41 S2L; 6.12 S3L) were statistically significant lower (P < 0.01) in
comparison with pH values at 4:00 and 5:00. At this point ruminal pH values were lower by 4.42% (S2L) and 6.33% (S3L) in comparison with maximal values at 4:00 and 5:00. After that another pH decrease in the group S2L by 0.04% (13:00), 0.89% (14:00) and in the group S3L 0.79% (13:00), 0.85% (14:00) was found. Before third milking statistically significant (P < 0.01) pH recovery in the group S2L 0.47% (15:00), 0.84% (16:00), 0.05% (17:00) and in the group S3L 0.44% (15:00), 0.23% (16:00), 1.52% (17:00) was found. After 3rd milking ruminal pH (6.26 S2L; 5.94 S3L) decrease suddenly and hit a low at 22:00. Between 17:00 and 22:00 statistically significant
5.20 5.40 5.60 5.80 6.00 6.20 6.40 6.60 6.80 7.00 7.20 7.40
0:00 2:24 4:48 7:12 9:36 12:00 14:24 16:48 19:12 21:36 0:00
p
H
Time
differences (P < 0.01) 2.80% (S2L) and 3.54% (S3L) were found. Finally, average ruminal pH increase 1.00 ± 0.57% (S2L) and 1.62 ± 0.88% (S3L) for last 6 hours before 1st feeding at 4:00 was found. Total ruminal pH values decreased on average 0.59 ± 0.40% (S2L) and 0.85 ± 0.87% for 14 hours. Recovery of pH in the both groups on average for 10 hour per day 0.84 ± 0.57% (S2L) and 1.22 ± 0.91% were found.
abbreviations: second lactation cows at the start of lactation (S2L), third lactation cows at the start of lactation (S3L)
skratky: druho laktačné dojnice na začiatku laktácie (S2L), treťo laktačné dojnice na začiatku laktácie (S3L)
Figure 2. Daily courses of ruminal pH at the start of lactation (SL) Graf 2. Denný vývoj ruminálnej pH na začiatku laktácie (SL)
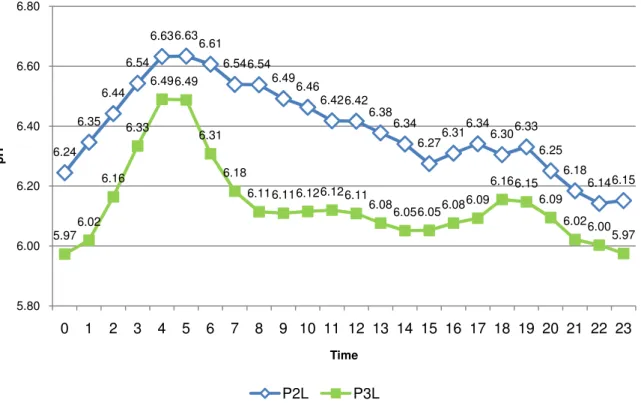
In the Figure 3. results of cows fed with daily diet at the peak of lactation are shown. Daily average courses of dairy cows pH values in the 2nd (P2L) and 3rd lactation (P3L) at the peak of lactation was similar in comparison with groups S2L and S3L on the start of lactation. Statistically significant difference 4.05% (P < 0.01) between group P3L and P2L after comparison of daily pH means was found. Daily mean of pH values in the group P2L was 6.39 ± 0.25 and P3L 6.14 ± 0.34. Statistically significant difference between groups S2L and P2L 0.89% (P < 0.01) in the pH value was found. Difference between groups S3L and P3L was 0.14% (P > 0.05). In the both cases the average pH values in the groups at the peak of lactation was lower. Maximal ruminal pH 6.49 at 4:00 (P3L) and pH 6.63 at 5:00 (P2L) was determined. After 1st feeding during 1st 6 hours pH decreased on average by 0.55 ± 0.34% (P2L) and in the group
6.376.41 6.50
6.59 6.706.71
6.626.61 6.56
6.52 6.48
6.426.416.41 6.356.38
6.446.44 6.41
6.36 6.336.31
6.26 6.33
6.02 6.18
6.34 6.43
6.546.52
6.32
6.18 6.156.14
6.116.116.12 6.08
6.026.056.06 6.156.15
6.07 6.00
5.945.945.95
5.80 6.00 6.20 6.40 6.60 6.80
0 1 2 3 4 5 6 7 8 9 10 11 12 13 14 15 16 17 18 19 20 21 22 23
p
H
Time
P3L for 1st 5 hours by 1.19 ± 1.19%. Before 2nd milking at 12:00 statistically
significant differences in comparison with maximal pH (6.42 P2L; 6.12 P3L) before feeding 3.27% (P2L) and 5.87% (P3L) were found. After that another pH decrease in the group P2L 0.61% (13:00), 0.59% (14:00), 1.03% (15:00) and in the group P3L 0.53% (13:00), 0.41% (14:00) and 0.01% (15:00) was found. Next 4 hours the average stabilisation of ruminal pH 0.22 ± 0.53% (P2L) and 0.39 ± 0.48% (P3L) was detected. This recovery during 3rd milking between 18:00 and 19:00 was discontinued (pH P2L 6.33; pH P3L 6.16). After 3rd milking average ruminal pH went down by 1.27% (20:00), 1.06% (21:00), 0.15% (22:00) in the P2L group and by 0.86% (20:00), 1.20% (21:00), 0.31% (22:00), 0.47% (23:00) and 0.03% (00:00) in the P3L group. The maximal and statistically significant differences between pH (P2L 6.14; P3L 5.97) before feeding in the group P2L at 22:00 (7.49%; P < 0.01) and in the group P3L at 00:00 (7.96%; P < 0.01) were determined. Before 1st feeding ruminal pH an increase in the group P2L during 7 hours on average by 1.11 ± 0.70% and in the group P3L during 4 hours on average by 2.10 ± 0.90% was found. Totally, average decrease of ruminal pH 0.65 ± 0.37% (P2L) and 0.72 ± 0.81% (P3L) for 14 hours was determined. Overall pH recovery 0.92 ± 0.65% (P2L) and 1.03 ± 1.09% (P3L) during 10 hours per day was found.
abbreviations: second lactation cows at the peak of lactation (P2L), third lactation cows at the peak of lactation (P3L)
skratky: druho laktačné dojnice na vrchole laktácie (P2L), treťo laktačné dojnice na vrchole laktácie (P3L)
Figure 3. Daily courses of ruminal pH at the peak of lactation (PL) Graf 3. Denný vývoj ruminálnej pH na vrchole laktácie (SL) 6.24
6.35 6.44
6.54 6.636.63
6.61 6.546.54
6.49 6.46
6.426.42 6.38
6.34 6.276.31
6.34 6.306.33
6.25 6.18
6.146.15
5.976.02 6.16
6.33 6.496.49
6.31
6.18
6.116.116.126.126.11 6.08
6.056.056.086.09 6.166.15
6.09 6.026.00
5.97
5.80 6.00 6.20 6.40 6.60 6.80
0 1 2 3 4 5 6 7 8 9 10 11 12 13 14 15 16 17 18 19 20 21 22 23
p
H
Time
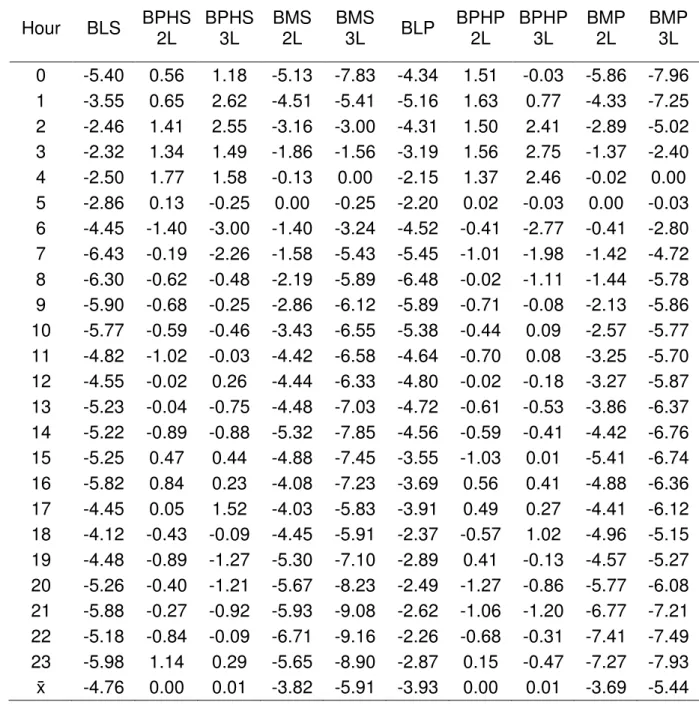
Table 4. Differences in pH concentration between hours in % according to daily diet and lactation number
Tabuľka 4. Rozdiely v koncentráciach pH medzi hodinami v % podľa kŕmnej dávky a poradia laktácie
Hour BLS BPHS 2L BPHS 3L BMS 2L BMS 3L BLP BPHP 2L BPHP 3L BMP 2L BMP 3L
0 -5.40 0.56 1.18 -5.13 -7.83 -4.34 1.51 -0.03 -5.86 -7.96 1 -3.55 0.65 2.62 -4.51 -5.41 -5.16 1.63 0.77 -4.33 -7.25 2 -2.46 1.41 2.55 -3.16 -3.00 -4.31 1.50 2.41 -2.89 -5.02 3 -2.32 1.34 1.49 -1.86 -1.56 -3.19 1.56 2.75 -1.37 -2.40 4 -2.50 1.77 1.58 -0.13 0.00 -2.15 1.37 2.46 -0.02 0.00 5 -2.86 0.13 -0.25 0.00 -0.25 -2.20 0.02 -0.03 0.00 -0.03 6 -4.45 -1.40 -3.00 -1.40 -3.24 -4.52 -0.41 -2.77 -0.41 -2.80 7 -6.43 -0.19 -2.26 -1.58 -5.43 -5.45 -1.01 -1.98 -1.42 -4.72 8 -6.30 -0.62 -0.48 -2.19 -5.89 -6.48 -0.02 -1.11 -1.44 -5.78 9 -5.90 -0.68 -0.25 -2.86 -6.12 -5.89 -0.71 -0.08 -2.13 -5.86 10 -5.77 -0.59 -0.46 -3.43 -6.55 -5.38 -0.44 0.09 -2.57 -5.77 11 -4.82 -1.02 -0.03 -4.42 -6.58 -4.64 -0.70 0.08 -3.25 -5.70 12 -4.55 -0.02 0.26 -4.44 -6.33 -4.80 -0.02 -0.18 -3.27 -5.87 13 -5.23 -0.04 -0.75 -4.48 -7.03 -4.72 -0.61 -0.53 -3.86 -6.37 14 -5.22 -0.89 -0.88 -5.32 -7.85 -4.56 -0.59 -0.41 -4.42 -6.76 15 -5.25 0.47 0.44 -4.88 -7.45 -3.55 -1.03 0.01 -5.41 -6.74 16 -5.82 0.84 0.23 -4.08 -7.23 -3.69 0.56 0.41 -4.88 -6.36 17 -4.45 0.05 1.52 -4.03 -5.83 -3.91 0.49 0.27 -4.41 -6.12 18 -4.12 -0.43 -0.09 -4.45 -5.91 -2.37 -0.57 1.02 -4.96 -5.15 19 -4.48 -0.89 -1.27 -5.30 -7.10 -2.89 0.41 -0.13 -4.57 -5.27 20 -5.26 -0.40 -1.21 -5.67 -8.23 -2.49 -1.27 -0.86 -5.77 -6.08 21 -5.88 -0.27 -0.92 -5.93 -9.08 -2.62 -1.06 -1.20 -6.77 -7.21 22 -5.18 -0.84 -0.09 -6.71 -9.16 -2.26 -0.68 -0.31 -7.41 -7.49 23 -5.98 1.14 0.29 -5.65 -8.90 -2.87 0.15 -0.47 -7.27 -7.93 x̄ -4.76 0.00 0.01 -3.82 -5.91 -3.93 0.00 0.01 -3.69 -5.44
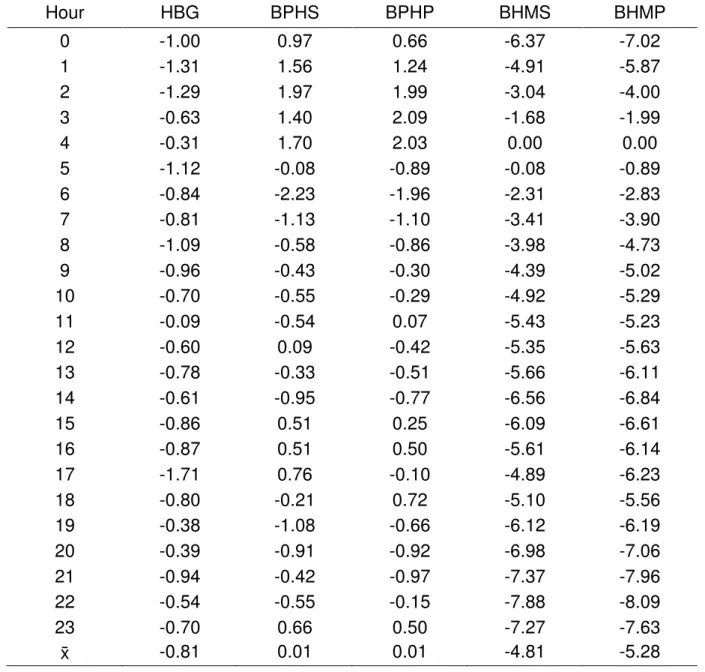
Table 5. Difference in pH concentration between hours in % according to daily diet Tabuľka 5. Rozdiely v koncentráciách pH medzi hodinami v % podľa kŕmnej
dávky
Hour HBG BPHS BPHP BHMS BHMP
0 -1.00 0.97 0.66 -6.37 -7.02
1 -1.31 1.56 1.24 -4.91 -5.87
2 -1.29 1.97 1.99 -3.04 -4.00
3 -0.63 1.40 2.09 -1.68 -1.99
4 -0.31 1.70 2.03 0.00 0.00
5 -1.12 -0.08 -0.89 -0.08 -0.89
6 -0.84 -2.23 -1.96 -2.31 -2.83
7 -0.81 -1.13 -1.10 -3.41 -3.90
8 -1.09 -0.58 -0.86 -3.98 -4.73
9 -0.96 -0.43 -0.30 -4.39 -5.02
10 -0.70 -0.55 -0.29 -4.92 -5.29
11 -0.09 -0.54 0.07 -5.43 -5.23
12 -0.60 0.09 -0.42 -5.35 -5.63
13 -0.78 -0.33 -0.51 -5.66 -6.11
14 -0.61 -0.95 -0.77 -6.56 -6.84
15 -0.86 0.51 0.25 -6.09 -6.61
16 -0.87 0.51 0.50 -5.61 -6.14
17 -1.71 0.76 -0.10 -4.89 -6.23
18 -0.80 -0.21 0.72 -5.10 -5.56
19 -0.38 -1.08 -0.66 -6.12 -6.19
20 -0.39 -0.91 -0.92 -6.98 -7.06
21 -0.94 -0.42 -0.97 -7.37 -7.96
22 -0.54 -0.55 -0.15 -7.88 -8.09
23 -0.70 0.66 0.50 -7.27 -7.63
x̄ -0.81 0.01 0.01 -4.81 -5.28
abbreviations: mean (x̄), difference in hours between groups (HBG), between previous hour at the start (BPHS) and peak of lactation (BPHP), between hour with maximal pH at the start (BHMS) and peak of lactation (BHMP)
skratky: priemer (x̄), rozdiel medzi hodinami medzi skupinami (HBG), medzi predošlou hodinou na začiatku (BPHS) a vrchole laktácie (BPHP), medzi hodinou s maximálnou pH na začiatku (BHMS) a vrchole laktácie (BHMP)
Frequency of measured pH values according to daily diets and lactation numbers
cows at the start of lactation (SL) under the pH 5.8. PL cows spent under 5.8 2 hours (h) 51 minutes (m) 58 seconds (s) per day and SL cows 23 m 7 s. Ruminal pH
between 5.8 and 6.2 are also dangerous for cellulolytic bacteries. After comparison of SL (1544 times) and PL (1484 times) groups 3.89% less of pH values in the group of PL between pH 5.8 – 6.2 was found. SL cows spent in this interval daily 6 h 37 m 10 s and PL cows 6 h 44 m 25 s. In the optimal interval of pH 6.2 – 6.8 spent SL cows 13 h 51 m 23 s and PL cows 13 h 25 m 18 s per day. In the PL group was pH values in this interval 8.57% lower in comparison with SL group. Finally, dairy cows in the SL group spent more time per day over pH 6.8 (1 h 22 m 50 s vs. 58 m 19 s) and
frequency of pH values in this interval was higher by 33.54%.
In the SL group animals in the 2nd (S2L) and 3rd lactation (S3L) were monitored. The pH values frequency of these groups was fallowing. Under pH 5.8 911.11 % more pH values after comparison of S2L and S3L groups in the S3L group was detected. While S2L cows spent below this threshold 26 m 7 s, S3L cows 3 h 54 m 25 s per day. Lower differences but still high between groups in the interval 5.8 – 6.2 were found. The difference 129.91% in favour of S3L group after comparison of both
groups was detected. Dairy cows in the S2L group spent in this interval 4 h 00 m 26 s and S3L group 9 h 14 m 22 s on average per day. The S2L group had more stabile rumen environment than S3L group. In the pH interval 6.2 – 6.8 42.34% more pH values in the group S2L in comparison with S3L were detected. Optimal pH for ruminal microorganisms lasted in the group S2L 17 h 33 m 9 s and S3L 10 h 8 m 58 s on average per day. In the S3L group 65.83% less of detected pH values in comparison with S2L group over pH 6.8 was determined. Over this threshold spent S2L dairy cows 2 h 3 m 18 s and S3L cows only 42 m 15 s.
In the PL group animals in the 2nd (P2L) and 3rd lactation (P3L) was also monitored. After comparison of S2L and P2L group 44.44% less values under pH 5.8 in the P2L group were detected. On the other side in the P2L group in comparison with S2L was higher frequency 10.90% in the in pH the interval 5.8 – 6.2. In the pH interval 6.2 – 6.8 and over 6.8 in the group P2L after comparison with S2L 15.90% (6.2 – 6.8) and 55.42% (over 6.8) difference was found. Transition to peak lactation diet caused higher frequency of pH below threshold 5.8 in the groups of dairy cows in the third lactation. Dairy cows in the P3L group had 33.19% higher pH frequency under 5.8 in comparison with S3L. On the other side in the P3L group in comparison with S3L group 10.32% less frequency in the interval 5.8 – 6.2 was detected. In the interval 6.2 – 6.8 was 4.15% more pH values in the group P3L than S3L and over pH 6.8 it was 30.49% for P3L group.
difference 0.00% was determined. Overall P2L group spent over pH 6.8 1 h 4 m 53 s and P3L group 52 m 58 s.
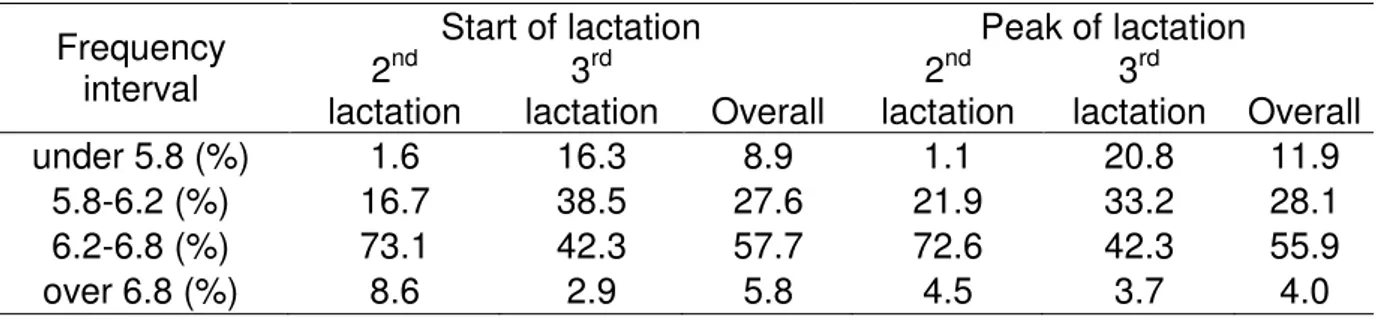
Table 6. Differences between frequency of measured pH values at the start and peak of lactation
Tabuľka 6. Rozdiely medzi frekvenciami nameraných hodnôt pH na začiatku a vrchole laktácie
Frequency interval
Start of lactation Peak of lactation 2nd
lactation 3 rd
lactation Overall 2 nd
lactation 3 rd
lactation Overall
under 5.8 (%) 1.6 16.3 8.9 1.1 20.8 11.9
5.8-6.2 (%) 16.7 38.5 27.6 21.9 33.2 28.1
6.2-6.8 (%) 73.1 42.3 57.7 72.6 42.3 55.9
over 6.8 (%) 8.6 2.9 5.8 4.5 3.7 4.0
Discussion
Ideal pH for all rumen microbes is from 6.2 to 7.0 (Barber et al., 2010). Maulfair et al. (2013) observed the lowest pH values from 5.28 to 5.59 and the highest values of pH from 6.69 to 6.95. Another research recorded average pH values from 5.69 to 6.50 (Krause et al., 2009) and from 5.90 to 6.60 (Křížová et al., 2011). Křížová et al. (2010) found mean pH in the rumen around 6.80 and 6.83. The daily mean pH from 5.96 to 6.89 with an average 6.31 from 450 analysed rumens of dairy cows was found (Mottram, 2015). In this research pH values from 5.32 to 7.25 were
determined. The daily mean pH at the start of lactation 6.30 ± 0.34 and at the peak of lactation 6.25 ± 0.33 was found. The average pH for both groups during whole
monitored period was 6.27 ± 0.34.
Mertz et al. (2009) found mean pH in the 1st lactation 6.43 ± 0.28, 2nd lactation 6.87 ± 0.19 and 3rd lactation 6.40 ± 0.40. Mean pH in the group of multiparous cows was 5.84 ± 0.06 and in the group of primiparous cows 5.95 ± 0.06 (Meakawa et al., 2002). Bowman et al. (2003) determined higher pH in the group of primiparous cows (5.67) than multiparous (5.58). At the start of lactation the difference between 2nd and 3rd lactation cows was found. Average ruminal pH values were 6.45 ± 0.28 in the group of 2nd lactation cows (S2L) and 6.14 ± 0.32 in the group of 3rd lactation cows (S3L). The same results at the peak of lactation were determined. The daily pH mean of 2nd lactation cows (P2L) 6.39 ± 0.25 and in the group of 3rd lactation cows (P3L) 6.14 ± 0.34.
Bodas et al. (2014) found that pH rises during the night and the maximum value is reached before feed is delivered to animals and the lowest pH is reached at 21:00 – 22:00 probably as a consequence of an evening intake of feed. In this research the maximal pH values were before delivery of food at 4:00 – 5:00. At the start of
lactation average fall during the 1st 6 hours after feeding 0.83 ± 0.76% (S3L 1.12 ± 1.20%; S2L 0.75 ± 0.41%) and at the peak of lactation 0.90 ± 0.62% (P3L 1.19 ± 1.19%; P2L 0.55 ± 0.34%) on average per hour was found. The lowest pH in the both groups at 22:00 was found. During the night before 1st feeding pH values by 1.38 ± 0.48% (SL) and 1.42 ± 0.72% (PL) were recovered. In the S2L group mean increase of pH was 1.00 ± 0.57%, in the S3L group 1.62 ± 0.88%, in the P2L group 1.11 ± 0.70% and in the P3L group 2.10 ± 0.90%.
Multiparous cows (47.63% of measured data) remained pH under 5.8 about 1.2 hour per day longer then primiparous cows (37.18% of measured data) (Meakawa et al., 2002). Similar results found Bowman et al., (2003). In their study were multiparous cows per day under pH 5.8 longer (6.8 hour daily) then primiparous cows (5.4 hour daily). AlZahal et al. (2007) monitored ruminal pH below 5.6 for 5 hours daily and during another experiment found AlZahal et al. (2008) pH values in the rumen under 5.6 for 1 hour daily. Average daily pH values under 6.0 took 4 hours and 33 minutes of a day (Keunen et al., 2002). Overall 8.9% of measured pH values under 5.8 in the SL group and 11.9% in the PL group were detected. In the S2L group pH values below the threshold 5.8 only 1.6% and in the P2L group 1.1% were found. On the other side S3L group had under pH 5.8 16.3% and P3L group 20.8% of detected values. Dairy cows in the SL group spent below pH 5.8 23 m 7 s and in the PL group 2 h 51 m 58 s daily. In the S2L group was pH under 5.8 26 m 7 s, S3L group 3 h 54 m 25 s, P2L 15 m 9 s and P3L group 4 h 59 m 59 s per day.
Conclusions
Change of feeding from the daily diet at the start of lactation to peak of lactation has effect on ruminal pH. Values of pH at the peak of lactation were statistically
lactation better pH recover ability before 1st feeding was found (1.00 ± 0.57% S2L; 1.11 ± 0.70% P2L vs. 1.62 ± 0.88% S3L; 2.10 ± 0.90% P3L per hour). Generally, dairy cows at the peak of lactation spent more time per day (26.20%) under the threshold 5.8 than dairy cows at the start of lactation (23 m 7 s SL; 2 h 51 m 58 s PL) but less time (33.54%) over pH 6.8 (1 h 22 m 50 s SL; 58 m 19 s PL). In the groups of 3rd lactations cows higher frequency of pH under 5.8 in comparison with 2nd
lactation cows was found. Under this threshold at the start of lactation 911.11% more of pH values and at the peak of lactation 2324.00% more of pH values in the group of 3rd lactation cows in comparison with 2nd lactation cows were found. Third lactation dairy cows spent more time under the pH 5.8 per day than 2nd lactation cows at the start of lactation (26 m 7 s S2L vs. 3 h 54 m 25 s S3L) and also at the peak of lactation (15 m 9 s P2L vs. 4 h 59 m 59 s P3L).
Acknowledgements
The project was supported by the Slovak National Scientific Grant Agency VEGA, Grant No. 1/0723/15.
References
AlZahal, O., Kebreab, E., France, J., McBride, B. W. (2007) A mathematical
approach to predicting biological values from ruminal pH measurements. Journal of Dairy Science, 90 (8), 3777-3785. DOI:
http://dx.doi.org/10.3168/jds.2006-534
AlZahal, O., Kebreab, E., France, J., Froetschel, M., McBride, B. W. (2008) Ruminal temperature may aid in the detection of subacute ruminal acidosis. Journal of Dairy Science, 91 (1), 202-207. DOI: http://dx.doi.org/10.3168/jds.2007-0535
Barber, D., Anstis, A., Posada, V. (2010) Managing for healthy rumen function. Nurition Plus, The State of Queensland, DEEDI. [Online] Available at: https://www.daf.qld.gov.au/__data/assets/pdf_file/0007/66238/Dairy-2Healthy-rumen.pdf [Accessed 18 May 2016].
Bodas, R., Posado, R., Bartolomé, D. J., Tabernero de Paz, M. J., Herráiz, P., Rebollo, E., García, J. J. (2014) Ruminal pH and temperature, papilla characteristics, and animal performance of fattening calves fed concentrate or maize silage-based diets. Chilean Journal of Agricultural Research, 74 (3), 280–285. DOI: http://dx.doi.org/10.4067/S0718-58392014000300005 Bowman, G. R., Beauchemin, K. A., Shelford, J. A. (2003) Fibrolytic enzymes and parity effects on feeding behavior, salivation, and ruminal pH of lactating dairy cows. Journal of Dairy Science, 86 (2), 565-575. DOI:
http://dx.doi.org/10.3168/jds.S0022-0302(03)73635-2
Duffield, T., Plaizier, J. C., Fairfield, A., Bagg, R., Vessie, G., Dick, P. (2004)
Comparison of techniques for measurement of rumen pH in lactating dairy cows. Journal of Dairy Science, 87 (1), 59-66. DOI:
Garrett, E. F., Pereira, M. N., Nordlund, K. V., Armentano, L. E., Goodger, W. J., Oetzel, G. R. (1999) Diagnostic Methods for the Detection of Subacute Ruminal Acidosis in Dairy Cows. Journal of Dairy Science, 82 (6), 1170– 1178. DOI: http://dx.doi.org/10.3168/jds.s0022-0302(99)75340-3
Geishauer, T. (1993) An instrument for the collection and transfer of ruminal fluid and for the administration of water soluble drugs in adult cattle. The Bovine Practitioner, 27 (1), 38 – 42.
Hall, M. B., Eastridge, M. L. (2014) INVITED REVIEW: Carbohydrate and fat:
Considerations for energy and more. The Professional Animal Scientist, 30 (2), 140–149. DOI: http://dx.doi.org/10.15232/s1080-7446(15)30101-7 Hassanat, F., Gervais, R., Julien, C., Massé, D. I., Lettat, A., Chouinard, P. Y.,
Benchaar, C. (2013) Replacing alfalfa silage with corn silage in dairy cow diets: Effects on enteric methane production, ruminal fermentation,
digestion, N balance, and milk production. Journal of Dairy Science, 96 (7), 4553–4567. DOI: http://dx.doi.org/10.3168/jds.2012-6480
Keunen, J. E., Plaizier, J. C., Kyriazakis, L., Duffield, T. F., Widowski, T. M., Lindinger, M. I., McBride, B. W. (2002): Effects of a subacute ruminal
acidosis model on the diet selection of dairy cows. Journal of Dairy Science, 85 (12), 3304-3313. DOI:
http://dx.doi.org/10.3168/jds.s0022-0302(02)74419-6
Kleen, J. L., Hooijer, G. A., Rehage, J., Noordhuizen, J. P. T. M. (2003) Subacute Ruminal Acidosis (SARA): a Review. Journal of Veterinary Medicine Series A, 50 (8), 406–414. DOI:
http://dx.doi.org/10.1046/j.1439-0442.2003.00569.x
Krause, K. M., Dhuyvetter, D. V., Oetzel, G. R. (2009) Effect of a low-moisture buffer block on ruminal pH in lactating dairy cattle induced with subacute ruminal acidosis. Journal of dairy science, 92 (1), 352-364. DOI:
http://dx.doi.org/10.3168/jds.2007-0959
Křížova, L., Richter, M., Třináctá, J. (2010) Continuous monitoring of ruminal pH and redox-potential in dry cows using a novel wireless ruminal probe. Advances in Animal Biosciences, 1 (1), 252. DOI:
http://dx.doi.org/10.1017/s204047001000395x
Křížová, L., Richter, M., Třináctý, J., Říha, J., Kumprechtová, D. (2011) The effect of feeding live yeast cultures on ruminal pH and redox potential in dry cows as continuously measured by a new wireless device. Czech Journal of Animal Science, 56 (1), 37-45.
Maekawa, M., Beauchemin, K. A., Christensen, D. A. (2002) Chewing activity, saliva production, and ruminal pH of primiparous and multiparous lactating dairy cows. Journal of Dairy Science, 85 (5), 1176-1182. DOI:
http://dx.doi.org/10.3168/jds.S0022-0302(02)74180-5
Marden, J. P., Bayourthe, C., Enjalbert, F., Moncoulon, R. (2005) A New Device for Measuring Kinetics of Ruminal pH and Redox Potential in Dairy Cattle. Journal of Dairy Science, 88 (1), 277–281. DOI:
Maulfair, D. D., McIntyre, K. K., Heinrichs, A. J. (2013) Subacute ruminal acidosis and total mixed ration preference in lactating dairy cows. Journal of dairy science, 96 (10), 6610-6620. DOI: http://dx.doi.org/10.3168/jds.2013-6771 Mertz, D. J., Woskow, S. A. (2009) Ruminal Fermentation Patterns in Lactating Dairy
Cows on the Priority P-One Program–Utah. [Online] Available at: http://www.forhealthycows.com/assets/ruminalfermentation-utah.pdf [Accessed 18 May 2016].
Mottram, T., Lowe, J., McGowan, M., Phillips, N. (2008) Technical note: A wireless telemetric method of monitoring clinical acidosis in dairy cows. Computers and Electronics in Agriculture, 64 (1), 45–48. DOI:
http://dx.doi.org/10.1016/j.compag.2008.05.015
Mottram, T. (2015) Survey of rumen pH in commercial dairy herds. EAAP 66 thAnnual Conference, Warsaw, Poland, 31. 8. – 4. 9. 2015. [Online] Available at:
http://www.ecow.co.uk/wp-content/uploads/2015/09/EAAP2015_paper_v1.pdf [Accessed 18 May 2016].
Nocek, J. E. (1997) Bovine Acidosis: Implications on Laminitis. Journal of Dairy Science, 80 (5), 1005–1028. DOI: http://dx.doi.org/10.3168/jds.s0022-0302(97)76026-0
Nordlund, K. V., Garrett, E. F. (1994) Rumenocentesis: A technique for the diagnosis of subacute rumen acidosis in dairy herds. The Bovine Practitioner, 28 (1), 109 – 112.
Oetzel, G. R., Nordlund, K. V., Garrett, E. F. (1999) Effect of ruminal pH and stage of lactation on ruminal lactate concentrations in dairy cows. Journal of Dairy Science, 82 (1), 38.
Palmonari, A., Stevenson, D. M., Mertens, D. R., Cruywagen, C. W., Weimer, P. J. (2010) pH dynamics and bacterial community composition in the rumen of lactating dairy cows. Journal of Dairy Science, 93 (1), 279–287. DOI: http://dx.doi.org/10.3168/jds.2009-2207
Plaizier, J. C., Keunen, J. E., Walton, J.P., Duffield, T. F., McBride, B. W. (2001) Effect of subacute ruminal acidosis on in situ digestion of mixed hay in lactating dairy cows. Canadian Journal of Animal Science, 81 (3), 421–423. DOI: http://dx.doi.org/10.4141/a00-106
Plaizier, J. C., Krause, D. O., Gozho, G. N., McBride, B. W. (2008) Subacute ruminal acidosis in dairy cows: The physiological causes, incidence and
consequences. The Veterinary Journal, 176 (1), 21–31. DOI: http://dx.doi.org/10.1016/j.tvjl.2007.12.016