Article
0103 - 5053 $6.00+0.00*e-mail: [email protected]
Hydrogen Peroxide in the Rainwater of Sao Paulo Megacity:
Measurements and Controlling Factors
Carolina Gonçalves,a Marcos A. dos Santos,b Adalgiza Fornaroc and Jairo J. Pedrotti*,a
aDepartamento de Química, Centro de Ciências e Humanidades, Universidade Presbiteriana
Mackenzie, Rua da Consolação, 896, 01302-907 São Paulo-SP, Brazil
bDepartamento de Química Fundamental, Universidade de São Paulo, Av. Prof. Lineu Prestes, 748,
05508-000 São Paulo-SP, Brazil
cDepartamento de Ciências Atmosféricas, Universidade de São Paulo, Rua do Matão, 1226,
05508-090, São Paulo-SP, Brazil
Determinações de H2O2, íons majoritários e parâmetros meteorológicos foram realizados em eventos de chuva no centro de São Paulo entre julho de 2001 e janeiro de 2006. As concentrações de H2O2 variaram entre 0,5 e 78 µmol L
-1, sendo a média de 14,5 µmol L-1. As concentrações
médias de SO4
2− e HCOO− foram 13,5 e 9,62 µmol L-1, respectivamente. Observou-se uma
correlação signiicativa de H2O2 com íon HCOO− (r = 0,70, n = 129, p < 0,0001) indicando que
a oxidação de formaldeído por radicais OH• pode ser uma rota de formação de H
2O2 nas águas
de chuva de São Paulo. A estimativa da deposição úmida de H2O2 mostra que aproximadamente 70% da deposição úmida anual de H2O2 ocorre na primavera e verão. A ocorrência de relâmpagos,
assim como a intensidade da chuva, foi importante no controle da concentração de H2O2 na fase
líquida da atmosfera.
Measurements of H2O2, major ions and meteorological parameters were made in rain events
occurred in downtown Sao Paulo City, Brazil between July 2001 and January 2006. The H2O2
concentration ranged from 0.5 to 78 µmol L-1 with an average of 14.5 µmol L-1. The SO 4
2−and
HCOO− concentrations mean were of 13.5 and 9.62 µmol L-1, respectively. The H
2O2 concentrations
showed a positive and signiicant correlation with HCOO− (r = 0.70, n = 129, p < 0.0001) suggesting
that the production of H2O2 in aqueous phase by consumption of formaldehyde by reaction with OH •
radical is a factor which may control the H2O2 levels in the rainwater samples. Estimation of rate
of wet deposition of H2O2 shows that nearly 70% of hydrogen peroxide is annually removed from the atmosphere by wet deposition in spring and summer. Sequential rainstorm analyses indicated that lightning activity and rainfall rate can inluence the H2O2 contents in rainwater in this area.
Keywords: hydrogen peroxide, rainwater, air pollution, megacity
Introduction
Photochemical oxidants like hydrogen peroxide (H2O2) and ozone (O3) are air pollutants which cause adverse effects on plants and crops as well as on the human health. The hydrogen peroxide, H2O2 is one of the most important oxidants of the troposphere contributing to control the chemical composition of the atmosphere at trace gas levels.1 In the gas phase, the H
2O2 production results from
the interactions among hydroperoxyl (HO2•) radicals and
hydrated hydroperoxy (H2O•HO
2), which are produced
by photolysis of ozone (O3) in atmosphere containing suficiently high humidity and gases such as CO and hydrocarbons, some of those provided naturally and others resulting from anthropogenic activities.2-4
Hydrogen peroxide is extremely soluble in water (KH = 1.2×10⁵ mol L-1 atm-1 at 25 oC), providing micromolar
concentration levels even when the gaseous concentration is within ppbv range.5-7 Gas-to-drop partitioning has been
considered the predominant source of H2O2 in atmospheric water drops. On the other hand, some results have shown that solar UV radiation can initiate the photochemical reactions in aqueous phase for H2O2 formation.8 In the
effective oxidant for the conversion of dissolved sulfur dioxide (SO2) to sulfuric acid (H2SO4) at pH range from 2 to 5, which is the main contributor to the acidiication of cloud, fog and rainwater.5-8 The H
2O2 role over continents
and oceans has been extensively studied in the atmospheric chemistry, showing that the H2O2 ambient concentration varies typically from 0.1 to 2.0 ppb in the gas phase and from < 10-7 to 10-4 mol L-1 in fog, cloud, snow and rainwater.
Higher concentrations have been observed in the summer and lower concentrations in the winter.9-12
Field H2O2 measurements have been carried out by several groups in Southern Hemisphere.13-16 In Brazil, the
irst H2O2 concentrations in rainwater were measured in the late summer of 1988 in three northeastern sampling sites of the Country (Mucugé, Itaparica Island and Salvador City) in Bahia State. The H2O2 concentrations showed values ranging from 19 to 200 µmol L-1, with an average
concentration of 66 µmol L-1.13 More recently, two other
studies concerning H2O2 ield measurements were carried in urban areas in the Southeastern of the country. In Minas Gerais State, rains collected in Juiz de Fora City between November 2003 and January 2005 showed H2O2 concentrations ranging from 1.1 to 92.5 µmol L-1, being the
higher H2O2 levels measured during spring and summer.15
In urban area of Sao Paulo City, lower concentrations were recorded in rainwater collected between April 2003 and April 2004. The concentrations of H2O2 ranged from 2.29 to 48.6 µmol L-1, with an average value of 13.1 µmol L -1.16
In this work, the results of a 5-year study concerning the measurements of hydrogen peroxide, sulfate, formate, pH and electrical conductivity in Sao Paulo rainwater are presented and the factors controlling the levels of H2O2 are discussed. Sequential measurements of H2O2 in rainstorms were also carried out in order to evaluate the inluence of meteorological factors on the H2O2 concentrations during the precipitation.
Site sampling
The Metropolitan Area of Sao Paulo (MASP) is located in the southeastern region of Sao Paulo State (46o43’W and
23o34’S), Brazil, around 45 km from the coast (Atlantic
Ocean), at 780 m above the sea level. The MASP annual climatological data are: average temperature 19.3 oC; relative
humidity 78% and precipitation in 1455 mm. The rainy (689 ± 122 mm) periods between December and February and dry ones (135 ± 67 mm) between June and August are well-deined, summer and winter, respectively. Intermediary situations happen in the fall and in the spring.17 Sao Paulo
City has, approximately, 11 million inhabitants and it is the largest part of the MASP, one of the most populated
urban regions in the world, with more than 19 million inhabitants distributed in 1,747 km2 of unplanned urban area,
characterized by serious environmental problems.18
Sao Paulo State Environmental Agency (CETESB) has been monitoring atmospheric pollutants like SO2, CO, NOx, O3 and inhalable particulates (PM10) by an automatic network in the MASP (29 sites). In the last years, these results have indicated that the atmospheric emissions in the MASP are associated with pollutants released, mainly, by the large leet of vehicles. The most common fuels used by almost seven million heavy and light vehicles are diesel, hydrated ethanol and gasohol (gasoline + 22% of ethanol). The vehicular leet has been responsible for 97% of CO, 97% of HC, 96% of NOx, 35% of SO2 and 40% of PM10 emissions.18
Although there is no monitoring net about rainwater chemical composition in Sao Paulo, recent results show that ammonium (NH4+) is the dominant ion, followed by
nitrate (NO3−), sodium (Na+), sulfate (SO 4
2−) and formate
(HCOO−). The average pH value was 5.1, indicating that the precipitation was slightly acidic.19,20
Experimental
Rainwater samples were collected in high-density polyethylene bottles at the Mackenzie University campus located in downtown Sao Paulo City. The automatic wet-only sample collector (G.K. Walter Germany) is positioned at the balcony of the Education Building, 15 m above the ground. Preliminary experiments carried out with rainwater samples showed that H2O2 concentration suffer a decrease 30-50% within a period of 2 h after their collection at ambient temperature. The conditioning of the samples carried out at −18oC or at −80 oC in order
to preserve the H2O 2 content did not show good results. A signiicant H2O 2 decomposition was observed in both temperatures, although the fastest process occurred at −18oC. So, the H
2O2 determination was made only in
samples collected during or immediately after the end of the rain events. Usually within 15 min after their collection, the rainwater samples were iltered through a 0.22 µm pore size cellulose acetate membrane and analyzed for H2O2. The remaining sample volume were separated into aliquots and stored in a freezer (at −18 oC) for additional analytical
determinations, which were made within 2 weeks after their collection. Meteorological data were obtained from the Meteorological Station (IAG/USP).
Reagents and chemicals
4-aminoantipyrine, mono and di-hydrogen phosphate were obtained from Merck (Darmstadt, Germany). Peroxyacetic acid was purchased from Aldrich (Milwaukee, WI, USA). Phenol, commercial catalase and peroxidase were obtained from Sigma (St. Louis, MO, USA). Solutions were prepared with deionized water (Nanopure system, resistivity > 18 MΩ cm). The stock solution containing 0.10 mol L-1
H2O2 was stored at 4 oC and standardized with KMnO 4,
which had previously been standardized with sodium oxalate. The reference solutions of H2O2 were prepared just before their use by dilution of the stock solution.
Instrumentation
Flow spectrophotometric measurements were made by using a model 600 Femto visible spectrophotometer (Sao Paulo, Brazil) provided with a 180 µL glass low cell with a 1.0 cm light path. The solutions were propelled with an Ismatec pump model REGLO. Telon tubing of 0.8 mm i.d. was used for manifold construction except for pump tubing, where short sections of Tygon tubing were employed. Sample and colorimetric reagent solutions were injected in the FIA system with a homemade, manually operated, rotatory valve provided with 500 µL sampling loops.
The pH values were measured using a Digimed DM-20 pH-meter provided with a glass electrode combined with an Ag/AgCl (KCl sat.) reference electrode. The anions analyses were made by ion chromatography Metrohm model 761 with an electrical conductivity detector. The mobile phase was a 4.0 mmol L-1 Na
2CO3 /1.2 mmol L
-1 NaHCO 3
solution and the suppressor column was regenerated with 50 mmol L-1 H
2SO4. Acetaldehyde and formaldehyde
were measured as 2,4 dinitrophenylhydrazones (DNPH) derivatives by using a Dionex P680 liquid chromatograph with a 20 µL sampling loop and 340U UV detector operating at 360 nm. The separation of the hydrazones was carried out with a C18 reversed phase Supersil ODS column (5 µm, 4.6 × 150 mm) with isocratic elution by using a 30/70% (v/v) water-acetonitrile solution at 0.7 mL min-1
low rate as mobile phase.21
Hydrogen peroxide analysis
A flow injection method with spectrophotometric detection was used for hydrogen peroxide determination.22
The analytical method is based on the one-electron oxidation of phenol by hydrogen peroxide catalyzed by peroxidase. The phenoxy radicals react with 4-aminoantipyrine and hydrogen peroxide to generate an antipyrilquinoimine red product, which exhibits the maximum absorption at 505 nm. The absorbance signal is proportional to the rate of H2O2 consumption, which is also dependent on the concentration of active enzyme in the solution. A schematic diagram of the FI analytical method is shown in Figure 1.
The analytical method obeys the Beer’s law in a concentration range of 0.5-100 µmol L-1 of hydrogen
peroxide with an excellent correlation coefficient (r = 0.9998) and a limit of detection of 0.3 µmol L-1
(10.2 µg L-1) at pH 7.0. At a low rate of 1.2 mL min-1, a
sampling rate of 50 injections per hour can be reached and the relative standard deviation, RSD of the peak signals are better than 2%. The accuracy of the analytical method was evaluated from recovery tests made by fortiication of rainwater samples with hydrogen peroxide concentration in 4up to 20 µmol L-1 range. The recovery
results carried out with ive different rainwater samples showed values ranging from 97 to 101% (n = 3). Organic hydroperoxides such as methyl hydroperoxide [CH3O2H] and peroxyacetic acid [CH3C(O)O2H], which are often present in rainwater samples, do not interfere in the determination of hydrogen peroxide. All measurements were made at room temperature (25 ± 1 oC).
Results and Discussion
Between July 2001 and January 2006 the rainwater was collected in the central area of Sao Paulo City and analyzed for H2O2, SO42−, HCOO−, pH and electrical conductivity. The rainfall sampled was 1,067 mm, corresponding to 25% of the total precipitation in the period in this area. Most rainfall occurred between September and February months
(spring and summer seasons), corresponding to 786 mm precipitation amount.
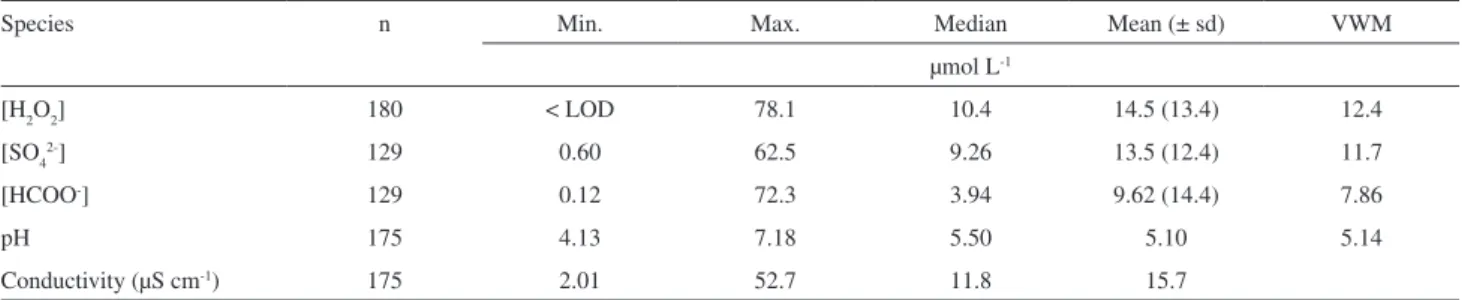
Table 1 shows the statistical data of the hydrogen peroxide, sulfate and formate concentrations, pH and conductivity values for rainwater samples. The H2O2 concentration ranged from 0.5 to 78.1 µmol L-1, with an
average value of 14.5 µmol L-1. The hydrogen peroxide
concentrations measured in Sao Paulo megacity showed higher variation than those measured in rainwater sampled in Salvador, Bahia (Brazil) and Miami, Florida (EUA).13,23
The higher seasonal variation in sunlight and the more polluted air in Sao Paulo, when compared with the two other cities, may explain the difference in variation of H2O2 concentrations.
The higher concentrations (> 50 µmol L-1) of H 2O2
were observed in four rain events in 9/20/2002, 9/13/2003, 1/15/04 and 10/26/2005. All these rain showers occurred at early afternoon (between 1:00 and 3:00 pm) and were preceded by mornings with intense solar radiation and high temperature, which favors the photochemical process into the atmosphere and accelerates the formation of HO2 radicals and the production of H2O2.
The volume-weighted mean H2O2 concentration was 12.4 µmol L-1. This value was much lower than
those concentrations measured in Brazilian urban areas of Salvador,13 Bahia, 124 µmol L-1 and Juiz de Fora,15
Minas Gerais, 23.4 µmol L-1 but almost two times higher
than that in Santiago,10 Chile, 6.6 µmol L-1 and Miami,23
Florida, 6.9 µmol L-1 and similar to that in Mexico City,12
11.2 µmol L-1.
The concentrations of H2O2 exhibited a signiicant seasonal variability (Figure 2a). The higher H2O2 concentrations were measured in the spring rains (September-November) (average = 20.7 µmol L-1,
n = 61) while the lower concentrations were obtained in rainwater samples collected in winter (June-August) (mean = 8.6 µmol L-1, n = 10). The spring season is
characterized by strong solar radiation and higher biogenic emission of volatile organic compounds (VOCs) to the
atmosphere, which favors the H2O2 production in the gas phase and the aqueous phase. Results obtained from air quality monitoring in MASP indicate that maximum ozone concentrations have also been observed in spring (Figure 2b), emphasizing the increase of the photochemical processes into the atmosphere in this season.18
Table 1. Statistical information about hydrogen peroxide, sulfate and formate concentrations, pH and conductivity values in rainwater samples collected in downtown Sao Paulo City, June 2001-January 2006
Species n Min. Max. Median Mean (± sd) VWM
µmol L-1
[H2O2] 180 < LOD 78.1 10.4 14.5 (13.4) 12.4
[SO42-] 129 0.60 62.5 9.26 13.5 (12.4) 11.7
[HCOO-] 129 0.12 72.3 3.94 9.62 (14.4) 7.86
pH 175 4.13 7.18 5.50 5.10 5.14
Conductivity (µS cm-1) 175 2.01 52.7 11.8 15.7
n = sample number, LOD = limit of detection (0.3 µmol L-1).
Figure 2. Box and whisker plots of (A) H2O2 concentrations in different seasons in Sao Paulo City rainwater and (B) monthly number of days that overpass the ozone Air Quality Standard (AQS = 160 µg m-3, CETESB),
for period between July 2001 and January 2006. Horizontal lines in the box: 25th, 50th and 75th percentile values; error bars: 5th and 95th percentile
The pH values ranged from 4.13 to 7.18, presenting a mean value of 5.10 and VWM of 5.14 (Table 1). More than 55% of the rainwater had a pH value between 5.0 and 5.5 and almost 23% of the samples presented pH values lower than 5.0. The average pH determined in this six-year study was higher than that measured in two other wet-only studies conducted in the West side of Sao Paulo City during the late 1980s and mid-1990s, which obtained mean pH values of 4.5 (n = 450) and 4.5 (n = 27), respectively.17
Classically, the results registered in literature indicate that H2O2 is the main oxidant for SO2 in the atmospheric liquid phase at pH values < 5, which can result in negative correlation between H2O2 and SO42− concentrations in rainwater.24 Nevertheless, a low positive and significant
correlation (r = 0.37, n = 129, p < 0.0001) between H2O2 and SO42− was obtained in this study, as it can be seen in Figure 3A. Additionally, Figure 3B shows that higher H2O2 concentrations were observed in samples with pH values < 5, indicating that the destruction of hydrogen peroxide by sulfur dioxide is not the predominant factor controlling H2O2 in the rainwater of this area. The positive correlation could be a result of higher concentration of H2O2 precursors in liquid phase with other pollutants that generate SO42− in rain, such as the dissolution of particulate matteras well as the oxidation of SO2 in gaseous phase with transfer to the liquid phase.19,24
A signiicant correlation (r = 0.70, p < 0.0001) was observed between H2O2 and HCOO− concentration (Figure 3C) suggesting the production of HCOO− and H2O2 by reactions in aqueous phase through formaldehyde oxidation by OH• radical.25 The reactions begin with the
HCHO dissolution in the atmospheric aqueous phase (intrinsic Henry’s constant, H = 1.3 mol L-1 atm-1), followed
by its hydration which increases its solubility (effective Henry’s constant H* = 3.0×10³ mol L-1 atm-1) and favors the
gemdiol (geminal diol) production, reaction 1.25 In parallel,
there is the radicals dissolution, OH• and HO 2
•, Henry’s
constant, H = 30 and 1-3×10³ mol L-1 atm-1, respectively,26
which favors the oxidation processes (reactions 2-3), producing more radicals and formic acid. The reactions sequences inish with the H2O2 yielding (reaction 4):
HCHO(g) + H2O CH2(OH)2 (1)
CH2(OH)2 + OH•→ CH(OH) 2
• + H
2O (2)
CH(OH)2• + O
2→ HCOOH + HO2
• (3)
HO2• + HO 2
•→ H
2O2 + O2 (4)
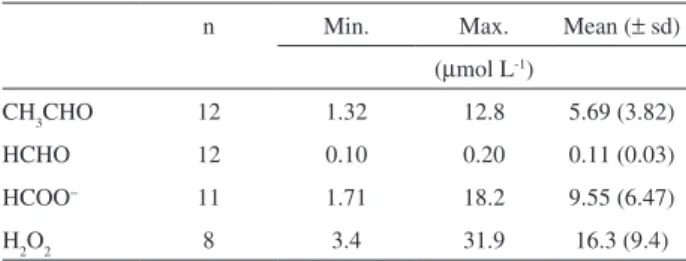
In attempt to interpret these reactions in Sao Paulo rainwater, formaldehyde (HCHO) and acetaldehyde
(H3CCHO) were also measured. Results of this experiment (Table 2) indicate the predominance of acetaldehyde. On the other hand, likewise data shown in Figure 3C, a positive correlation was observed between H2O2 and HCOO− for this set, even considering the small number of samples. Concentrations of aldehydes Figure 3. H2O2 concentration variation vs: (A) [SO42−], (B) pH and
reported in gas phase of Sao Paulo City are at tens of ppbv levels and shows HCHO/H3CCHO ratio close to one.27,28 If these aldehydes concentrations in gas
phase are similar, higher [HCHO] should be expected in aqueous phase, talking in account that the HCHO effective Henry’s constant, H* = 3.0×10³ mol L-1 atm-1
is higher than the H3CCHO, H* = 1.14×10 mol L-1 atm-1.26
However, the results on Table 2 show H3CCHO concentrations higher than those of HCHO, suggesting the consumption of gemdiol by reactions with radicals (reactions 2 and 3) and the production of H2O2 and HCOO−.
The air temperature ranged from 9 to up 31.3 oC, with
and mean value of 22.5oC. The higher temperature values
were measured in the summer and lower in the winter. The relationship between H2O2 concentration in rainwater and air temperature showed a temperature range between 18 and 26 oC in which H
2O2 maximum concentrations
were observed. This result suggest that reactions of H2O2 decomposition are predominant in higher temperatures while lower temperatures do not provide favorable conditions for photochemical reactions to production of H2O2, as previously suggested.16
The relationship between the precipitation volume and the concentrations of H2O2 was investigated using a regression analysis in order to evaluate the inluence of rainfall on H2O2 content in rainwater. Most rainwater samples showed volume < 10 mm. The evaluation of H2O2 concentrations data versus the rainfall shows a weak correlation (r = −0.15, n = 180, p < 0.07), indicating that the H2O2 concentrations were not controlled by dilution during these measurements. On the other hand, the regression analysis of H2O2 concentrations as a function of the precipitation rate showed a signiicant linear correlation, denoting that lower rainfall rate lead to higher H2O2content in several rainstorms, which agrees with the results obtained in H2O2 rainwater measurements carried out in Salvador area, Bahia.13
By using the volume-weighted mean H2O2 concentration of 12.4 µmol L-1 and the annual average precipitation
amount of 1.0 m y-1 in this site sampling, the annual
rate of H2O2 wet deposition for this 5-year study was 12 mmol m-2 y-1. Considering the lack of other data for
H2O2 wet deposition in Brazil, the annual wet deposition of H2O2 was compared with studies conducted in U.S.A. and in Japan. In Sao Paulo, it was slightly higher than that obtained in Kyoto in 1999 and in 2000, 11.7 and 9.11 mmol m-2 y-1, respectively,29 and exactly equal to
the wet deposition value obtained in Wilmington, North Carolina between 1992 and 1994.30 However, it was much
higher than the value of 1.5 mmol m-2 y-1 found in Los
Angeles during 1985-1991.31 The lower anual average rain
amount (0.34 m y-1) and the greater decomposition of H 2O2
by reactions with other pollutants in the Los Angeles area may explain this signiicant difference.
The H2O2 wet deposition showed signiicant seasonal variation. Considering that both concentrations and precipitation volume are higher in the spring and summer, nearly 70% of annual H2O2 wet deposition occurs between October and February in Sao Paulo City.
Proile of variations of H2O2 concentrations during some rain events
In order to investigate the variability patterns of H2O2 concentrations during the rainstorms in Sao Paulo and the meteorological factors that can inluence its concentration, several continuous measurements of H2O2 were conducted. Most of these measurements were carried out in summer and spring (rainy period) and just one sequential rain sample was collected in fall, which corresponds to dry season. Usually, the rain events in Sao Paulo occur in the afternoon and are preceded by periods of intense solar radiation in spring and summer. Short lasting light showers are frequently observed in fall and winter. The hydrogen peroxide concentration was measured in thirteen rain events and showed three patterns of temporal variation. During the irst 10 mm of rain, the H2O2 content increased in six events while its concentration declined in ive others. An irregular variation in H2O2 concentration was observed in remaining storms.
Figure 4 shows some examples of temporal variation of H2O2 concentrations. The rainstorm of October 09, 2003 (Figure 4a) occurred at the middle of the afternoon and was preceded by a sunny morning. The temperature ranged between 22.8 oC at early morning to 30.1 oC at
midday. From 1:00 pm, the air temperature was slowly decreasing and attained 28.3 oC at 3:40 pm, when a heavy
rain with thunder started. The H2O2 concentration measured in the initial rain sample (collected at 4:00 pm) was high (21.9 µmol L-1). The H
2O2 content increased continuously
Table 2. Acetaldehyde, formaldehyde, formate and hydrogen peroxide concentration in rainwater samples in downtown Sao Paulo, corresponding to January 19-31/2006
n Min. Max. Mean (± sd)
(µmol L-1)
CH3CHO 12 1.32 12.8 5.69 (3.82)
HCHO 12 0.10 0.20 0.11 (0.03)
HCOO− 11 1.71 18.2 9.55 (6.47)
during the rainfall, reaching 42.6 µmol L-1 in the last sample
collected at 6:25 pm. The high H2O2 concentration in the irst sample can be attributed to the photochemical reactions in the atmosphere before the precipitation. The increase of H2O2 concentration in the following samples could be due to the lightning during thunderstorms in the area producing H2O2 in clouds. Evidence of the hydrogen peroxide production in rainwater by lightning during thunderstorms was previously suggested.32,33 Additionally, the decrease of rainfall rate from
the second sample may also have contributed to the increase of H2O2 concentration in the rainwater.
On November 28, 2002 (Figure 4b), the H2O2 concentrations were measured in a rainstorm sampled between 2:00 and 5:45 pm. Likewise in October 2003, the precipitation occurred after an intense solar radiation in the morning and in the early afternoon. At 1:00 pm the temperature value attained 32.4 oC, which indicated
favorable conditions for photochemical H2O2 production in the atmosphere. The concentration of H2O2 in the irst sample collected was high, 27.3 µmol L-1 and it was
virtually constant (27.6 µmol L-1) in the second sample
collected between 3:25 and 5:00 pm. Afterwards, the
content of H2O2 started decreasing until the end of the rainstorm, probably due to signiicant increase in rainfall rate which minimizes the scavenging process of H2O2 in the atmosphere below clouds.
Figure 4c shows the H2O2 concentrations for a light shower collected on November 16, 2004 after a rainy night. The diurnal temperature ranged from 19.7 to 21 oC. The
precipitation started again in the morning of November 16 and it was preceded by cloudy weather conditions. The H2O2 concentration was low in the irst sample collected at 11:15 am, 2.8 µmol L-1 and increased up to 9.3 µmol L-1,
measured in the forth sample collected when the rain was over at 3:40 pm. This is an indicative that even in rainy days the photochemical production of hydrogen peroxide in the atmosphere is enough to increase the H2O2 levels in rainwater. A similar pattern of variation in H2O2 concentrations was found in precipitation collected in warm season of North Carolina.30
The rainstorm of September 20, 2002 (Figure 4d) started at 1:30 pm after a partial cloudy morning. At the beginning, H2O2 concentration was 18.7 µmol L-1, rising
to 51.8 and to 78.1 µmol L-1 up to the irst 5 mm of rain.
The signiicant increase in H2O2 content may be attributed to the occurrence of intense activity of lightning in the area observed in the irst 30 min of rain.33 In subsequent
rain fractions (Figure 4d), the H2O2 concentration declined continuously until 18 mm of rainfall. The raise of H2O2 concentration at the end of rain may have been a result of the reduction precipitation rate, which usually favours the removal processes of atmospheric hydrogen peroxide.
These sequential analyses in the rainstorm show that the previous meteorological conditions, lightning and rainfall rate can inluence the H2O2 contents in rainwater in Sao Paulo.
Conclusions
The concentrations of H2O2, SO42−, HCOO− and H+
were measured in rainwater collected in the center of Sao Paulo City between July 2001 and January 2006. The H2O2 concentrations in rainwater ranged from 0.5 to 78.1 µmol L-1
with an average value of 14.5 µmol L-1. The concentrations
of H2O2 exhibited a seasonal variation in rainwater with higher values obtained in the spring and lower in the winter. The pH values ranged from 4.13 to 7.18, presenting a mean value of 5.10 and VWM of 5.14, suggesting that the rainfall was slightly acidic. The hydrogen peroxide concentrations showed a positive correlation with sulfate and hydrogen ion concentrations, which suggests that the decomposition of hydrogen peroxide by reaction with SO2 is not predominant in the rainwater in Sao Paulo City.
A positive and signiicant correlation was observed between H2O2 and HCOO−concentrations, showing that the production of H2O2 in aqueous phase by consumption of formaldehyde by reaction with OH• radical can be a
factor controlling the H2O2 levels in the rainwater in this area. The main source of aldehydes in rainwater is the gas-phase aldehydes which are emitted by combustion of the ethanol and gasohol (a mix of gasoline and 22% of ethanol), the most common fuels used in almost six million light vehicles in MASP. Additionally, the dissolution of gaseous H2O2 and/or its production by lightning activities during thunderstorms may also contribute to the hydrogen peroxide concentrations in the rainwater of Sao Paulo City.
The levels of H2O2 were not controlled by dilution. However, there was a significant inverse correlation between the concentrations of H2O2 and the precipitation rate, indicating that lower rainfall rates conduct to higher H2O2 contents in several rainstorms. The estimated annual rate of H2O2 wet deposition was 12 mmol m-2 y-1, and 70%
of this amount is deposited in the spring and in the summer,
approximately. The temporal measurements of the H2O2 concentrations monitored in thirteen rainstorms show a diurnal variation in rainwater H2O2 concentrations being the higher contents of H2O2 measured in rains occurying in the early afternoons after sunny mornings. Lightning activities and the rainfall rate were important factors which affected the H2O2 contents during the rainstorms.
Acknowledgments
The authors acknowledge Fundação de Amparo à Pesquisa do Estado de Sao Paulo (FAPESP) and Fundo Mackenzie de Pesquisa (MACKPESQUISA) for the inancial support of this work.
References
1. Sakugawa, H.; Kaplan, I. R.; Tsai, W.; Cohen, Y.; Environ. Sci.
Technol. 1990, 24, 1452.
2. Gunz, D. W.; Hoffmann, M. R.; Atmos. Environ.1990, 24A, 1601.
3. Lee, M. H.; Heikes, B. G.; O’Sullivan, D. W.; Atmos. Environ.
2000, 34, 3475.
4. Reeves, C. E.; Penkett, S. A.; Chem. Rev.2003, 103, 5199. 5. Macdonald, A. M.; Anlauf, K. G.; Banic, C. M.; Leaitch, W.
R.; Wiebe, H. A.; J. Geophys. Res.1995, 100(D4), 7253. 6. Peña, R. M.; García, S.; Herrero, C.; Lucas, T.; Atmos. Environ.
2001, 35, 209.
7. Chung, M.Y.; Muthana S.; Paluyo, R.N.; Hasson, A.S.; Atmos.
Environ.2005, 39, 2981.
8. Faust, B. C.; Anastasio, C.; Allen, J. M.; Arakaki, T.; Science
1993, 260, 73.
9. Balasubramanian, R.; Husain L.; J. Geophys. Res.1997, 102, 21209.
10. Ortiz, V.; Rubio, M. A.; Lissi, E. A.; Atmos. Environ.2000, 34, 1139.
11. Sowka, I.; Zwozdziak, J.; Zwozdziak, A.; Szczurek, A.; Water,
Air, Soil Pollut.2004, 155, 321.
12. Padilla, H.; Torres, M. C.; Belmont, R.; Garcia, R.; Mendoza, E.; Baez, A.; Chemistry and Ecology2007, 23, 325.
13. Jacob, P.; Tavares, T. M.; Rocha, V. C.; Klockow, D.; Atmos.
Environ.1990, 24, 377.
14. Matos, R. C.; Pedrotti, J. J.; Angnes, L.; Anal. Chim. Acta2001,
441, 73-79.
15. Matos, R. C.; Coelho, E. O.; Souza, C. F.; Guedes, F. A.; Matos, M. A. C.; Talanta2006, 69, 1208.
16. Santos, M. A.; Pedrotti, J. J.; Fornaro, A. In Highway and
Urban Environment, Proceedings of the 8th Highway and Urban
Environment Symposium; Morrison, G. M.; Rauch, S., eds.,
Springer: Dordrech, 2007, ch. 2.
18. CETESB. Relatório de Qualidade do Ar no Estado de São
Paulo, 2006, Secretaria do Meio Ambiente, Série Relatórios,
ISSN 0103-4103, São Paulo, Brasil, 2007. (http://www.cetesb. sp.gov.br/Ar/relatorios/RelatorioAr2006.zip).
19. Leal, T. F. M.; Fontenele, A. P. G.; Pedrotti, J. J.; Fornaro, A.;
Quim. Nova2004, 27, 855.
20. Santos, M. A.; Illanes, C. A. F.; Fornaro, A.; Pedrotti, J. J.;
Water, Air, Soil Pollut.: Focus2007, 7, 85.
21. Kawamura, K.; Steinberg, S.; Ng, L.; Kaplan, I. R.; Atmos.
Environ.2001, 35, 3917.
22. Gonçalves, C.; Matos, R. C.; Pedrotti, J. J.; Abstracts do 11o
Encontro Nacional de Química Analítica, Campinas, Brasil,
2001.
23. Deng, Y.; Zuo, Y.; Atmos. Environ.1999, 33, 1469.
24. Seinfeld, J. H.; Pandis, S. N.; Atmospheric Chemistry and
Physics - From Air Pollution to Climate Change, 2nd ed., John
Wiley & Sons, Inc.: Hoboken, 2006.
25. Kieber, R. J.; Rhines, M. F.; Willey, J. D.; Avery, G. B. Jr.;
Atmos. Environ. 1999, 33, 3659.
26. Finlayson-Pitts, B. J.; Pitts, J. N.; Chemistry of the Upper and Lower Atmosphere - Theory, Experiments, and Applications,
Academic Press: San Diego, 2000.
27. Montero, L.; Vasconcelos, P. C.; Souza, S. R.; Pires, M. A. F.; Sanchez-Ccoyllo, O.; Andrade, M. F.; Carvalho, L. R. F.;
Environ. Sci. Technol.2001, 35, 3071.
28. Nguyen, H. T.; Takenaka, N.; Bandow, H.; Maeda, Y.; Oliva, S. T.; Botelho, M. M. F.; Tavares, T. M.; Atmos. Environ. 2001,
35, 3075.
29. Yamada, E.; Tomozawa, K.; Nakanishi,Y.; Fuse, Y.; Bull. Chem.
Soc. Jpn.2002, 75, 1385.
30. Willey, J. D.; Kieber, R. J.; Lancaster, R. D.; J. Atmos. Chem.
1996, 25, 149.
31. Sakugawa, H.; Kaplan, I. R.; Shepard, L. S.; Atmos. Environ.
1993, 27, 203.
32. Kok, G. L.; Atmos. Environ.1980, 14, 653.
33. Zuo, Y.; Deng, Y.; Geochimica et Cosmochimica Acta1999, 63, 3451.
Received: May 20, 2009 Web Release Date: November 26, 2009

![Figure 3. H 2 O 2 concentration variation vs: (A) [SO 4 2− ], (B) pH and (C) [HCOO − ]](https://thumb-eu.123doks.com/thumbv2/123dok_br/18994853.461870/5.892.477.822.116.923/figure-h-o-concentration-variation-vs-b-hcoo.webp)