Article
Acid-Basic and Complexation Properties of a Sedimentary Humic Acid. A Study on the Barra
Bonita Reservoir of Tietê River, São Paulo State, Brazil
Gilberto Abate and Jorge C. Masini*
Instituto de Química, Universidade de São Paulo, C. P. 26077, 05513-970, São Paulo, SP, Brazil
Estudaram-se as propriedades ácido-base e de complexação de ácido húmico (AH) isolado de sedimento de rio por titulação potenciométrica, adotando-se o modelo de distribuição de sítios discretos e funções de Gran modificadas para tratamento dos dados. Foram caracterizadas seis classes de grupos tituláveis, com valores de pK entre 2,4 e 10,2. Grupos carboxílicos contribuiram com 66% do total de sítios ionizáveis. Estudaram-se as propriedades complexométricas com os íons Cu2+,
Pb2+, Cd2+ e Zn2+ através de titulações potenciométricas com eletrodo íon-seletivo para Cu ou
eletrodos de amálgama (Pb, Cd e Zn). O tratamento dos dados pelo método de Scatchard revelou a existência de duas classes de sítios complexantes para cobre e chumbo e uma classe para cádmio e zinco. As constantes de estabilidade médias seguiram a ordem: log KAH-Cu > log KAH-Pb > log KAH-Cd ≅ log KAH-Zn, e a ordem da capacidade complexante, Cc, foi: Pb > Cu > Cd ≅ Zn.
Acid-base and complexation properties of humic acid (HA) isolated from a river sediment were studied by potentiometric titration, adopting the discrete site distribution model and the modified Gran functions for data fitting. Six classes of titratable groups were characterized, with pKa values between 2.4 and 10.2. Carboxylic groups accounted for 66% of the total of ionizable sites. The complexing properties were studied with regard to Cu2+, Pb2+, Cd2+ and Zn2+ ions by potentiometric titration
using Cu ion selective electrode, or amalgam electrodes (Pb, Cd and Zn). The data treatment by the Scatchard method revealed two binding sites for copper and lead and one binding site for cadmium and zinc. The average stability constants were in the following order: log KHA-Cu > log KHA-Pb > log KHA-Cd ≅ log KHA-Zn, while the complexing capacity order, Cc, was: Pb > Cu > Cd ≅ Zn.
Keywords: humic acid, acid-base titrimetry, river sediment, complexation capacity
Printed in Brazil 0103 - 5053 $6.00+0.00
e-mail: [email protected]
Introduction
Trace heavy metals introduced into lake and reservoir waters by riverine or atmospheric inputs are involved in a number of chemical, biological and physical processes that determine their concentrations in the aqueous phase, as well as in the suspended particles and sediments. The most im-portant processes for heavy metals removal from the water column are precipitation and settling in association with particulate material, so that sediments are the predominant sink of these toxic species in lakes and reservoirs. Organic carbon (as plankton and biological debris), calcium carbon-ate, iron and manganese oxy hydroxides, and aluminosili-cates are among the major settling particles in lake and res-ervoir waters1. The bioavailability of heavy metals will de-pend on their affinity with the above mentioned phases of the sediment or suspended matter2-5.
Humic substances are heterogeneous macromolecular aggregates that comprise the main part of natural organic carbon in soils, waters and sediments. These substances are formed in aquatic and terrestrial environments by decompo-sition of plants, animals and micro-organisms. The large num-ber of ionizable sites on humic substances, mainly carboxy-lic and phenocarboxy-lic groups, provides an appreciable ability to form stable complexes with heavy metal cations. Humic matter has also the ability to enclose mineral particles, pro-ducing aggregates with a significant enhancement in their adsorption or complexation capacity2,6,7.
(capital of São Paulo State, Brazil), where the river receives a great pollution charge from the metropolitan area, that houses a population near 17 million people. Unlikely other reservoirs closer to São Paulo city, that are very polluted, Barra Bonita reservoir is used as water supply and as a resort area, so that the study of complexation/adsorption properties of the major binding components in this envi-ronment would be important to understand the effects of the pollution inputs in upriver areas.
Experimental
Apparatus and reagents
Potentiometric measurements were made with two Metrohm 654 pH-meters (precision of 0.1 mV or 0.001 units of pH). For acid base titration and pH measurements during complexometric titrations, a Mettler Toledo HA405-60-88G-S7/120 - Ag/AgCl combination glass electrode was used. For complexometric titrations both pH-meters were used; one of them was used for monitoring the pH, that was kept at pH 6.00 ± 0.05 with the aid of the above mentionated combination glass electrode. The other pH-meter was used with an ion selective electrode (ISE-Orion 9429) for Cu(II), or with a hanging mercury drop elec-trode (HMDE - Metrohm 6.0335-000) filled with Pb, Cd or Zn amalgams, prepared according previous papers8,9,
and using a double junction Ag/AgCl reference electrode (Mettler 373-90WTEISE-S7/105).
All titrations were performed at 25.0±0.1oC. The tem-perature was controlled by circulating water from an Etica 521D thermostat through the external jacket of the titra-tion cell.
A Gilmont GS 4200 A microburette (capacity of 2.5 mL and precision of 0.1 µL) was used for titrant addition during the acid base titrations, or for addition of small amounts of a 2 x 10⁻³ mol L-1 NaOH solution during the
complexometric titrations in order to keep the pH constant at 6.00±0.05. A Gilmont GS 1200 A microburette (capac-ity of 2 mL and precision of 2 µL) was used in the complexometric titrations for addition of titrant solutions (5.00 x 10⁻³ mol L-1 Cu2+, Pb2+, Cd2+ or Zn2+).
Spectrophotometric measurements were carried out using a Micronal B-382 spectrophotometer. Elemental analyses (C, H, N) were performed with a Perkin-Elmer - Elemental Analyser 2400 CHN. The elements Al, Fe, Mn, Cu, Zn were determined in the Barra Bonita sedi-ment after its digestion using a CG-AA-7000-BC flame atomic absorption spectrometer with deuterium back-ground corrector.
All reagents were of analytical grade from Merck,
Aldrich or Sigma. The preparation of the standard solu-tions of metallic casolu-tions and sodium hidroxide solusolu-tions has already been described in the literature9,16-18.
Sample preparation
Humic acid isolation and purification was based on the protocol proposed by the International Humic Substances Society (IHSS) that has been used in several studies7,10,11. Sediment samples were collected with a Birge-Eckman dredge in several points of the reservoir and stored in sealed polyethylene bottles at 4oC, until the HA isolation. Samples
were mixed and dried in an open polyethylene container at room temperature for 5 days. About 1.0 kg of the sediment was used to extract the humic acid in a closed polyethyl-ene container. The first step was the addition of 10 L of 0.1 mol L-1 HCl and the adjustment of the pH between 1 and 2 with 1 mol L-1 HCl. The suspension was shaken in a
hori-zontal shaker for one hour and then allowed to settle over-night. The supernatant was discarded, and the pH of the solid phase was adjusted to 7.0 with 1 mol L-1 NaOH, fol-lowed by addition of 10 L of 0.1 mol L-1 NaOH under
ni-trogen atmosphere, to minimize oxidation of humic mate-rial. The container was stoppered under N2 atmosphere, shaken in a horizontal shaker for 4h, and allowed to rest overnight. The supernatant was centrifuged at 9000 g for 20 min and the solid phase was discarded. The humic ma-terial in the liquid fraction was precipitated by adding 6 mol L-1 HCl solution until pH 1.0, and allowed to stand for 15 h. The liquid phase was discarded and the humic acid was dissolved in a suitable volume of 0.1 mol L-1 KOH solution under nitrogen atmosphere. The ionic medium was adjusted to 0.3 mol L-1 by addition of KCl, leading to col-loid coagulation, and precipitation of a mineral phase that was separated by centrifugation. The pH of the solution was adjusted to 1.0, according to previously described, and the humic acid was separated by centrifugation. This ma-terial was maintained in 0.1 mol L-1 HCl and 0.3 mol L-1
HF overnight to dissolve silica and silicates. Finally, the humic acid fraction was dialysed in a Spectra/Por 7 mem-brane (molar mass cut-off = 1,000 D), until no significant change was observed in the conductance of the water ex-ternal to the dialysis bag.
The suspension was diluted in a volumetric flask and stored at 4oC. The concentration of the stock was deter-mined as 4.28 g L-1 by the dry weight of a measured
vol-ume of the homogenized suspension.
Molar mass profile
stationary phase and a solution composed of 10-3 mol L-1
borate buffer (pH = 9.20) in 0.1 mol L-1 NaCl as eluent. A
90 cm long column with 1.5 cm of internal diameter was calibrated with globular proteins (Sigma Chemical Co.): 5.0 mg mL-1 bovine albumin (66,000 D), 2.0 mg mL-1 carbonic anhydrase (29,000 D), 2.0 mg mL-1 cytochrome C (12,400
D) and 3.0 mg mL-1 aprotinin (6,500 D). The void volume
of the column was determined with blue dextran marker (2,000,000 D). The flow rate of the mobile phase was kept at 0.718±0.006 mL min-1, and the absorbance was
moni-tored at 280 nm. Humic acid suspensions (1 mg mL-1) in 10-3 mol L-1 borate buffer and 0.1 mol L-1 NaCl were eluted
under the same conditions used for the globular proteins.
Acid-base titrations
The calibration of the glass electrode was performed just before the humic acid titrations, in terms of H+
con-centrations instead activities15,16.
Titrations were performed with 50.00 mL of 1.105 g L-1 humic acid suspensions in ionic medium of 0.1 mol L -1 NaCl using a standard 0.1 mol L-1 NaOH titrant solution
containing the same concentration of NaCl. Also, 50.00 mL aliquots of 30 mg L-1 HA suspensions were titrated in
0.02 ionic strength (NaNO3) using a standard 0.005 mol L-1 NaOH with the same ionic strength. The experimental
procedure of the titrations, as well as the data treatment have been described in previous papers16-18.
Complexometric titrations
All titration and calibrations were performed at 25.0±0.1oC, in ionic medium of 0.02 mol L-1 NaNO
3 and
pH 6.00±0.05. For studies with Pb2+, Cd2+ and Zn2+, po-tentiometric amalgam electrodes were prepared according to a previous paper9 with the aid of a Metrohm Hanging Mercury Drop Electrode. For these experiments, all solu-tions were previously degassed with ultrapure N2 (O2 < 1 ppm) for 10 minutes. A N2 flow was kept inside the cell during all the titration procedure8. For studies with Cu2+ ions, an Orion 9429 copper ion selective electrode (ISE) was used.
The humic acid solutions were prepared in a range of concentrations between 20 and 30 mg L-1. Titrations were performed with 20.00 mL of humic acid suspension, add-ing initial increments of 20 µL of titrant (5.00x10⁻³ mol L-1 in Cu2+, Pb2+, Cd2+, or Zn2+) from a Gilmont GS
1200 A burette. The pH was kept constant at 6.00±0.05 by adding adequate amounts of 2x10⁻³ mol L-1 NaOH
from another burette. The titrant and NaOH solutions were prepared in 0.02 mol L-1 NaNO
3. As the titration
pro-ceeded, the increments of titrant were increased up to 100
µL, so that 30 points of volume and potential were taken. Calibrations were performed similarly with 20.00 mL of 0.02 mol L-1 NaNO3 solution. The amalgam drops were renewed at each titration point after the titrant addition and pH correction. The potential values were taken after 5 min of equilibration, when the potential drift was smaller than 0.555 mV min-1.
Determination of metals in Barra Bonita sediment and humic acid samples
The content of Fe, Mn, Cu, Al, Zn, Cd and Pb bounded to the sediment was determined after a digestion, per-formed as follows: 1.0 g (± 0.1 mg) of dry sediment was boiled with 4 mL of concentrated HNO3, followed by a digestion with 2 mL of 30 % (w/w) H2O2 and 1 mL of concentrated HNO3 until dryness to decompose the or-ganic matter19. The solutions were filtered in a 0.45µm
Millex membranes, diluted with 1% HNO3 in 50.00 mL volumetric flasks, and then analysed by flame atomic absorption spectrometry with deuterium background cor-rector. All analyses were performed using air-C2H2 flame, except Al that requires N2O-C2H2 flame, and addition of KCl to avoid ionization effects19. The analysis of the
humic acid was performed similarly to described for sedi-ment, but only 0.1 g was used, owing to the small amount of available sample.
Results and Discussion
Elemental composition and ash contents
Table 1 shows the results of elemental composition and ash content. The low ash content indicates a good removal of mineral matter in the extraction and purifica-tion procedure. The H/C, N/C and O/C elemental ratios (1.05, 0.0767, and 0.488, respectively) are essentially in the same range determined by Belzile et al.7 for four
hu-mic acids isolated from sediments of Canadian lakes and by Ishiwatari for Japanese lakes.20 A possible
explana-tion for the high N/C elemental ratio for the sedimentary humic acids, in comparison to soil and water humic ac-ids, is their precursor materials, constituted mainly by phytoplankton, where N/C elemental ratios are among 0.11 and 0.16.21 The empirical formulae for the Barra Bonita humic acid is C:H:O:N = 13:14:6:1, while Belzile et al7 reported an average formulae from the four humic acids, extracted with 0.5 mol L-1 NaOH or 0.1 mol L-1
good agreement with the carboxylic acidity determined by the calcium acetate exchange method16.
Table 1. Elemental composition, ash content and molar elemental ratios for the Barra Bonita sediment humic acid.
C (%) H (%) N (%) O (%) H/C* N/C* O/C* ash (%)
54.1 4.7 4.8 35.1 1.05 0.0767 0.488 1.3±0.1
*calculated on an ash free basis
Molar mass distribution profile
Figure 1 shows the elution profile of the humic acid in comparison to globular proteins from the GPC col-umn. It was observed a fraction eluted at the exclusion volume of the column (2,000,000 D), as well as signifi-cant contribution of molecules with molar masses over all the calibration range (6,500 to 66,000 D), and a maxi-mum contribution at 3,701±117 D. These results, how-ever, should be view with care, because severe pitfalls in the molar mass distribution of humic substances have been reported in the literature22 resulting from the lack of ap-propriate standards, once humic substances may not present a globular spatial conformation.
25 50 75 100 125 150
0,0 0,1 0,2 0,3 0,4 0,5 6 5 4 3 2 1 A b s o rb an c e / 2 8 0 n m
Elution Volume / mL
Figure 1. GPC elution curves, 1 = Blue Dextran (exclusion volume -V0), 2 = Albumin, 3 = Carbonic Anhydrase, 4 = Cytochrome C, 5 = Aprotinin, 6 = Barra Bonita humic Acid. Stationary phase = Sephadex G-100, eluent = 10-3 mol L-1 borate buffer/0.1 mol L-1 NaCl, pH = 9.2,
flow rate = 0.718 mL min-1.
Acid-base characterization
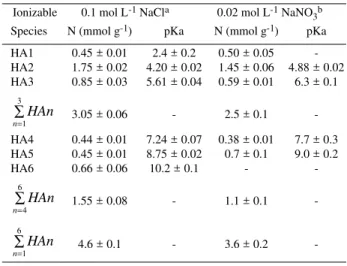
Table 2 shows the stoichiometry and pK of ionizable sites. Six classes of titratable species were characterized by the modified Gran functions in medium of 0.1 mol L -1 NaCl, according to Figure 2, that shows the segmented
and linearized titration curve. Species HA1, HA2 and HA3 may be assigned to carboxylic groups, which was evi-denced in a previous work, where the sum of groups HA1 to HA3 in Aldrich and vermicompost humic acids was in
Table 2. Results of linear regression fittings for acid base potentiometric titration curves of Barra Bonita humic acid suspension in ionic strength 0.1 (NaCl) and 0.02 (NaNO3).
Ionizable 0.1 mol L-1 NaCla 0.02 mol L-1 NaNO 3b
Species N (mmol g-1) pKa N (mmol g-1) pKa
HA1 0.45 ± 0.01 2.4 ± 0.2 0.50 ± 0.05
-HA2 1.75 ± 0.02 4.20 ± 0.02 1.45 ± 0.06 4.88 ± 0.02
HA3 0.85 ± 0.03 5.61 ± 0.04 0.59 ± 0.01 6.3 ± 0.1
HAn n∑=1
3
3.05 ± 0.06 - 2.5 ± 0.1
-HA4 0.44 ± 0.01 7.24 ± 0.07 0.38 ± 0.01 7.7 ± 0.3
HA5 0.45 ± 0.01 8.75 ± 0.02 0.7 ± 0.1 9.0 ± 0.2
HA6 0.66 ± 0.06 10.2 ± 0.1 -
-HAn n∑=4
6
1.55 ± 0.08 - 1.1 ± 0.1
-HAn n∑=1
6
4.6 ± 0.1 - 3.6 ± 0.2
-n=3
Humic acid concentration: a = 1.105 g L-1; b = 30 mg L-1
N = concentration of ionizable sites HAn
0,0 0,2 0,4 0,6 0,8 1,0 1,2
-6 -4 -2 0 2 4 6 8 10 12 -6 -4 -2 0 2 4 6 8 10 12
FHA6.10
12
FHA5.10
11
FHA4.10
9
FHA3.10
7
FHA2.10
6
FHA1.10
4 Mo d ifi ed Gr a n F u n c ti o n s p
c H
Volume of NaOH / mL
Figure 2. Titration curve of 20.00 mL of 1.105 g L-1 Barra Bonita humic
acid suspension in ionic medium of 0.1 mol L-1 NaCl, linearized by
modified Gran functions (FHAn). Titrant = 0.1090 mol L-1 NaOH,
temperature = 25.0 ± 0.1oC.
About 57.4% of the carboxylic groups (sum of HA1 to HA3) presented a pKa of 4.20 (HA2), while 15% presented pKa 2.4 (HA1). This low pKa value may be explained by the location of carboxylic groups in aliphatic α-ether or α -ester cyclic structures with two or three additional elec-tronegative functional groups at adjacent position on the ring23. Keto acid and aromatic carboxyl structure can also
account for ionizable groups with pKa < 3 in HA1 Species HA324, corresponding to 27.9% of carboxylic groups pre-sents a pKa of 5.61, which can reflect local interactions on the macromolecule, as well as the negative charge accu-mulation effect.
The content of carboxylic and phenolic groups in sedi-mentary humic acids is usually lower than observed for soil and water humic acids, while the carbonyl contents are higher. The total of 3.06 mmol g-1 groups admitted as
car-boxylic is in agreement with the literature, that report 2.0 to 4.0 mmol of these groups per gram of sedimentary humic acid3. The total of 1.55 mmol g-1 groups determined with
pKa > 7 (aminic and phenolic) is also within the range be-tween 0.5 and 2.5 mmol g-1 reported in literature for phe-nolic groups in sedimentary humic acids3. Based on the
to-tal acidity of 4.6±0.1mmol g-1 of the Barra Bonita humic acid, one can speculate the average molar mass for each ionizable site as 217 g mol-1. The low content of carboxylic
sites in comparison to fulvic acids and humic acids from soils and water3 is coherent with the significant contribu-tion of high molar mass fraccontribu-tions in the studied sedimentary humic acid. According with the findings of Falzoni et al25 who fractionated humic and fulvic acids, the content of car-boxylic sites was smaller in higher molar mass fractions.
In order to study the acid-base properties of the humic acid under similar conditions to the complexometric study, alkalimetric titrations were performed in medium of 0.02 mol L-1 NaNO3, using a HA concentration of 30 mg L-1. The results of these experiments are also shown in Table 2. Only five classes of titratable species were characterized under these conditions, in addition to the fact that the stoichiometry of the species was systematically smaller than observed for concen-trated solution in 0.1 mol L-1 NaCl medium. Species HA
1
behave as a strong acid and no pKa value was possible to be
characterized. The explanation for this behaviour is not clear at this time, but the titration performed in these poorly buff-ered conditions provides experimental data that are much more subject to error in the [H+] measurement in comparison to the
1 g L-1 humic acid suspension.
Complexometric titrations
Table 3 presents the values of conditional stability con-stant (log K) and complexing capacity (Cc) obtained accord-ing to Scatchard plots3,6,9,26, from the [ML]/[M2+] versus
[ML] shown in Figure 3, where [M2+] represents the
con-centration of the free cations Cu2+, Pb2+, Cd2+ or Zn2+, while [ML] is the concentration of the complexed metal. Since the Scatchard plot is a model that translate the continuous actual distribution of complexing sites to discrete sites, the log K described in Table 3 should be thought as average equilibrium values for the cases where only one class of complexing site is characterized (Cd and Zn). For the cases where two classes of binding sites are characterized (Cu and Pb), the log jK and jC
c values are not only average values,
but mixed values among the stronger and weaker classes of complexing sites, since it is very difficult to completely iso-late the individual contribution of these sites, as is evidenced by the continuous curvature observed in the Scatchard plots for Cu and Pb.
Copper forms the most stable complexes in compari-son to other three cations. The binding site of class 1 (Table 3) binds copper with log K 7.8±0.1 corresponding to complexes more stable than those formed with the class 2 of binding sites. The complexing capacity of the bind-ing sites of class 1 is approximately a half of the class 2, while the total copper complexing capacity was 1,300
µol g-1. From the acid-base potentiometric results
ob-tained in ionic medium of 0.1 mol L-1 NaCl and humic
acid concentration of 1.105 g L-1, it is possible to
esti-mate that at pH 6.0, there are 2,803 µmol g-1 of free car-boxylate sites. From these data, one can speculate that if each copper ion is complexed by binding sites that in-volve two ionizable sites, forming bidentade chelates, the 1,300 µmol g-1 of copper would occupy 93% of the
dis-Table 3. Resultsa of conditional stability constants (jK) and complexing capacity (jC
c) for the Barra Bonita humic acid at 25.0 ± 0.1oC,
pH = 6.00 ± 0.05 and ionic medium of 0.02 mol L-1 NaNO 3.
ion log 1K b 1C
c (µmol g-1) log 2K 2 Cc (µmol g-1) ∑j=1 2 j
Cc (µmol g-1) ∆H+(µmol g-1)c
Cu2+ 7.8 ± 0.1 420 ± 20 6.0 ± 0.1 900 ± 300 1300 ± 300 54 ± 3
Pb2+ 5.6 ± 0.1 1800 ± 100 5.0 ± 0.2 600 ± 100 2400 ± 200 33 ± 2
Cd2+ 4.8 ± 0.1 800 ± 100 - - 800 ± 100 12 ± 2
Zn2+ 4.89 ± 0.06 940 ± 10 - - 940 ± 10 22 ± 3
aResults correspond to an average of five experiments; bThe expoents 1 and 2 in log K and C
c referes to the binding sites of class j = 1 and
tion. The total amount of protons liberated per gram of humic acid is shown in Table 3. It is interesting to notice, however, that the amount of protons liberated is very small in comparison to the total complexing capacity of all four metals studied, suggesting that the chelate formation has a major contribution of dissociated carboxylate sites as well as carbonyl and alcoholic oxygen atoms, or nitrogen atoms.
Lead is also complexed in two different kinds of binding sites, but unlike observed for copper, the log K for both classes differ by only 0.6 units. The class 1 plays the major role in lead complexation, corresponding to 75% of the total complexing capacity. The total Cc of 2,400 µmol g-1 of Pb2+ corresponds to 85% of free dissociated groups at pH 6.0, determined in ionic medium of 0.1 mol L-1 NaCl. If one considers the results of pKa and stoichiometry for ionizable sites determined in 0.02 mol L-1 NaNO
3 and 30 mg L-1 humic acid, the total of
car-boxylic sites would be 2,500 µmol g-1, or 2,150 µmol g-1 of
5,0x10⁻⁶ 1,0x10⁻⁵ 1,5x10⁻⁵ 2,0x10⁻⁵ 0,2
0,4 0,6 0,8 1,0 1,2 1,4
c
[C
dL]
/[
C
d
2+ ]
[CdL] / mol L-1
1,0x10⁻⁵ 1,5x10⁻⁵ 2,0x10⁻⁵ 2,5x10⁻⁵ 0,75
1,00 1,25 1,50 1,75 2,00
d
[Z
nL
]/[
Z
n
2+ ]
[ZnL] / mol L-1
Figure 3. Scatchard plots obtained for Barra Bonita humic acid suspensions (BBHA). a = Cu, b = Pb, c = Cd, d = Zn. Titration conditions: Cu and Cd, volume = 20.00 mL of 33.15 mg L-1 suspension; Pb, volume = 20.00 mL of 22.10 mg L-1 suspension; Zn, volume = 40.00 mL of 33.15 mg L-1
suspension. pH = 6.00 ± 0.05, in ionic medium 0.02 mol L-1 NaNO
3. Titrant concentration = 5.00 x 10⁻³ mol L-1. ISE was used for Cu titration, while
HADE (hanging amalgam drop electrode) was used for Pb, Cd and Zn.
1,0x10⁻⁵ 2,0x10⁻⁵ 3,0x10⁻⁵ 4,0x10⁻⁵ 5,0x10⁻⁵ 0
2 4 6 8 10 12
b
[PbL] / mol L-1
[P
b
L
]/
[Pb
2+ ]
0,0 1,0x10⁻⁵
2,0x10⁻⁵ 3,0x10⁻⁵ 4,0x10⁻⁵ 5,0x10⁻⁵ 0
100 200 300 400 500 600
a
[C
uL
]/
[C
u
2+ ]
[CuL] / mol L-1
sociated sites at pH 6.0. On the other hand, admitting the stoichiometry and pKa values for the ionizable sites de-termined in ionic medium of 0.02 mol L-1 NaNO3, and humic acid concentration of 30 mg L-1, the presence of
2,150 µmol g-1 of free carboxylate sites would be
ex-pected at pH 6.0. In this case, in addition to the binding involving two carboxylate sites, one can also consider the participation of oxygen donor atoms of carbonyl and alcoholic structures, as well as nitrogen containing groups. At pH 6.0 the most part of phenolic and aminic groups are undissociated so that the participation of these groups in the chelation might lead to liberation of protons in so-lution. This process was evidenced by the fact that, dur-ing the humic acid titrations, a larger amount of the 2 mmol L-1 NaOH was necessary to keep the pH at 6.00±0.05 in comparison to the blank titrations. The ad-ditional amount of OH- is equal to the amount of H+
titra-Table 4. Metal contenta extractable from the sediment and humic acid by the HNO
3/H2O2 treatment.
sample Metal concentration (µmol g-1)
Al Fe Mn Cu Zn C (%)
sediment 240 ± 24 91.2 ± 0.1 6.22 ± 0.07 0.77 ± 0.03 0.47 ± 0.01 0.50 ± 0.03
Humic Acid 16.0 27.0 ND b 2.49 0.50 54.1
aResults correspond to an average of three experiments; bND = not detected.
free carboxylate groups at pH 6.0.This suggests that formation of bidentade chelates of Pb2+ with the humic acid necessarily
would involve oxygen electron-donor atoms of carbonyl and alcoholic structures, as well as with nitrogen containing moi-eties. As observed for copper, the proton liberation from undis-sociated groups at pH 6.0 occurs, but corresponds only to a small fraction of the total complexing capacity.
The results for cadmium and zinc were similar, evi-dencing the formation of weak complexes, as well as low complexing capacity in comparison to those observed for copper and lead. The stability of the complexes as a func-tion of the metal cafunc-tion may be ordered as Cu > Pb > Cd ≅ Zn. These results are in agreement with Slavek et al2, who
performed selective extraction of metal cations adsorbed on humic acids with concentrated salt solutions and complexants, verifying that copper was retained in greater extension than lead. Salt solutions extracted only 50% of copper and lead, while complexants (EDTA, DTPA) ex-tracted more than 90% of the retained metals. Cadmium and zinc were only weakly bounded, and about 80% of these metals were extracted with concentrated salt solu-tions. The order of retention observed for Slavek et al2 was Cu > Pb > Cd > Zn.
Metal content in the humic acid and sediment
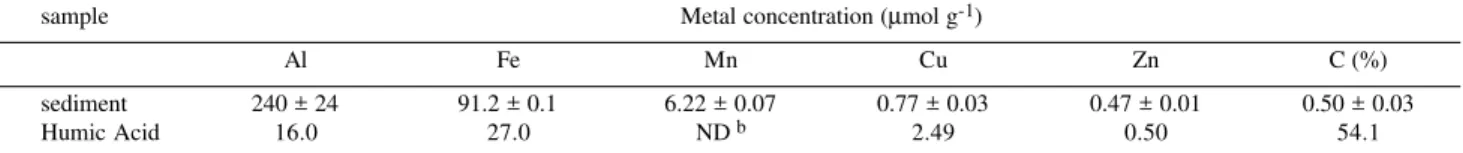
Table 4 shows the metal content that was extracted from the crude sediment by the HNO3/H2O2 treatment19, as well
as the metal content retained in the humic acid through the isolation and purification steps. Lead and cadmium were not detected in these experiments, while copper and zinc were determined in the sediment and in the humic acid. Retention of copper was larger than zinc, in agreement with the stability constants determined by the complexometric titrations. The retention of these metals by the humic frac-tion of Barra Bonita sediment denotes their strong associa-tion with some sites of the natural organic matter. The pres-ence of Cu and Zn in the purified humic acid fraction may be explained by their role as micronutrient for plankton and other living organisms, that are precursors of humic sub-stances1. The low content of organic carbon (0.5%) in the sediment samples of Barra Bonita may be explained by the results of granulometric analysis, which revealed that a frac-tion of only 24% is < 63 µm (the fraction that is supposed to
concentrate the organic matter is the < 20 µm27). If one takes
in account only the < 63 µm fraction, the organic carbon content is about 12%.
Aluminium and iron are among the major components of the sediments and were determined in significant con-centration in the humic acid, suggesting the formation of strong interactions of these metals with natural organic matter. Iron and aluminium may play an important role in the formation of tertiary structure of humic substances.
Conclusions
The I. H. S. S. extraction procedure was suitable to isolate the humic substance from a sediment rich in clays and sand, providing a material with low ash content. Com-position and elemental ratio of the humic acid was very similar to other sedimentary humic acids isolated from very different sampling sites. The content of carboxylic and phenolic sites, that compose the most important binding sites, were also within the range of values reported in the literature for sedimentary humic acids. The stability of the complexes with the four studied metal cations followed the order: Cu > Pb > Cd ~ Zn. The complexing capacity order was: Pb > Cu > Cd ~ Zn.
Acknowledgments
Authors are grateful to FAPESP and CNPq for finan-cial support and fellowships.
References
1. Sigg, L. In Buffle, J., de Vitre, R. R. (Eds), Chemical and Biological Regulations of Aquatic Systems, Lewis Publishers, Boca Raton, FL, United States, 1994, pp. 175-195.
2. Slavek, J.; Wold, J.; Pickering W. F. Talanta1982,
29, 743.
3. Buffle, J. Complexation Reactions in Aquatic Systems: An Analytical Approach, Ellis Horwood Series in Analytical Chemistry, Chichester, 1988.
5. Gulmini, M.; Zelano, V.; Daniele, P. G.; Prenesti, E.; Ostacoli, G. Anal. Chim. Acta1998, 358, 195. 6. Stevenson, F.J. Humus Chemistry. Genesis,
Compo-sition, Reactions, Wiley Interscience, 2nd Edition, New York, Chichester Brisbane, 1994.
7. Belzile, N.; Joly, H. A.; Li H. Can. J. Chem.1997, 75, 14.
8. Bernhard, J. P.; Buffle, J.; Parthasarthy, N. Anal.Chim. Acta1987, 200, 191.
9. Abate, G.; Masini, J. C. Quim. Nova1999, 22, 661. 10. Wershaw, R. L.; Pinckney, D. J.; Llaguno E. C.;
Vicente-Beckett V. Anal. Chim. Acta1990, 232, 31. 11. Qiang, T.; Xiao-quan, S.; Zhe-ming, N. Fresenius J.
Anal. Chem.1993, 347, 330.
12. Mori, S.; Hiraide, M.; Mizuike, A. Anal. Chim. Acta 1987, 193, 231.
13. Kim, J. I.; Buckau, G.; Li, G. H.; Duscher, H.; Psarros N. Fresenius J. Anal. Chem.1990, 338, 245. 14. Klavins, M.; Apsite, E. Environment International
1997, 23, 783.
15. Pehrson, L.; Ingman, F.; Johansson, A. Talanta1976,
23, 769.
16. Masini, J. C.; Abate, G.; Lima, E. C.; Hahn, L. C.; Nakamura, M. S.; Lichtig, J.; Nagatomy, H. R. Anal.
Chim. Acta1998, 364, 223.
17. Aleixo, L. M.; Godinho, O. E. S.; Costa, W. F. Anal. Chim. Acta1992, 257, 35.
18. Masini, J. C. Anal. Chim. Acta1993,283, 803. 19. Thompson, M.; Wood, S. J. In Cantle, J.E. (Ed).
Atomic Absorption Spectrometry, 5, 1982, pp. 261-284.
20. Ishiwatari, R. In Aiken G. R. (Ed). Humic Substances in Soil, Sediment and Water, John Wiley, New York, 1985, pp. 147-180.
21. Meyer, P. E.; Ishiwatari, R. Org. Geochem. 1993,
20, 867.
22. Perminova, I. V.; Frimmel, F. H.; Kovalevskii, D. V.; Abbt-Braun, G.; Kudryavtsev, A. V.; Hesse, S. Water Res.1998, 32, 872.
23. Leenheer, J. A.; Wershaw, R. L.; Reddy, M. M.
Environ. Sci. Technol.1995, 29, 399.
24. Leenheer, J. A.; Wershaw, R. L.; Reddy, M. M.
Environ. Sci. Technol. 1995, 29, 393.
25. Falzoni, A.; Seeber, R.; Tonelli, D.; Ciavatta, C.; Gessa, C.; Montecchio, M. Analusis1998, 26, 214. 26. Scatchard, G. Ann. N. Y. Acad. Sci.1949, 51, 660. 27. Ackerman, F.; Bergman, H.; Schlelechert, U. Environ.
Technol. Lett.1983, 4, 317.
Received: April 18, 2000 Published on the web: October 25, 2000
![Table 3 presents the values of conditional stability con- con-stant (log K) and complexing capacity (C c ) obtained accord-ing to Scatchard plots 3,6,9,26 , from the [ML]/[M 2+ ] versus [ML] shown in Figure 3, where [M 2+ ] represents the con-centration](https://thumb-eu.123doks.com/thumbv2/123dok_br/18989091.459970/5.892.110.840.1003.1098/presents-conditional-stability-complexing-capacity-scatchard-represents-centration.webp)