TiO
2Thin Film Growth Using the MOCVD Method
M.I.B. Bernardi*a, E.J.H. Leea, P.N. Lisboa-Filhoa, E.R. Leitea,
E. Longoa, J.A Varelab
aDepartamento de Química, Centro Multidisciplinar de Desenvolvimento de Materiais
Cerâmicos, Universidade Federal de São Carlos, C.P. 676, 13.565-905 São Carlos - SP, Brasil
bInstituto de Química, Centro Multidisciplinar de Desenvolvimento de Materiais Cerâmicos, Universidade Estadual Paulista, C.P. 355,
14884-970 Araraquara - SP, Brasil
Received: February 13, 2001; Revised: June 26, 2001
Titanium oxide (TiO2) thin films were obtained using the MOCVD method. In this report we discuss the properties of a film, produced using a ordinary deposition apparatus, as a function of the deposition time, with constant deposition temperature (90 °C), oxygen flow (7,0 L/min) and substrate temperature (400 °C). The films were characterized by X-ray diffraction (XRD), scanning electron microscopy (SEM), atomic force microscopy (AFM) and visible and ultra-violet region spectroscopy (UV-Vis). The films deposited on Si (100) substrates showed the anatase polycrystal-line phase, while the films grown on glass substrates showed no crystallinity. Film thickness increased with deposition time as expected, while the transmittance varied from 72 to 91% and the refractive index remained close to 2.6.
Keywords:thin films, TiO2, MOCVD
1. Introduction
Many theoretical and experimental investigations have been carried out on the electronic transport properties of semi-conducting oxides in thin films in the past few years. Titanium dioxide (TiO2) possesses a number of
attrac-tive properties, among which are its high refracattrac-tiveness, high dielectric constant, semiconductor properties and chemical stability. Compact TiO2thin films deposited on
conducting glass are used in new types of solar cells: liquid and solid dye-sensitized photoelectrochemical solar cells1,2, as well as in solar cells with extremely thin organic or inorganic absorbers3,4. These thin films are also of inter-est for application in the photo-oxidation of water5, photo-catalysis6, electrochromic devices7, among other uses.
There are three types of TiO2 crystalline structures:
anatase, rutile, and brookite. Rutile presents the highest refractive index and is the most thermodynamically stable structure. The anatase structure is obtained at low tempera-tures of around 350 °C, which is useful for industrial applications8. At temperatures between 400 and 800 °C, the rutile phase is also present while, at higher temperatures, only the rutile structure is present. Another possible phase
present in the TiO2compounds are the brookite phase, but
just present at high pressures and high temperatures. Thin films have been prepared by many deposition techniques such as the Sol-Gel based process9, metal-or-ganic chemical vapor deposition (MOCVD)10,11, atomic layer deposition12, molecular beam epitaxy (MBE)13, pulsed laser deposition14and various reactive sputtering techniques15-17. These deposition techniques control nu-cleation rates and, therefore, all the chemical and physical properties.
The method known as Metal-Organic Chemical Vapor Deposition (MOCVD) consists of heating an organometal-lic solution, which evaporates and is deposited on a heated substrate. The films grown by this method, which generally requires expensive, sophisticated apparatus, are usually homogeneous, which is a crucial attribute for the study of optical properties.
In this article, we report the synthesis procedures to grow TiO2thin films using a simple, low-cost deposition
apparatus especially built in our laboratory. The films were characterized by X-ray diffraction (XRD), scanning elec-tron microscopy (SEM), atomic force microscopy (AFM) and visible and ultra-violet region spectroscopy (UV-Vis).
*e-mail: [email protected] or [email protected]
The envelope method18, which includes the considera-tion of loss of light intensity from the back surface of the substrate, has been shown to be a simple and convenient tool to calculate the optical properties of the film, using solely the transmission spectra in the regions of medium and weak absorption.
2. Experimental
TiO2 thin films were deposited on Si(100) and glass
substrates using the metal-organic chemical vapor deposi-tion (MOCVD) system shown in Fig. 1. Titanium isopro-poxide, [Ti{OCH(CH3)2}4], which is liquid at room
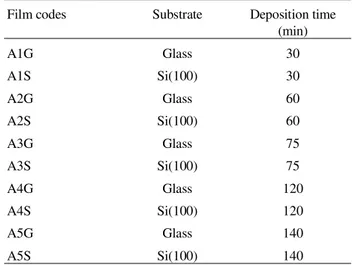
temperature (melting point 20 °C), was used as the or-ganometallic (OM) precursor. The titanium isopropoxide was stored in a glass bubbler whose temperature was con-trolled by a hot plate. The vapor of the OM precursor was transported by high purity oxygen gas to the reactor. Pure oxygen was used as oxidant. Single-layer films were grown using either Si(100) or glass substrates and different depo-sition times while the other parameters remained fixed. Table 1 summarizes the deposition conditions.
Each pair of thin film samples: (A1G, A1S), (A2G, A2S) was obtained from the same deposition run (same conditions) but using different substrates; G stands for (glass) and S for [silicon(100)], as shown in Table 2.
The structural properties of the deposited films were studied by X-ray diffraction (XRD), and the measurements were carried out with a Siemens D5000 diffractometer with Cu K radiation. The geometry of the diffractometer was the
same for all the samples studied (grazing incidence diffrac-tion - incidence angle = 2°, step time = 7 s, step scan = 0.007°, 2θ= 20-50°, U = 40 kV and I = 40 mA). Thickness of the TiO2thin films were determined analyzing
the cross section images by scanning electron microscopy (SEM) using a Zeiss DSM940A microscope. The surface morphology of the TiO2 thin films and roughness was
obtained by atomic force microscopy (AFM) (Digital In-struments Multi-Mode Nanoscope III A).
The transmittance of the films was measured in the visible region by means of a Cary 5G UV-Vis-Nir double-beam spectrophotometer. Based on these analyses, the op-tical transmission behavior as a function of the wavelength was assessed by direct measurement. The transmittance spectra were analyzed using the modified envelope method, which allows for the optical coefficients, such as refraction index and absorption coefficient, to be determined.
3. Results and Discussion
3.1. Film structure and morphology
It is well known that the temperature and partial oxygen pressure are the most important parameters in the optimi-zation of the crystal structure of TiO2thin films deposited
by MOCVD19.
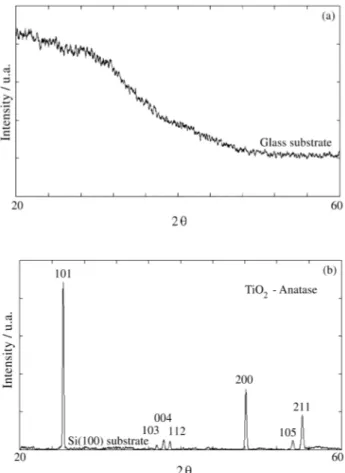
In order to obtain crystalline structures (anatase), the temperature of the substrate was fixed at 400 °C during deposition. Figure 2 shows the XRD data for films grown on Si (100) and glass substrate. As can be seen from the XDR diffraction patterns, the structures were different, illustrating the influence of the substrate in each case. This figure also shows that the films deposited on Si(100) pre-sented a polycrystalline structure with the anatase phase. Otherwise, the films grown on glass presented no crystal-line structure, preserving their amorphous character.
Concluding, the structure of the films was influenced by the nature of the substrate. This may be attributed to the
Figure 1.A schematic presentation of MOCVD apparatus.
Table 1.Summary of deposition parameters.
Substrate materials Si(100) and glass
Growth temperature 400 °C
Reactor pressure 0.5 Torr
OM source Ti{OCH(CH3)2}4
OM source temperature 90 °C
OM source carrier gas (O2) flow rate 7 sccma
asccm: standard cubic centimeter per minute.
Table 2.Growth conditions.
Film codes Substrate Deposition time
(min)
A1G Glass 30
A1S Si(100) 30
A2G Glass 60
A2S Si(100) 60
A3G Glass 75
A3S Si(100) 75
A4G Glass 120
A4S Si(100) 120
A5G Glass 140
fact that the mobility of the atoms on the substrate surface, which is responsible for the degree and type of nucleation on the substrate. It is also well know that the crystalline substrate favors a better packing, leading to a minor density and consequently, a smaller thickness20.
Figure 3 presents a SEM micrograph obtained from the TiO2thin films under study. As can be observed, the films
deposited on the glass substrates were thicker than those grown on the Si (100) under the same conditions. It is also possible to observe that the thickness increases with the deposition time, result shown in Table 3. As expected by the interference color theory21, the films with different thicknesses presented different colors.
The films were visible to the naked eye once the color changes, being observed by reflection. TiO2layers on Si
(100) showed different colors (see Table 3). These colored films presented a good adhesion to the substrate. The ho-mogeneity of the layer was also visible owing to the inter-ference phenomenon, which has been reported on in the literature22. It was also possible to note from the data presented in Table 3 that the film roughness on glass substrates was always lower than those presented for the Si (100). This is a remarkable characteristic since the rough-ness the glass substrate (0.92 nm) is higher than the Si (100) one (0.20 nm).
Surface morphology and roughness were evaluated us-ing an atomic force microscope (AFM), as shown in Fig. 4. An analysis of these data permitted us to confirm that the films on glass presented an poorly-crystalline structure, since only amorphous pattern was detected in the XRD experiments. Otherwise, the Si (100) films showed well-de-fined grain formations, corroborating the XRD data.
Figure 2.a) X-ray diffraction patterns of TiO2thin films deposited on
glass, b) X-ray diffraction patterns of TiO2thin films deposited on glass
on Si (100) substrates, under the same conditions.
Figure 3. SEM micrographs of the cross section of TiO2thin films
deposited on different substrates, under the same conditions: a) glass and b) Si(100).
Table 3.Physical characterization results performed in TiO2thin films.
Film codes Thickness (nm) Color of the films Roughness (nm) Transmission (%) Optical energy gap (eV)
A1G 100 3.6 91 3.7
A1S 50 Yellow 5.4
A2G 130 3.4 88 3.8
A2S 60 Light blue 4.8
A3G 170 2.2 87 3.7
A3S 80 Dark blue 3.1
A4G 210 1.3 80 3.7
A4S 100 Light green 2.5
A5G 230 0.9 79 3.6
The low roughness values also confirm the good homo-geneity of these films. Roughness was also found to de-crease with deposition time.
3.2. Optical properties
The transmittance of TiO2films on glass was measured
using air as a reference. We modified the structure of TiO2
thin films by two means: deposition on different substrates and different deposition times.
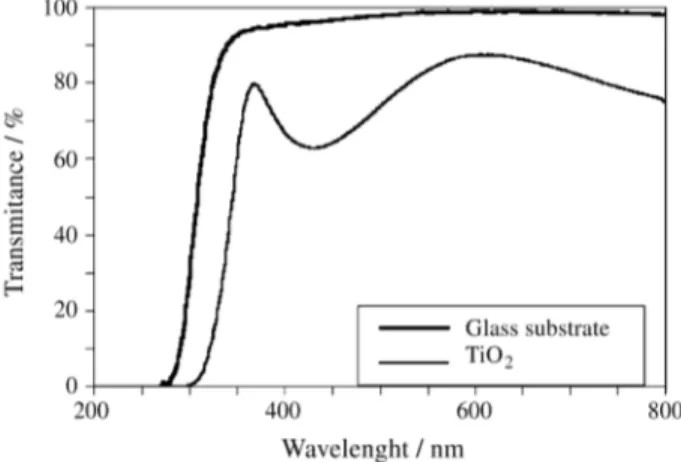
Figure 5 shows a high TiO2transmittance spectrum for
a film grown on glass. The film is totally transparent, allowing the use of the modified envelope method to obtain its refraction index. A refractive index value of 2.6 was obtained at a wavelength of 638.2 nm, corresponding to the
Figure 4.AFM surface morphology of TiO2thin films deposited on different substrates, under the same conditions: a) glass (amorphous) and b) Si(100) (crystalline).
Figure 5.Utraviolet-visible transmission spectra for a TiO2thin film
He-Ne laser. The structural differences explain why TiO2
amorphous films exhibit lower refractive indexes than crys-talline TiO2films (nm= 2.55).
The spectral values were processed in order to obtain the energy band gap, using Eq. (1), which corresponds to indirect gap for semiconductors.
α(hν) = A (hν- Eg)2 (1)
whereαstands for absorbance, h is Planck’s constant,νthe frequency, Eg the optical band gap energy and A is a dimensional constant.
Although the films show a high specular reflectivity, this can be disregarded when compared to the absorbance in the high absorption region since, in this region, the absorbance is directly proportional to the absorption coef-ficient. The gap energy values obtained are shown in Ta-ble 3.
4. Conclusions
Good quality (homogeneous, adherent, specular and fairly smooth) TiO2thin films were obtained using a
simple, homemade device and the MOCVD method. The nature of the substrate showed a strong dependence on the structural properties of the films, whose optical prop-erties it thus altered. The final thickness of the films increased with longer deposition times; however, this increase was more strongly evident on the glass than on the Si(100) substrate. At 400 °C, crystalline films were deposited on Si (100), whereas amorphous films were deposited on glass. The films with different thicknesses presented different colors.
Acknowledgments
The authors gratefully acknowledge the financial sup-port of the Brazilian financing agencies Fundação de Am-paro à Pesquisa do Estado de São Paulo (FAPESP), Conselho Nacional de Desenvolvimento Científico e Tec-nológico (CNPq), Grupo de Pesquisa de Excelência (PRONEX) and Coordenação de Aperfeiçoamento de Pes-soal de Nível Superior (CAPES).
References
1. O’Regan, B.; Grätzel, M.Nature, v. 353, p. 737-739, 1991.
2. Bach, U.; Lupo, D.; Comte, P.; Moser, J.E.; Weissörtel, F.; Salbeck, J.; Spreitzer, H.; Grätzel, M.
Nature, v. 395, p. 583-585, 1998.
3. Tennakone, K.; Kumara, G.R.R.A.; Kumarasinghe, A.R.; Wijayantha, K.G.U.; Sirimane, P.M.Semicond, Sci. Technol., v. 10, p. 1689-1692, 1995.
4. Siebentritt, S.; Ernst, K.; Fischer, C.-H.; Kom-nenkamp, R.; Lux-Steiner, M.C. In: Ossenbrink, H.A.; Helm, P.; Elmann H., eds.,Proc. 14thEur. Photovol-taic Sol. Energy Conf. Exhibit., Barcelona, H.S. Stephens & Associates, Belford, UK, p. 1823-1827, 1997.
5. Kavan L.; Grätzel, M. Electrochim. Acta, v. 40, p. 643-652, 1995.
6. Pozzo, R.L.; Baltanas, M.A.; Cassano, A.E.Catalysis Today,v. 39, p. 219-331, 1997.
7. Kang, T.-S.; Kim, D.; Kim, K.-J.J. Electrochem Soc.,
v. 145, p. 1982-1986, 1998.
8. Mergel, D.; Buschendorf, D.; Eggert, S.; Grammes R.; Samset, B.Thin Solid Films, v. 371, p. 218-244, 2000. 9. Sabate, J.; Anderson, M.A.; Kikkawa, H.; Xu, Q.; Cervera-March, S.; Hill Jr., C.G. J. Catal.,v. 134, p. 36-40, 1992.
10. Kim, H.S.; Gilmer, D.C.; Campbell S.A.; Polla, D.L.
Appl. Phys. Lett.,v. 69, p. 3860-3862, 1996.
11. Chang, H.L.M.; Zhang, T.J.; Zhang, H.; Guo, J.; Kim H. K.; Lam, D. J.J. Mater. Res.,v. 8, p. 2634-2643, 1993.
12. Aarik, J.; Aidla, A.; Kiisler, A.-A.; Uustare, T.; Sam-melselg, V.Thin Solid Films,v. 305, p. 270-273, 1997. 13. Gao, Y.; Liang, Y.; Chambers, S.A.Surf. Sci., v. 365,
p. 638-648, 1996.
14. Yoon, H.S.; Kim, S.K.; Im, H.S.Bull. Korean Chem. Soc.,v. 18, p. 641-645, 1997.
15. Guerin, D.; Ismat Shah, S.J. Vac. Sci. Technol. A, v. 15, p. 712-715, 1997.
16. Bem Amor, S.; Baud, G.; Besse, J.P.; Jacquet, M.Thin Solid Films,v. 293, p.163-169, 1997.
17. Okimura, K.; Shibata, A.; Maeda, N.; Tachibana, K.; Noguchi, Y.; Tsuchida, K.Jpn. J. Appl. Phys.,v. 34, p. 4950-4955, 1995.
18. Peng, C.H.; Desu, S.B.J. Am. Ceram. Soc., v. 77, p. 929-938, 1994.
19. Vetrone, J.; Chung, Y-W.J. Vac. Sci. Technol. A, v. 9, n. 6, p. 3041-3047,1991
20. Givargilov, E.I. Oriented Crystallization on Amor-phous Substrates, Editor Plenum Press, New York, N.Y., p. 370, 1991.
21. Javan, A.The Optical Properties of Materials, Scien-tific American, p. 239,1967.
22. Vigil, E.; Saadoun, L.; Ayllón, J.A.; Domènech, X.; Zumeta, I.; Rodríguez-Clemente, R.Thin Solid Films,
v. 365, p. 12-18, 2000.