Activation Energy Measurement of Oxygen Ordering in a
Nb-Ti Alloy by Anelastic Relaxation
T.C. Niemeyera,b, J.M.A. Gimenezb, L.H. Almeidab, C.R. Grandinib*, O. Florêncioc a
Instituto de Física de São Carlos, Universidade de São Paulo, 13560-970 São Carlos - SP, Brazil b
Departamento de Física, Universidade Estadual Paulista, 17033-360 Bauru - SP, Brazil c
Departamento de Física, Universidade Federal de São Carlos, 13565-905 São Carlos - SP, Brazil
Received: November 13, 2000; Revised: February 25, 2002
Metals with bcc structure are able to dissolve large amounts of interstitial element atoms in the form of oxygen. These atoms diffuse through the lattice by jumping into octahedral sites with equivalent symmetry, causing strong alterations in the anelastic behavior. This paper reports on a study of Snoek relaxation in Nb-Ti alloys with oxygen in solid solution, based on internal friction as a function of temperature. The internal friction measurements were taken in a torsion pendulum operating at temperatures in the range of 350 to 650 K, with frequencies varying from 6 to 36 Hz. The results show relaxation spectra in which thermally activated relaxation peaks produced by the stress-induced ordering of oxygen atoms around niobium atoms of the metallic matrix were iden-tified.
Keywords: anelasticity, internal friction, diffusion, niobium-titanium alloys
1. Introduction
Interest in the study of the interaction of interstitial sol-utes with metallic matrices began in the late 1930s with the work of Snoek1, who postulated that carbon atoms dissolved interstitially in an α-iron matrix produced anelastic behavior, interacting with the metallic matrix through a relaxation process well known as stress-induced ordering. Since then, several studies have focused on gaining a better understand-ing of the mechanisms of this interaction, most of them based on the measurement of internal friction as a function of tem-perature, better known today as anelastic spectroscopy.
In recent decades, internal friction measurements have been used as a rich source of information on solutes inter-stitially diffused in metals and metallic alloys, since they provide information regarding diffusion, interstitial concen-trations, solubility limits, precipitation phenomena, inter-action between interstitials and other imperfections in the crystalline lattice2-7.
Today, more than fifty years after the discovery of the “Snoek Peaks”, studies are still being made to clarify the relaxation mechanisms in pure metals8,9 and metallic alloys such as Nb-Ti10,11 and Nb-Zr12,13. Our main objective with this work is the systematic study of anelastic relaxations caused by stress-induced ordering of heavy interstitial
sol-utes present in metallic matrices of niobium-based alloys, such as Nb-Ti, using internal friction measurements based on the torsion pendulum technique.
This paper discusses a Snoek relaxation study of Nb-Ti alloy samples, with oxygen dissolved in solid solution, us-ing internal friction measurements as a function of tempera-ture.
2. Experimental Part
The samples in question are polycrystals of a Nb-Ti al-loy having 0.3% in weight of Ti (Nb - 0.3% Ti), produced by the Materials Engineering Department, Lorena Faculty of Chemical Engineering (FAENQUIL), by mechanical mixing of Nb and TiO2 powders followed by cold isostatic pressing and high vacuum sintering10. The samples are cyl-inder-shaped, with a 1.3 mm diameter for 45 mm of useful length. Table 1 gives the chemical composition of the sam-ple used in this study.
Internal friction and oscillation frequency measurements were taken using an inverted torsion pendulum of the Kê type14, operating in the temperature range of 100 to 700 K and an oscillation frequency of 6.0 to 36.0 Hz. The meas-urements were taken in a vacuum close to 10-4 mBar, with a heating rate of approximately 1.0 K/min. The maximum
*e-mail: betog@fc.unesp.br
the case of the torsion pendulum, the dissipation of en-ergy per cycle is measured through the logarithmic dec-rement of the amplitude of the free oscillations of the pendulum15, which is written as:
N o
A A N Q−1= 1 ln
(1)
where N is the number of oscillations during which the amplitude decreases from Ao to AN.
An anelastic relaxation process gives rise to a peak in the internal friction spectrum as a function of the tempera-ture and a step in the Elasticity Modulus. The height of the internal friction peak and the amplitude of the step in the modulus are correlated with the concentration of the bodies undergoing relaxation while the peak’s position is deter-mined by the bodies’ mobility.
Oscillation amplitude damping data were collected au-tomatically, using a laser beam reflected by a mirror placed on the axis of the pendulum and incident on two photodiodes connected to a microcomputer16.
3. Results and Discussion
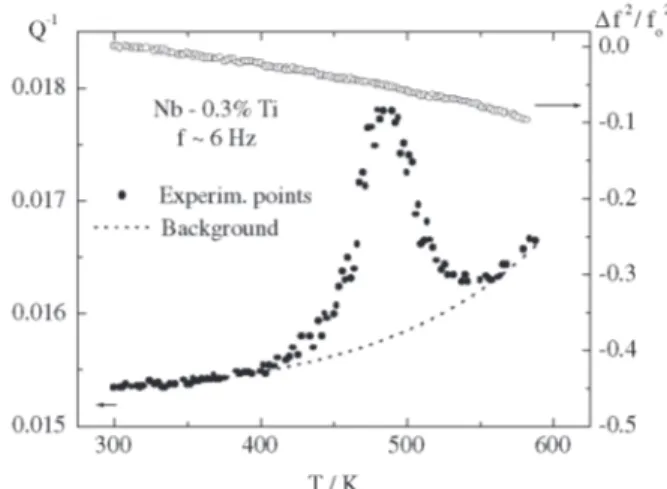
Figure 1 illustrates the internal friction and relative fre-quency variation (elasticity modulus) as a function of tem-perature for a sample of the Nb-0.3 wt % Ti alloy with 0.04 wt % of oxygen in solid solution, measured with a frequency of 6 Hz. The figure clearly shows the presence of a relaxa-tion peak around 475 K.
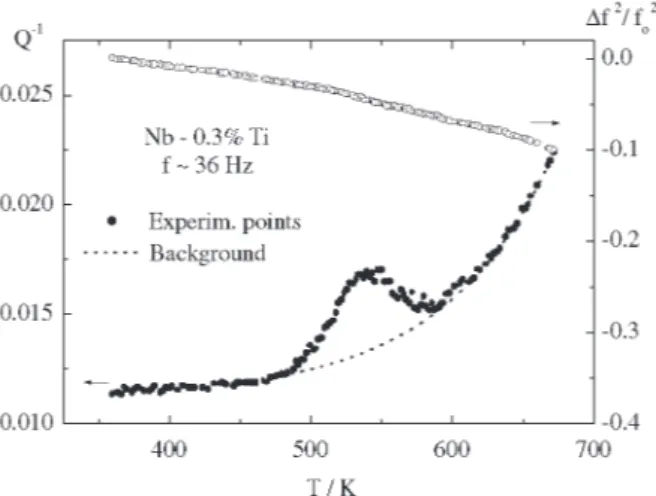
The same phenomena are observed in Figs. 2 to 4, which show the internal friction and relative variation of frequency as a function of temperature for the same sample, now meas-ured at frequencies of 12, 14 and 36 Hz, respectively.
A possible explanation for this relaxation peak is the stress-induced ordering of oxygen atoms located intersti-tially in octahedral sites of the lattice around niobium at-oms of the metallic matrix.
The first indication underpinning the validity of this
as-Figure 1. Internal friction (●) and elasticity modulus ({) as a
func-tion of temperature for a Nb-0.3 wt % Ti sample with 0.04 wt % of oxygen, measured at a frequency of 6 Hz. The dashed line indi-cates the background.
Figure 2. Internal friction (●) and elasticity modulus ({) as a
func-tion of temperature for a sample of Nb-0.3 wt % Ti with 0.04 wt % of oxygen, measured at a frequency of 12 Hz. The dashed line indicates the background.
Figure 3. Internal friction (●) and elasticity modulus ({) as a
In this case, the activation energy and the jump rate are:
E = ( 1.14 ± 0.09 ) eV τ
o-1 = ( 5.33 ± 0.02 ) x 1010 s-1
These results are in reasonable agreement with previ-ously published results2,5,8,10, reinforcing our initial suppo-sition.
For a definitive confirmation of this assumption, we will admit that the anelastic relaxation represented by the peak in the internal friction spectrum is governed by one relaxa-tion process, in which case the basic equarelaxa-tion for the inter-nal friction is given by15:
∆
2 1
-) ( + 1 = ) ( Q
ωτ ωτ
ωτ (5)
Figure 4. Internal friction (●) and elasticity modulus ({) as a
func-tion of temperature for a sample of Nb-0.3 wt % Ti with 0.04 wt % of oxygen, measured at a frequency of 36 Hz. The dashed line indicates the background.
Figure 5. Influence of the frequency on the relaxation process due to interstitial impurities in the Nb-0.3 wt % Ti sample.
Figure 6. Logarithm of the frequency as a function of the inverse of the peak temperature for the Nb-0.3 wt % Ti sample.
sumption is that the relaxation peak is thermally activated. Figure 5 shows the influence of frequency on internal fric-tion measurements as a funcfric-tion of temperature. As can be seen in the figure, a displacement of the relaxation struc-ture to a higher temperastruc-ture occurs with the increase in fre-quency, demonstrating that the process is thermally acti-vated. If the process is, in fact, thermally activated, then it satisfies Arrhenius’ equation15:
τ τ = o e xp ( E kT ) (2)
where E is the activation energy and τ
o is the jump rate of the relaxation process.
Thus, the internal friction and frequency measured in the neighborhood of the Snoek peaks constitute a useful tool to obtain the activation energy and jump rate of the relaxation process based on Arrhenius’ Law. The basic con-dition for the occurrence of a relaxation peak is:
ω τ = 1 (3)
where τ is the relaxation time of the process, ω = 2πf is
the angular frequency and f is the oscillation frequency of the pendulum.
Hence: ln f = - ln 2πτ
o – E / kTp (4)
where Tp is the peak temperature.
By plotting a graph of the frequency logarithm as a func-tion of the inverse of the temperature one can obtain the activation energy and the relaxation time of the process. Fig. 6 contains such a graph.
can be obtained through a combination of equations (5) and (6) and Arrhenius’ Law (2)15, as follows:
] ) T 1 -T
1 ( k E [ sech T
T 2Q Q
p p
-1 p -1=
(7)
The relaxation parameters for the Nb-O process obtained by this procedure are given in Table 2.
The figures show a good congruence between the ex-perimental points and the theoretical curve in the region of the peak, confirming our initial supposition that the relaxa-tion process studied here derives from the stress-induced ordering of oxygen atoms around niobium atoms in the metallic matrix (Nb-O process).
A critical analysis of Table 2 leads one to conclude that the results obtained in this study are in good agreement with those presented in the literature and that the relaxation proc-ess in question really originates from the strproc-ess-induced or-dering of oxygen atoms around niobium atoms in the metal-lic matrix. The low concentrations of oxygen and titanium are still insufficient for a proper visualization of the relaxa-tion process produced by the stress-induced ordering of oxy-gen atoms around titanium atoms in the metallic matrix.
The intensity of the constituent Debye peaks allowed for the oxygen concentration in the sample to be estimated at 0.03%, based on the Elastic Dipole Theory developed by Nowick15 and on the work of Povolo and Lambri18.
4. Conclusions
Based on measurements of internal friction as a func-tion of temperature, we analyzed samples of Nb-0.3 wt % Ti with oxygen in solution solid dissolved interstitially in the metallic matrix.
The resulting spectra showed the presence of relaxation structures associated to the relaxation process, caused by stress-induced ordering of oxygen atoms around niobium
Figure 7. Internal friction as a function of temperature for a sam-ple of Nb-0.3 wt % Ti with 0.04 wt % of oxygen, measured at a frequency of 6 Hz, analyzed as a Debye peak.
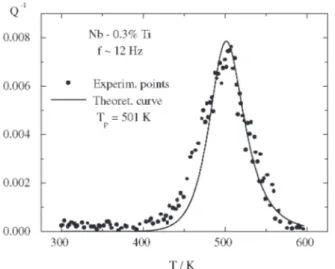
Figure 8. Internal friction as a function of temperature for a sam-ple of Nb-0.3 wt % Ti with 0.04 wt % of oxygen, measured at a frequency of 12 Hz, analyzed as a Debye peak.
Table 2. Relaxation parameters for the Nb-O process.
Frequency Temperature Activation Ref.
(Hz) (K) Energy (eV)
1.14 This work (Fig.6)
6 485 1.15 This work (Fig. 7)
12 501 1.15 This work (Fig. 8)
14 503 1.15 This work (Fig.9)
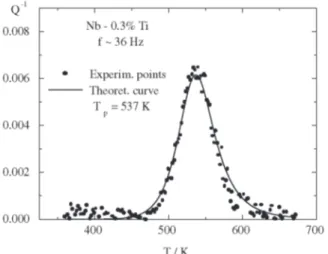
36 537 1.15 This work (Fig.10)
1.0 425 1.15 [2]
2.9 440 1.15 [6]
1.3 430 1.15 [10]
1.0 430 1.15 [11]
Figure 10. Internal friction as a function of temperature for a sam-ple of Nb-0.3 wt % Ti with 0.04 wt % of oxygen, measured at a frequency of 36 Hz, analyzed as a Debye peak.
Figure 9. Internal friction as a function of temperature for a sam-ple of Nb-0.3 wt % Ti with 0.04 wt % of oxygen, measured at a frequency of 14 Hz, analyzed as a Debye peak.
atoms (Nb-O process).
Through a method of computational analysis of the peaks, called the Successive Subtractions Method, a value of 1.15 eV was found for the activation energy of the ther-mally activated jumps (diffusion) of oxygen atoms around niobium atoms in the metallic matrix. This value was very close to those reported in the literature, confirming the use-fulness of the torsion pendulum technique in studies on mechanical relaxations in materials.
The oxygen concentration in solid solution, which was found to be 0.03 in %, was estimated based on the height of
the Debye peaks.
Acknowledgements
The authors thank FAPESP (Fundação de Amparo à Pesquisa do Estado de São Paulo), CNPq (Conselho Nacional de Desenvolvimento Científico e Tecnológico) and FUNDUNESP (Fundação para o Desenvolvimento da UNESP) for their financial support of this work.
References
1. Snoek, J.L. Physica, v. 8, p. 711-733 , 1941.
2. Ahmad, M.S.; Szkopiak, Z.C. J. Phys. Chem. of Solids,
v. 31, p. 1799-1804, 1970.
3. Heulin B.C.R. Acad. Sc. Paris, v. 273, p. 349-354, 1972.
4. Indrawirawan H.; Brasche L.J.; Owen C.V.; Rehbein D.K.; Carlson O.N.; Peterson D.T.; Buck O.J. Phys. Chem. Solids, v. 48, p. 535-539, 1987.
5. Haneckzok G.; Weller M. J. Less-Common Metals, v. 159,
269-276, 1990.
6. Weller M.; Haneckzok G.; Diehl J. Phys. Stat. Sol. (b), v.
172, p. 145-159, 1992.
7. Haneckzok G.; Weller M.; Diehl J. Phys. Stat. Sol. (b), v.
172, p. 557-572, 1992.
8. Grandini C.R.; Botta F° W.J.; Florêncio O.; Tejima H.; and Jordão J.A.R. J. Alloys Comp., v. 211/212, p.
226-228, 1994.
9. Haneckzok G. Phil. Mag. A, v. 78, p. 845-855, 1998.
10. Grandini C.R., Ferreira L.E.C.; Sandim H.R.Z.; Florêncio O.; Tejima H.; Jordão J.A.R. J. Phys. IV, v. 6,
p. 135-138, 1996.
11. Florêncio O.; Botta Fo W.J.; Grandini C.R.; Tejima H.; Jordão J.A.R. J. Alloys Comp., v. 211/212, p. 37-40, 1994.
12. Botta F° W.J.; Florêncio O.; Grandini C.R.; Tejima H.; Jordão J.A.R. Acta Metall. Mater., v. 38, p. 391-396, 1990.
13. Ritchie G.; Pan Z.L. Phil. Mag. A, v. 63, p. 1105-1113,
1991.
14. Kê T.S. Phys. Rev., v. 71, p. 533-546, 1947.
15. Nowick A.S.; Berry B.S., Anelastic Relaxation in Crys-talline Solids, Academic Press, New York, USA, 1972.
16. Gimenez J.M.A.; Rezende R.; Niemeyer T.C.; China J.P.R.; Pintão C.A.F.; Grandini C.R.; Florêncio O.
Revista Brasileira de Aplicações de Vácuo, v. 19, p.
33-35, 2000.
17. Grandini C.R.; Scalvi R.M.F.; Oliveira A.R.G.; Florêncio O.; Tejima H.; Jordão J.A.R. Revista Brasileira de Física Aplicada e Instrumentação, v. 10, p. 133-138, 1995.
18. Povolo F.; Lambri O.A. J. Alloys Comp., v. 211/212, p.