www.atmos-chem-phys.net/9/4841/2009/ © Author(s) 2009. This work is distributed under the Creative Commons Attribution 3.0 License.
Chemistry
and Physics
Size-dependent activation of aerosols into cloud droplets at a
subarctic background site during the second Pallas Cloud
Experiment (2nd PaCE): method development and data evaluation
T. Anttila1, P. Vaattovaara2, M. Komppula3, A.-P. Hyv¨arinen1, H. Lihavainen1, V.-M. Kerminen1, and A. Laaksonen1,2
1Finnish Meteorological Institute, P.O. Box 503, 00101 Helsinki, Finland
2Department of Physics, University of Kuopio, P.O. Box 1672, 70211 Kuopio, Finland 3Finnish Meteorological Institute, Kuopio Unit, P.O. Box 1627, 70211 Kuopio, Finland
Received: 7 May 2009 – Published in Atmos. Chem. Phys. Discuss.: 30 July 2008 Revised: 5 June 2009 – Accepted: 12 July 2009 – Published: 22 July 2009
Abstract.In situ measurements of aerosol water uptake and activation of aerosols into cloud droplets provide informa-tion on how aerosols influence the microphysical properties of clouds. Here we present a computational scheme that can be used in connection with such measurements to assess the influence of the particle hygroscopicity and mixing state (in terms of the water uptake) on the cloud nucleating ability of particles. Additionally, it provides an estimate for the peak supersaturation of water vapour reached during the formation of the observed cloud(s). The method was applied in inter-preting results of a measurement campaign that focused on aerosol-cloud interactions taking place at a subarctic back-ground site located in Northern Finland (second Pallas Cloud Experiment, 2nd PaCE). A set of case studies was conducted, and the observed activation behavior could be successfully explained by a maximum supersaturation that varied between 0.18 and 0.26% depending on the case. In these cases, the di-ameter corresponding to the activated fraction of 50% was in the range of 110–140 nm, and the particles were only moder-ately water soluble with hygroscopic growth factors varying between 1.1 and 1.4. The conducted analysis showed that the activated fractions and the total number of particles acting as CCN are expected to be highly sensitive to the particle hy-groscopic growth properties. For example, the latter quantity varied over a factor between 1.8 and 3.1, depending on the case, when the mean hygroscopic growth factors were varied by 10%. Another important conclusion is that size-dependent activation profiles carries information on the mixing state of particles.
Correspondence to:T. Anttila ([email protected])
1 Introduction
Largest uncertainties in the current predictions regarding the climate change arise from the influence of aerosols on the microphysical properties of clouds (IPCC, 2007). This un-derscores the need to improve our knowledge on the connec-tions between the atmospheric aerosols and clouds (Ghan and Schwartz, 2007; Lohmann et al., 2007). To address this issue, several advances in theoretical understanding of the cloud formation have been made during the recent years, and many of the results have been incorporated into large-scale climate models as computationally efficient parameterizations (Chen and Penner, 2005; McFiggans et al., 2006 and references therein). However, further experimental studies involving in-situ measurements of aerosols and their activation into cloud droplets are still warranted to refine microphysical models as well as the resulting parameterizations (Ghan and Schwartz, 2007).
Size-resolved measurements on the cloud scavenging of ambient particles can be complemented by determining the particle water uptake properties by using e.g. a Hygroscopic Tandem Differential Mobility Analyzer (H-TDMA) that is used to measure the hygroscopic growth of particles as a function of time and particle size (McMurry, 2000). H-TDMA measurements allow for investigating the influence of the particle water-solubility and they provide also infor-mation on the particle mixing state in terms of the water up-take. Such information is valuable because the particle hy-groscopicity and mixing state are expected to play a large role in the cloud nucleating ability of atmospheric particles (McFiggans et al., 2006). Furthermore, on the basis of acti-vation and H-TDMA measurements the fraction of particles capable of acting as CCN can be determined as a function of the water vapour supersaturation by applying K¨ohler the-ory. A comparison of the predicted size-dependent activa-tion curves with the measurement results has been shown to give insight into the peak supersaturation reached during the cloud formation, on the adiabacity of the sampled cloud air and also on the possible presence of organic films on the par-ticles (Svennigsson et al., 1994, 1997; Mertes et al., 2005).
Several computational tools have been developed to aid interpretation of the experimental data on the water uptake properties of particles with varying physico-chemical prop-erties (e.g. Rissler et al., 2004; Kreidenweis et al., 2005; Gasparini et al., 2006; Padr´o et al., 2007; Petters and Krei-denweis, 2007; Ziese et al., 2008). These frameworks have been motivated by CCN measurements where particles are exposed to a known water vapour supersaturation and are of-ten used to interpret laboratory experiments where the par-ticle chemical composition is more constrained compared to variability exhibited by atmospheric particles. On the other hand, parameterizations of cloud droplet formation during an ascent of a convective air parcel require the updraft veloc-ity of the air parcel as an input (Abdul-Razzak and Ghan, 2000; Cohard et al., 2000; Nenes and Seinfeld, 2003; Ming et al., 2006), a quantity which is difficulty to determine in ground based studies (Verheggen et al., 2007). To the best of our knowledge, no comprehensive computational scheme that would be applicable to studies on activation of ambient particles using the above described experimental setup is pre-sented in the literature.
The current study addresses the above-mentioned gaps in the literature by developing and applying a method that is suitable for analyzing size-resolved data on atmospheric aerosols, their activation characteristics and hygroscopic properties. To be more explicit, our goals are to: 1) present a simple computational procedure which allows for calculating the activated fractions of particles based on the K¨ohler the-ory and information on the particle hygroscopicity, 2) derive expressions for estimating the maximum supersaturation of water vapour and for calculating CCN spectra, and 3) apply the developed framework to interpreting results of a measure-ment campaign that focused on aerosol-cloud interactions
taking place at a subarctic background site (Komppula et al., 2006).
The paper is organized as follows. In Sect. 2, the compu-tational procedure is derived and some additional issues that arise when applying the method are discussed. The relevant measurements carried out during the measurement campaign are briefly described in Sect. 3. The results of the data anal-ysis are given in Sect. 4, and the summary and conclusions follow in Sect. 5.
2 Model approach
2.1 General formulation
We consider a situation where there are size-segregated mea-surements for the particle number concentration and for the activated fraction of particles,CNtot,1,CNtot,2, . . . , CNtot,N
andAF1, AF2, . . . , AFN, respectively. The corresponding
particle dry diameters are denoted bydp,1, dp,2, . . . ,dp,N..
To start with, we assume that no entrainment took place dur-ing the measurements. We also assume that the hygroscopic properties of particles have been measured for a number of particle sizes. If the diameters at which the measurements were conducted do not overlap with the diametersdp,1, dp,2 ,. . . , dp,N., the measured hygroscopic properties need to be
extra- or interpolated to these diameters (see Sect. 4.2. for example). For the purposes of this study, it is convenient to characterize the hygroscopic properties by the normalized cumulative distributions of the hygroscopic growth (HG) fac-tors,GR1, GR2,. . . ,GRN. To be explicit,GRi(g)gives the
fraction of particles in the size bini that have a HG factor smaller thang. As seen later, the activated fraction of par-ticles can be treated also as a cumulative distribution, and this makes the use of cumulative HG distributions conve-nient. The distributionsGRi can be obtained through a
fit-ting procedure. It should be noted that the approach does not involve any assumptions regarding the shape of the humid-ified distributions, and thus it allows for considering a case where particles with the same dry size exhibit a variety of water uptake properties. The list of the key symbols used in this section is given in Appendix A.
K¨ohler theory states that those particles/droplets whose critical supersaturation, sc, is lower than the ambient
su-persaturation of water are activated, i.e. they grow sponta-neously through condensation of water vapour (Seinfeld and Pandis, 1998). The normalized cumulative distributions of the fraction of particles in a size classithat are activated at a supersaturations,Ki(s), can be formulated as follows:
Ki(s)=
CNi(sc<s)
CNtot,i
, (1)
whereCNi(sc<s) is the number of particles having a
particles in the size bin i, AF∗
i, and then present how the
maximum supersaturation reached during the formation of observed cloud(s) can be estimated by calculating activated fractionsAF∗
i in each size bini. Here we assume that those,
and only those, particles which have a critical supersatura-tion below a valuesmaxcontribute to the droplet population
of a cloud formed under the maximum supersaturationsmax.
Consequently,AF∗
i andKi are equal, i.e.AF∗i =Ki. This
as-sumption is not necessarily true due to the dynamic nature of the atmospheric cloud formation, however. The validity of the assumption will be discussed in Sect. 2.2.
Next we utilize information on the particle hygroscopic properties by expressing the distributionKi in terms ofGRi.
This is achieved by first relating GRi and the cumulative
distribution of the soluble volume fractions of particles in the size bini, SFi. According to the definition, SFi(v)is
the fraction of particles in the size bin i that contain less water-soluble volume thanv.In the next step, K¨ohler theory is used to relate the water-soluble volume fraction and the particle critical supersaturation. To this end, the water up-take of particles is modeled by assuming that the dry particle mass consists of two components: soluble and water-insoluble fractions, and that the former component exhibits similar hygroscopic behavior than ammonium sulfate at sub-saturated conditions. It should be noted that the following results are not sensitive to the choice of the model compound provided that its properties are used consistently in calcula-tions (Rissler et al., 2004). According to this scheme the soluble volume fraction of a particle,ε, is related to its HG factor,gf, as follows (e.g. Swietlicki et al., 1999):
ε= gf
3
−1
c(aw)
, c(aw)=gfAS3 (aw)−1. (2)
Hereaw is the water activity at which the particle
hygro-scopic growth was measured or estimated andgfAS(aw)is
the growth factor of ammonium sulfate particle at the water activityaw. Equation (2) allows for converting HG factors to
the corresponding soluble volume fractions. By doing this, the sought relation betweenGRi andSFi is obtained:
SFi(ε)=GRi[gfi(ε)],
gfi(ε) =(ciε+1)1/3,
ci =c(aw,i).
(3)
Hereaw,i is the water activity at which the hygroscopic
properties of particles in the size biniwere measured or esti-mated. Brackets are used in Eq. (3) to indicate that the argu-ment ofGRi is another function, gfi, which maps a soluble
volume fractionε to the corresponding HG factor. On the other hand, K¨ohler theory provides a link between the parti-cle water solubility, parameterized here withε, and the parti-cle critical supersaturation,sc(Seinfeld and Pandis, 1998):
sc≈kε−1/2dp−3/2,
k=23RT4 3/2Mw
ρw
Ms
νφρs
1/2
σ3/2. (4)
Heredpis the dry particle diameter,σ is the particle
sur-face tension,Ms,υφ, andρs are the molecular weight, the
“effective” number of ions into which a solute molecule dis-sociates (the van’t Hoff factor) and the density of ammonium sulfate, respectively. In addition, R is the ideal gas con-stant,T is the temperature, andMw andρw are the
molec-ular weight and density of water, respectively. According to the definitions ofSFi andKi,Ki can be expressed in terms
ofSFi as follows: Ki(s)= 1−SFi(ε∗) whereε∗ is the
parti-cle soluble fraction needed for activation of partiparti-cles hav-ing a dry diameter dp,i at a supersaturation s (the reader
is reminded that only particles having soluble volume frac-tionshigherthan a certain value are able to activate). Using Eq. (3), this relation can be further expressed as: Ki(s)=
1-GRi[gfi(ε∗)]. The relationship betweenε∗andsis, in turn,
obtained from Eq. (4). Using the equality ofAF∗
i andKi(see
above), the relation linkingAF∗
i andGRiis consequently the
following: AF∗
i (s)=Ki(s)=1−GRi[hi(s)] ,
hi(s) =
cik2dp,i−3s−2+1
1/3
. (5)
Brackets are used in (5) to indicate that the argument of
GRi is another function,hi, which maps a supersaturations
to the HG factor of a particle having a critical supersaturation sand a dry diameterdp,i. In deriving Eq. (5), it was assumed
thatσ andυφare independent of the particle size. However, if the particle water-soluble fraction contains surface-active molecules,σ depends on the solute concentration and hence also on the particle size (e.g. Adamson and Gast, 1997; Padr´o et al., 2007). Similarly the van’t Hoff factor may also ex-hibit sensitivity to the particle size. For the sake of brevity, detailed discussion on this topic is postponed to Sect. 2.2. Explicit expressions forGRi in cases where the humidified
particle distributions can be described with a Gaussian or log-normal distributions or a sum of them are presented in Appendix B.
The “effective” maximum supersaturation,smax, reached
during the formation of observed cloud(s) can be estimated using Eq. (5) by minimizing the difference between the cal-culations and observations with respect to a chosen norm. We use the term “effective” to highlight the underlying assump-tion according to which the observed air masses share the same supersaturation history whereas atmospheric observa-tions may represent an ensemble of different supersaturation histories. The assumption is necessary, however, given the experimental setup considered here. In the following, we es-timatesmaxusing the Euclidean norm and thus minimize the
following function:
G(s)=
v u u t
N
X
i=1
AF∗
i (s)−AFi
2
The resulting activated fractionsAF∗
i(smax)can be
com-pared with the measurements to evaluate the agreement be-tween the observations and calculations.
Equation (5) can also be used to calculate the CCN spec-trum:
CCNtot(s)=
N
X
i=1
AFi∗(s)CNtot,i. (7)
In particular,CCNtot(smax)can be compared with the
ob-servational number of activated particles to test the agree-ment between the measureagree-ments and calculations. Indepen-dent measurements of CCN spectrum, if available, can be used in a closure study (see Snider et al., 2003, for example) by calculatingCCNtot at the supersaturations used in CCN
measurements. Equation (7) can also be applied to inves-tigate the sensitivity of CCN concentrations to the particle hygroscopicity and/or mixing state by varying the values of the parameters which determine the distributionsGRi.
Fi-nally, Eqs. (5) and (7) serve as a parameterization of CCN spectra, and it can be used in computationally demanding aerosol and cloud models that utilize the sectional approach in describing the particle number size distribution. While the parameterization presented here is not as explicit as the pre-vious approaches (e.g. Khvorostyanov and Curry, 2006, and references therein), it does not set any restrictions regarding the treatment of aerosol mixing state or hygroscopicity. 2.2 Further considerations
2.2.1 Size dependent surface tension and Van’t Hoff fac-tor
Here we extend the above-presented method to a case where the surface tension and/or van’t Hoff factor exhibits depen-dence on the particle size that arises from the presence of the water-soluble component of aerosols. Presenting a detailed treatment that addresses these issues is beyond the scope of this study, and it suffices to note that several frameworks for calculating the van’t Hoff factor and surface tension exist (Shulman et al., 1996; Li et al., 1998; Nenes et al., 1998; Abdul-Razzak and Ghan, 2004; Sorjamaa et al., 2004). To maintain flexibility in this respect, we present an approxima-tive scheme that can be used in connection with any chosen thermodynamic model.
First we note that certain thermodynamic methods re-quire that the soluble fraction of particles is specified for each particle size class (e.g. Abdul-Razzak and Ghan, 2004). Since our approach is based on describing the particle water-solubility using continuous distributions (see Eq. 4), a repre-sentative value for the particle water-solubility is needed for each size class. An intuitive choice in this respect is the sol-uble fraction corresponding to the median growth factor, in particular when the humidified distributions are monomodal and relatively narrow (see Eq. 2). Once the model for cal-culating the surface tension and/or for the van’t Hoff factor
has been chosen along with the representative values of the needed parameters, the following scheme can be applied.
1. Calculate the particle critical diameter as well as the sur-face tensions and sursur-face excesses of the water-soluble com-ponent,σi andŴi, respectively, at the representative critical
supersaturation for each particle size class. If size depen-dent dissociation is accounted for, also the van’t Hoff factor is calculated separately for each size class.
2. Substitutekin Eq. (4) with the following expression:
ki =2fi−1/2
4
3RT
3/2M
w
ρw
Ms
νiφiρs
1/2
σi3/2. (8) Here fi is the fraction of water-soluble matter that
par-titions into the bulk solution contained by particles in the size classi, and it can be calculated using Ŵi (e.g.
Abdul-Razzak and Ghan, 2004). The parameter fi is introduced
because the surface/bulk partitioning of the surface-active solute influences the Raoult’s term in the K¨ohler equation and hence also the particle critical supersaturation (Sorjamaa et al., 2004). To account for this, we decrease the water-soluble volume fraction of particles by the amount of the water-soluble matter residing on the particle/droplet surface. If the surface/bulk partitioning is not taken into account,fi
is set to the unity. The obtained expressionski are then
sub-stituted forkin Eq. (5) and the subsequent calculations are carried out as previously.
2.2.2 Effects of entrainment and kinetic limitations
A potentially important issue neglected above is the entrain-ment of cloud-free air into the air parcel where measureentrain-ments were conducted (Noone et al., 1992; Mertes et al., 2005). There is no straightforward way to extend the method to ac-count for entrainment in a quantitative manner. In ground-based studies, however, possible errors caused by a dilution of the measured air masses can be avoided by checking that the activated fraction of particles approaches unity at a diam-eter range>300 nm. This is because entrainment leads to a dilution of cloud air and hence to a partial activation of larger particles (Noone et al., 1992).
Another assumption behind the approach is that all parti-cles having a critical supersaturation belowsmaxare
This is difficult when operating in ground based platforms, however (Verheggen et al., 2007). For these reasons, it is not feasible to include a treatment of the kinetic limitations into the scheme. Here we suffice to note that regarding clean continental and marine air masses that prevailed during the field campaign discussed in this study, errors in the predicted number of cloud droplets are expected to be 15% at maxi-mum (Nenes et al., 2001). This error range is comparable to the experimental errors in inferred fractions of activated particles (see Sect. 4).
3 Experimental methods
The second Pallas Cloud Experiment (2nd PaCE) took place at the Pallas Global Atmosphere Watch station in Northern Finland from 16 September 2005 to 6 October 2005 (loca-tion 67◦58′N, 24◦07′E, see Komppula et al., 2005 for de-tails). The station was inside the cloud cover for around one third of the campaign time and a wealth of data on the rela-tionships between aerosols and cloud droplets was gathered. An overview of the experiment and its main results has been described in Komppula et al. (2006) and therefore only mea-surements that are directly relevant to the current study are described below.
The particle size distributions were measured with a dual-inlet setup that allowed for determining the activated fraction of particles during cloud events. The first inlet sampled the total air which contained both residual and interstitial par-ticles, whereas the second inlet was equipped with a PM2.5
cyclone to measure only the interstitial particle population. Total air inlet has the same construction as used and designed by Weingartner et al. (1999). The inlet consists of heated in-let and a heated snow-hood. The inin-let design allows cloud droplets having a diameter<40µm to enter the sampling line. The heating dries all cloud droplets as soon as they enter the sampling system and both cloud residual and inter-stitial particles are measured. According to the calculations of Weingartner et al. (1999), the sampling efficiency of the total inlet system is well above 95% in the size range 10– 40µm which is relevant for aerosol/cloud interaction stud-ies. The fraction of activated particles was determined as a function of the particle size by comparing the particle con-centrations from these two inlets (Komppula et al., 2005). Similar Differential Mobility Particle Sizer (DMPS) systems were used at both inlets for particle sizing at the dry particle diameter range 7–500 nm, and similar Condensation Particle Counters (CPC, model TSI 3010) operated at both inlets. A log-normal fit with two modes, corresponding to the Aitken and accumulation modes, was performed to the particle size distributions, and the number of activated particles was in-ferred separately for these two modes.
Hygroscopic properties of both the dried interstitial aerosol population, sampled with the PM2.5 inlet, and the
total aerosol population, sampled with the total inlet, were
measured with an H-TDMA instrument (Joutsensaari et al., 2001). The humidifier was kept at about 90% relative hu-midity, and the relative humidity of the aerosol flow was kept about 2–3% lower than that of the sheath flow. The measure-ments errors are typically 1%-unit for the water vapor sat-uration ratio and 2% for growth factors (Joutsensaari et al., 2001). The measured dry diameters were 30, 50, 80, 100 and 150 nm. Hygroscopic growth of particles larger 150 nm in diameter was not measured due to technical problems asso-ciated with using larger voltages in the first DMA. A log-normal function was fitted to each humidified distribution and the performance of the fit was evaluated. The compar-ison showed that the chosen fit describes well the measure-ment data for the periods considered here.
The presence of clouds was verified from the relative hu-midity and visibility measurements (Vaisala FD12P weather sensor) as well as from photographs of the site taken auto-matically every 30 minutes for daytime periods. Moreover, the air mass history was evaluated by calculating the 5-day back trajectories for every three hours, or for every hour for cloud events lasting less than three hours, using the HYS-PLIT model (Draxler and Rolph, 2003). The data were clas-sified here according to the air mass history into three cate-gories: continentally-influenced European (“EUR”), marine (“MARINE”) and “mixed” air masses that have spent con-siderable amount of time both over sea and land (“MIX”). In order to be classified as a continental or marine case, the trajectory path had to have a clear history over the continent or the sea, respectively. If any indication of mixing of these two sources was observed, the trajectory was classified as a mixed case. This was done to differentiate continental and marine cases so that that the results would not be biased by mixing of the two source types. Example trajectories for each air mass type are shown in Fig. 1. As the figure il-lustrates, marine air masses originate typically from west or north while European air masses originate from south or east.
4 Data analysis
The measurement site was inside cloud for approximately 100 h during the experiment. The general features of the re-sults are presented by Komppula et al. (2006). Four cloud events were chosen for a detailed case study using the ap-proach described in Sect. 2. The aim of the case studies was to estimate the maximum supersaturation reached during the formation of observed cloud(s) and to provide more informa-tion on the role played by the mixing state and hygroscopicity in the cloud nucleating ability of atmospheric particles. 4.1 Selected cases
Fig. 1.Example trajectories for marine (left), continental (middle) and mixed (right) air masses Location of the measurement site is indicated using a star.
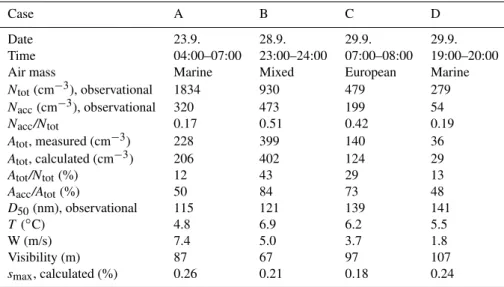
Table 1.General features of the analyzed cloud events. HereNtotandNaccdenote the total and accumulation mode particle concentrations,
respectively,AtotandAaccdenote the total number of activated particles and the number of activated accumulation mode particles,
respec-tively, andD50is the diameter corresponding to the 50% activation efficiency. Shown are also ambient temperature (T), wind speed (W),
and the estimated peak supersaturation (smax).
Case A B C D
Date 23.9. 28.9. 29.9. 29.9. Time 04:00–07:00 23:00–24:00 07:00–08:00 19:00–20:00 Air mass Marine Mixed European Marine
Ntot(cm−3), observational 1834 930 479 279 Nacc(cm−3), observational 320 473 199 54
Nacc/Ntot 0.17 0.51 0.42 0.19
Atot, measured (cm−3) 228 399 140 36 Atot, calculated (cm−3) 206 402 124 29
Atot/Ntot(%) 12 43 29 13
Aacc/Atot(%) 50 84 73 48
D50(nm), observational 115 121 139 141
T (◦C) 4.8 6.9 6.2 5.5
W (m/s) 7.4 5.0 3.7 1.8
Visibility (m) 87 67 97 107
smax, calculated (%) 0.26 0.21 0.18 0.24
place during the period and 2) the fraction of activated parti-cles was>90% at the diameter range>400 nm. The former criterion was applied because raindrops scavenge interstitial particles and may thus bias the measurements (Komppula et al., 2005). The latter criterion was applied because smaller activated fractions might be caused by entrainment (Noone et al., 1992; Hallberg et al., 1998; Mertes et al., 2005). An-other factor that could explain a partial activation of large particles is the presence of insoluble black carbon or dust particles (Hallberg et al., 1998). This cannot be verified, however, since the hygroscopic measurements covered only dry diameters up to 150 nm and thus associated uncertainties are avoided by applying the criterion. After the screening, four cases were selected from the remaining data set so that they cover the range of ambient conditions met during the experiment. Taken together, the cases represent different air masses, degrees of pollution as well as the scale of the ob-served aerosol and their activation characteristics. The total
and interstitial particle size distributions for the chosen cases are displayed by Fig. 2 and the general features of the cases are shown in Table 1. A particularly interesting feature of the results is that Aitken mode particles made non-negligible contribution to the number of activated particles; their frac-tional contribution ranged from 16 to 52% (Table 1). 4.2 Hygroscopic properties
Table 2.Hygroscopic growth factors of 50–150 nm particles for the four analyzed cloud cases.
Diameter
CASE 50 80 100 150
A 1.14 1.15 1.19 1.25 B 1.29 1.30 1.37 1.43 C 1.30 1.30 1.31 1.42 D 1.16 1.17 1.16 1.24
Fig. 2. The total and interstitial particle number size distribution (solid and dashed lines, respectively) for each analyzed cloud event. Please note the use of the logarithmic scales.
the humidified particle distributions exhibited only a single mode, whereas two distinct hygroscopic modes, termed typi-cally as less and more hygroscopic modes, are often observed in ambient measurements (e.g. Cocker et al., 2001; Ferron et al., 2005). As also seen from the table, the mean HG factors range from 1.11 to 1.43, corresponding to the soluble fraction range of 0.13–0.49, and they tend to increase with increasing particle size.
The comparison of the measurement data and the per-formed fits is shown in Fig. 3. The function used in the fitting is of the following formf (x)=axb, wherexis the mean HG
factor or the geometric standard deviation (GSD) of a humid-ified distribution, anda andbare the fitting parameters. As can be seen from Fig. 3, the performance of the fits was good and the extrapolated values are in a reasonable range. It is also worth noting that in all cases, particles are less hygro-scopic than pure ammonium sulfate particles which have a HG factor of∼1.77 at the water activity of 0.90 (Tang and Munkelwitz, 1997).
The sensivity of the results to extrapolating the measure-ment data to the diameter range>150 nm was assessed by re-peating the calculations with the mean HG factors and GSDs
Fig. 3. The mean hygroscopic growth factors and their geometric standard deviation (GSD) based on the observed distributions (open and solid symbols, respectively) and the corresponding fits (dashed and solid lines, respectively).
set equal to those for 150 nm particles at the particle size range>150 nm. As a result, the estimatedsmaxand predicted
number of activated particles change only up to 4 and 7%, re-spectively. Such a small sensitivity gives indication that the following results are not affected by the lack of measurement data for>150 nm particles.
One issue neglected so far is the fact that particles selected by the first DMA in an H-TDMA instrument do not have exactly the same size but consist of a width of sizes as de-termined by the transfer function of the instrument (Knutson and Whitby, 1975; Stolzenburg, 1988; Reischl, 1991). On the other hand, the considerations presented above assume that the only factor behind a spread in humidified particle distributions is heterogeneous chemical composition of par-ticles having the same size. In order to quantify the relation-ship between the “real” GSD that corresponds to the humid-ified distribution of particles having a certain sizedpand the
observational GSD, which may reflect the chemical compo-sition of particles with varying sizes, a series of calculations was performed as follows. First, we calculated the transfer functions characteristic to the DMA used in the experiments and fitted a log-normal function to the resulting particle size distributions. The values of GSDs of particle distributions passing through the first DMA, GSD1, were calculated to
be 1.025, 1.026 and 1.028 for particles having a diameter 50, 100 and 150 nm, respectively. In the next step, the parti-cle size distributions were treated as probability distributions and all size-selected particles passing through the first DMA were assumed to have the same chemical composition. Ac-cordingly, it is easy to show that the “real” distribution of HG factors of particles with a sizedpis Y= X−11X2where X1is
! " ! " # $ % %& % ' (
! % " % &" ' )
# $% %& % ' (
! % " % &" ' ) # $% %& % ' (
! % " % &" ' * )
# $% %& % ' ( ! % " % &" ' )
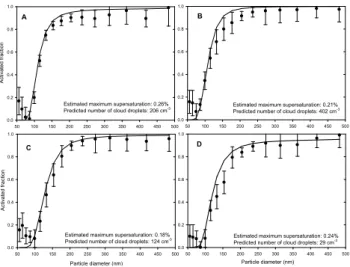
Fig. 4. The measured fractions of activated particles (symbols) and the predicted activated fractions (solid lines) for the considered cases. The error bars are based on the size-segregated concentration difference observed between the DMPSs measuring at different in-lets during the non-cloudy period prior and after the cloud event. Also shown are the estimated maximum supersaturations and pre-dicted number of cloud droplets for each case.
HG factors. We calculated the distribution Y using Monte Carlo methods for different values of GSD1, geometric
stan-dard deviation of the measured distribution, GSD2, and the
mean HG factor of the humidified distribution. The results show that errors in calculating the “real” GSD are below 0.01 (in absolute scale) when GSD1 <1.04 and GSD2>1.05 and
that they are insensitive to the mean HG factor. Moreover, the absolute errors in the “real” value of GSD reach a value of 0.014 when GSD1= 1.04 and GSD2= 1.05. Keeping in
mind that the values of GSD1 and GSD2 were consistently
below 1.03 and above 1.05, respectively, in our case, the re-sults show that the issue considered here can be neglected in the subsequent considerations.
4.3 Particle activation
The measured fractions of activated particles are shown in Figure 4 for each case. The activation profiles share similar features with those of previous ground-based particle activa-tion studies (Svenningsson et al., 1994, 1997; Martinsson et al., 1999; Mertes et al., 2005; Targino et al., 2007): the acti-vated fractions start increase rapidly with the particle size at the size range 50–80 nm, reach>80% at the diameter range 150–200 nm and exhibit only slight increase at the diameter range >200 nm. In the considered cases, D50, i.e. the
di-ameter at which particles activate with 50% efficiency, was estimated to lie in the range 112–141 nm, being lowest in the case A and highest in D. In comparison,D50 varied
be-tween 88 and 215 nm during the whole experiment. It can be seen that the activated fraction fluctuated somewhat at the diameter range<70–80 nm. This is attributed to low
parti-cle concentrations at the smallest size bins and to relatively rapid coagulational scavenging of ultrafine particles by cloud droplets (Komppula et al., 2005).
The peak supersaturations reached in the observed cloudy air masses, smax, were estimated as described in Sect. 2.1.
The values ofsmaxas well as the predicted fractions of
ac-tivated particles, calculated using Eqs. (5) and (B1), and the total number of activated particles, calculated with Eq. (7), are shown in Fig. 4 and in Table 1. The value ofsmax is
seen to vary between 0.18 and 0.26%, being smallest in the case C and largest in the case A. This range compares well with the values reported from previous ground based parti-cle activation studies (Sveningsson et al., 1994, 1997; Mar-tinsson et al., 1999; Mertes et al., 2005). Overall, the pre-dicted fractions of activated particles were within or close to the error bars, excluding the smallest sizes in which the activated fractions fluctuated slightly due to the reasons dis-cussed above. The predicted and observational number of particles incorporated into cloud droplets were within 9.6, 0.8, 15.7 and 17.1% in the cases A, B, C and D, respectively, which shows also good agreement (see Table 1). By com-paring the size-dependent trends in the particle activation it can be seen that the method can also explain the case-varying steepness of the increase in the activated fractions in the size range∼100–200 nm and the smaller, as compared to other cases, activated fractions of>200 nm particles in the case D. The latter feature results from the smallest HG factors ex-hibited by the particles in the case D (Table 2). However, the calculations tended to overpredict slightly the measured fractions of activated particles especially in the size range >150 nm. A possible reason is that the hygroscopic proper-ties of particles were not measured at this size range and thus the possible presence of hydrophobic particles, which may explain the overprediction, cannot be excluded. Addition-ally, there were only a small number of particles at the larger sizes which makes the results susceptible to fluctuations in the measured particle concentrations.
We note that the presented estimates ofsmaxapply only to
the measured air masses and may not be representative of the sampled cloud(s) as a whole. For example, in ground-based studies, the measurements system may be located so close to cloud base that higher supersaturations than the observations imply are reached higher in the cloud air.
4.4 Sensitivity studies
A set of sensitivity calculations was performed to investi-gate how the particle activation behavior would change as a response to changes in the particle water uptake properties under the assumption that the peak supersaturation of water vapour is not affected. The calculations were done by vary-ing the mean HG factors and/or GSDs while keepvary-ing the val-ues ofsmax, estimated as described in the previous section,
Table 3.The total number of activated particles in different sensi-tivity scenarios and cases.
Case
A B C D
Base case 224 402 118 29
Size averaged mean HGF 228 401 117 28 Size averaged GSD 233 403 118 30 Size averaged mean HGF & GSD 241 403 116 29
1.1×HGF 338 475 138 43 1.05×HGF 280 440 157 37 0.95×HGF 170 357 97 22 0.9×HGF 119 305 75 14
1.1×GSD 250 387 119 30 1.05×GSD 232 393 121 31 0.95×GSD 232 409 119 31
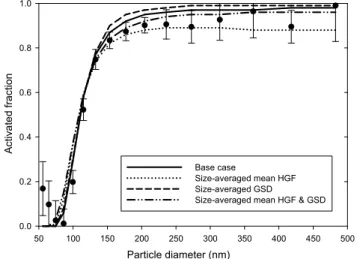
The first sensitivity study considered the importance of size-dependent variability in the particle hygroscopicity. This question has relevance, for example, to developing a simple and accurate parameterization of the cloud forma-tion that can be used in atmospheric models (Medina et al., 2007; Kivek¨as et al., 2008). Here we repeated the calcula-tions based on Eqs. (5) and (7) but by using the size-averaged value(s) of the 1) mean HG factors, 2) GSDs of the humid-ified distributions, and 3) both mean HG factors and GSDs. The results are illustrated for the case A in Fig. 5 and the changes in the predicted number of activated particles are shown in Table 3. As can be seen, only small changes in the size dependent particle activation or in the total number of activated particles were predicted to occur as a result of size averaging. The relative changes in the total number of ac-tivated particles remained<10% even for the case A which was most sensitive case in this regard. Regarding previous field studies, Medina et al. (2007) and Kuwata et al. (2008) conclude that accounting for the size-dependent chemical composition improves the closure between CCN measure-ments and K¨ohler calculations. In a similar study, Ervens et al. (2007) found that the accuracy of CCN predictions did not improve further upon introducing the available information on the size dependence of the chemical composition. Also Kivek¨as et al. (2008) successfully parameterized the observa-tional number of activated particles using a size-independent soluble mass fraction. Differing conclusions reached in these studies might be due to differing aerosol sources and proper-ties. To further elucidate the importance of size varying par-ticle chemical composition, future studies should explicitly address this issue through sensitivity studies.
The second sensitivity study focused on the impact of hy-groscopicity to the particle cloud-nucleating ability. The
cal-+
, ) - .
, )
-, ) - . /
! "
Fig. 5. The influence of size-averaging the particle hygroscopic properties on the particle activation for the case A. The measure-ments are displayed with symbols and the calculations are showed with lines as indicated in the legend.
+ 0
$ .
$ .
* $ .
* $ .
! "
Fig. 6. Sensitivity of the particle activation to the mean HG fac-tors for the case A. The sensitivity calculations were performed by multiplying the fit-based mean HG factors by a constant varying between 0.9 and 1.1 (shown in the legend).
+ 0 * $
$ $
! "
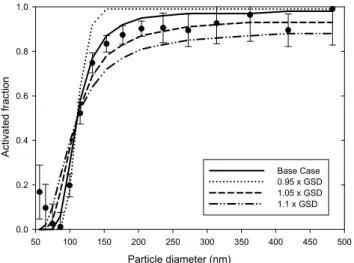
Fig. 7.Sensitivity of the particle activation to GSDs of the HG fac-tor distributions for the case A. The sensitivity calculations were performed by multiplying the fit-based mean HG factors by a con-stant varying between 0.95 and 1.1 (shown in the legend).
particle hygroscopicity: even 5% change in the mean HG factor resulted in clear deviations from the base case cal-culations. Overall, the largest changes are seen in the size range 100–200 nm, and the value ofD50is predicted to vary
between∼90 and 150 nm. As seen further from Table 3, large changes in the particle activation behavior were also predicted to occur in other cases. The calculated number con-centrations of activated particles varied up to a factor of 2.8, 1.6, 1.8 and 3.1 in the cases A, B, C and D, respectively. In addition, the cases D and B exhibited the largest and small-est sensitivity to the particle hygroscopicity, respectively, and these cases also featured the largest and smallest measured hygroscopic growth factors, respectively, among the consid-ered cases (Table 2). Taken together, these results suggest that the CCN ability of a particle population having relatively small or moderate HG factors, as the case was here, is highly sensitive to the particle hygroscopicity. In view of the results of the studies referred above, there is no unambiguous an-swer at the present to what extent hygroscopic properties in-fluence CCN ability of ambient particles – while some stud-ies support our conclusion (e.g. Hudson et al., 2007; Quinn et al., 2008) there are also contrasting evidence (e.g. Dusek et al., 2006; Ervens et al., 2007).
The third and last sensitivity study investigated the influ-ence of the particle mixing state on the particle activation, which is also a topic of active research (Broekhuizen et al., 2006; Rissmann et al., 2006; Ervens et al., 2007; Stroud et al., 2007). The influence of the mixing state was quantified by increasing the values of the fitted GSDs, shown in Fig. 2, by 5 or 10% as well as by decreasing them by 5%, and car-rying out the calculations as previously. Larger decreases are not considered here because they would lead to unrealisti-cally small GSD values. The rationale behind this approach
is that wider humidified distributions reflect more hetero-geneous chemical composition of particles whereas the op-posite holds for narrower distributions. The predicted size-dependent activation behavior is illustrated in Fig. 7 for case A and the number activated particles are shown in Table 3. Most notable feature displayed by Fig. 7 is that the hetero-geneity in the chemical composition is reflected in the steep-ness of the activation curves: when only a narrow range of critical supersaturations are present in each particle size, the activation curve resembles a step function whereas more gradual changes are seen when each particle size contains a spread of critical supersaturations. All curves are also seen to intersect at the point corresponding toD50since the shape
of the distribution of critical supersaturations does not play a role at 50% activation efficiency. Furthermore, Table 3 shows that the total number of activated particles is insensitive to the value of GSD. This is because the activated fractions of particles with sizes smaller and larger thanD50 respond in
an opposite manner to changes in GSD. To conclude with, non-negligible changes in size-dependent particle activation are predicted to take place in response to changes in the par-ticle mixing state, and thus the steepness of the “S”-shaped activation profiles may carry information on the particle mix-ing state, as suggested previously by Martinsson et al. (1999) and Mertes et al. (2005). Several recent CCN closure stud-ies have investigated how sensitive CCN predictions are to the aerosol mixing state but the conclusions differ; for ex-ample, Ervens et al. (2007) found that the mixing state is of second importance in predicting CCN concentrations while Stroud et al. (2007) and Broekhuizen et al. (2006) concluded that accounting for external mixing improves CCN closure. In addition, according to the cloud model calculations per-formed by O’Dowd et al. (2004), the aerosol mixing state is important for predicting particle activation in marine envi-ronment.
It is worth noting that smax was not adjusted to
chang-ing aerosol properties but was kept constant in all sensitivity scenarios. For example, if particles are more hygroscopic, they will deplete more water vapor during the cloud forma-tion and thereby increased particle hygroscopicity leads to smaller peak supersaturations and hence smaller number of activated particles. As discussed in Sect. 2.2.3, however, ac-counting for such “dampening” dynamical responses is be-yond the scope of the method and therefore the presented es-timates on the importance of the considered factors represent probably upper limit estimates.
5 Summary and conclusions
provides also a quantitative estimate of the peak supersatu-ration of water vapour reached during the formation of the observed cloud(s). No assumptions regarding the shape of the humidified particle distributions are required, but if par-ticle diameters for which activation and water uptake mea-surements were conducted are not the same, inter- or ex-trapolation of the measurement data is necessary. The equa-tions derived here also provide a flexible parameterization of CCN spectra that can be used in computationally demand-ing aerosol and cloud models. As a further application, the method can be used to compliment CCN closure studies.
The method was applied in interpreting results of a mea-surement campaign that focused on aerosol-cloud interac-tions taking place at a subarctic background site. A set of case studies was conducted, and the size-dependent activa-tion trends could be successfully explained by a maximum supersaturation that varied between 0.18 and 0.26% depend-ing on the case. There was no indication on the presence of organic films on particles that would be able to suppress condensation of water vapour nor any clear evidence on vari-ations in the peak supersaturation, in contrast to the results of a study by Mertes et al. (2005). Furthermore, the con-ducted analysis showed that the activated fractions and the total number of particles acting as CCN are expected to be highly sensitive to the particle hygroscopicity; for example, the latter quantity varied by a factor of 1.8–3.1, depending on the case, when the mean hygroscopic growth factors were varied by 10%. Here it should be noted that the particles were only moderately hygroscopic with hygroscopic growth factors varying between 1.1 and 1.4. Another important con-clusion that can be drawn from the case studies is that the size-dependent activation profiles may carry information on the mixing state of particles. This was demonstrated by a sen-sitivity study where the parameter describing the spread in the water-solubility of particles having the same dry size was varied. The results show that the steepness of the calculated activation curves changes notably in response to changes in the mixing state.
Appendix A
List of the key symbols used in Sect. 2
AFi – The measured fraction of activated particles in
the size classi.
AFi∗– The predicted fraction of activated particles in the size classi.
CNtot,i – The measured particle number concentration
in the size classi.
CNi(sc<s) – The number concentration of particles
having a critical supersaturation belowsin the size class i.
dp,i– The dry diameter of particles in the size classi. GRi – The normalized cumulative distribution of the
hygroscopic growth factors of the particles in the size classi.
Ki – The fraction of particles in the size classithat are activated according to the K¨ohler theory at a supersatu-rations(Ki(s)=CNi(sc<s)/CNtot,i).
smax– The maximum supersaturation, estimated using
the approach described in Sect. 2, that is reached in the observed cloud(s).
SFi – The normalized cumulative distribution of the
water-soluble volume fraction of particles in the size classi.
GSD– Geometric standard deviation.
Appendix B
Expressions for the cumulative distributions of hy-groscopic growth factors
The humidified particle size distributions measured by the second DMA in H-TDMA instrument can be often described by a log-normal or Gaussian distribution(s). In the former case, the functionGRiin (5) is the following:
GRi[hi(s)]=
1 2+
1 2erf
"
ln [hi(s)]−ln(g∗)
√
2 ln(σg)
#
, (B1)
whereg∗andσ
gare the mean growth factor and the
geomet-ric standard deviation of the mode, respectively. When the humidified distribution is a Gaussian,GRi has the following
functional form:
GRi[hi(s)]=
1 2+
1 2erf
"
hi(s)−g∗
√
2σg
#
(B2)
Acknowledgements. The work has been supported financially by the EC projects ACCENT (European Network of Excellence in Atmospheric Composition Change) and EUSAAR (European Supersites for Atmospheric Aerosol Research), as well as by the Maj and Tor Nessling Foundation. One of the authors (T. A.) ac-knowledges financial support from the Emil Aaltonen Foundation.
Edited by: A. Nenes
References
Abdul-Razzak, H. and Ghan, S.: A parameterization of aerosol ac-tivation: 2. Multiple aerosol types, J. Geophys. Res., 105(D6), 6837–6844, 2000.
Abdul-Razzak, H. Ghan, S. J.: Parameterization of the influence of surface-active organics on aerosol activation, J. Geophys. Res, 109, D03205, doi:10.1029/2003JD004043, 2004.
Adamson, A. W., Gast, A. P.: Physical Chemistry of Surfaces. John Wiley & Sons Inc., USA, 1997.
Broekhuizen, K., Chang, R., Leaitch, W., Li, S., and Abbatt, J. P. D.: Closure between measured and modeled cloud condensation nuclei (CCN) using size-resolved aerosol compositions in down-town Toronto, Atmos. Chem. Phys., 6, 2513–2524, 2006, http://www.atmos-chem-phys.net/6/2513/2006/.
Chen, Y. and Penner, J. E.: Uncertainty analysis for estimates of the first indirect aerosol effect, Atmos. Chem. Phys., 5, 2935–2948, 2005, http://www.atmos-chem-phys.net/5/2935/2005/.
Chuang, P., Charlson, R., and Seinfeld, J.: Kinetic limitation on droplet formation in clouds, Nature, 390, 594–596, 1997. Cocker III, D. R., Whitlock, N. E., Flanagan, R. C., and Seinfeld,
J. H.: Hygroscopic properties of Pasadena, California aerosol, Aerosol Sci. Tech., 35, 637–647, 2001.
Cohard, J.-M., Pinty, J.-P., and Suhre, K.: On the parameterization of activation spectra from cloud condensation nuclei microphys-ical properties, J. Geophys. Res., 105(D9), 11753–11766, 2000. Dusek, U., Frank, G. P., Hildebrandt, L., Curtius, J., Schneider, J.,
Walter, S., Chand, D., Drewnick, F., Hings, S., Jung, D., Bor-rmann, S., and Andreae, M. O.: Size matters more than chem-istry for cloud-nucleating ability of aerosol particles, Science, 312, 1375–1378, 2006.
Draxler, R. R. and Rolph, G. D.: HYSPLIT (HYbrid Single-Particle Lagrangian Integrated Trajectory) Model access via NOAA ARL READY Website (http://www.arl.noaa.gov/ready/hysplit4.html), NOAA Air Resources Laboratory, Silver Spring, MD, USA, 2003.
Ervens, B., Cubison, M., Andrews, E., Feingold, G., Ogren, J. A., Jimenez, J.L., DeCarlo, P., and Nenes, A.: Prediction of cloud condensation nucleus number concentration using measurements of aerosol size distributions and composition and light scattering enhancement due to humidity, J. Geophys. Res., 112, D10S32, doi:10.1029/2006JD007426, 2007.
Ferron, G. A., Karg, E., Busch, B., and Heyder, J.: Ambient par-ticles at an urban, semi-urban and rural site in Central Europe: Hygroscopic properties, Atmos. Env., 39, 343–352, 2005. Gasparini, R., Collins, D. R., Andrews, E., Sheridan, P. J., Ogren,
J. A., and Hudson, J. G.: Coupling aerosol size distributions and size-resolved hygroscopicity to predict humidity-dependent opti-cal properties and cloud condensation nuclei spectra, J. Geophys. Res., 111, D05S13, doi:10.1029/2005JD006092, 2006.
Ghan, S. J. and Schwartz, S. E.: Aerosol properties and processes – A path from field and and laboratory measurements to global climate models, B. Am. Meteorol. Soc., 88, 1059–1083, 2007. Hallberg, A., Noone, K. J., and Ogren, J. A.: Aerosol particles and
clouds: which particles form cloud droplets?, Tellus, 50B, 59– 75, 1998.
Henning, S., Weingartner, E., Schmid, S., Wendisch, M., G¨aggeler, H. W., and Baltensberger, U.: Size-dependent aerosol activation at the high-alpine site Jungfraujoch (3580 m asl), Tellus, 54B, 82–95, 2002.
Hudson, J. G.: Variability of the relationship between particle size and cloud-nucleating ability, Geophys. Res. Lett., 34, L08801, doi:10.1029/2006GL028850, 2007.
IPCC. Climate Change 2007: The Physical Science Basis. Con-tribution of Working Group I to the Fourth Assessment Report of the Intergovernmental Panel on Climate Change, edited by: Solomon, S., Qin, D., and Manning, M., 2007.
Joutsensaari, J., Vaattovaara, P., Vesterinen, M., H¨ameri, K., and Laaksonen, A.: A novel tandem differential mobility an-alyzer with organic vapor treatment of aerosol particles, At-mos. Chem. Phys., 1, 51–60, 2001, http://www.atmos-chem-phys.net/1/51/2001/.
Khvorostyanov, V. I. and Curry, J. A.: Aerosol size spectra and CCN activity spectra: Reconciling the lognormal, al-gebraic, and power laws, J. Geophys. Res., 111, D12202, doi:10.1029/2005JD006532, 2006.
Kivek¨as, N., Kerminen, V.-M., Anttila, T., Korhonen, H., Li-havainen, H., Komppula, M., and Kulmala, M.: Parameteriza-tion of cloud droplet activaParameteriza-tion using a simplified treatment of the aerosol number size distribution. J. Geophys. Res., 113, D15207, doi:10.1029/2007JD009485.
Knutson, E. O. and Whitby, K. T.: Aerosol classification by electric mobility: Apparatus, theory, and applications, J. Aerosol Sci., 6, 443–451, 1975.
Komppula, M., Lihavainen, H., Kerminen, V-M., Kulmala, M., and Viisanen, Y.: Measurements of cloud droplet activation of aerosol particles at a clean subarctic background site, J. Geophys. Res., 110, D06204, doi:10.1029/2004JD005200, 2005.
Komppula, M., Lihavainen, H., Hyv¨arinen, A.-P., Kerminen, V.-M., Aaltonen, V., Engler, C., Kivek¨as, N., Leskinen, A., Vaattovaara, P., Rautiainen, J., Miettinen, P., Tiitta, P., Sorjamaa, R., Hillamo, R., Makkonen, U., Viisanen, Y., and Laaksonen, A.: Physical and chemical properties of aerosol particles and cloud droplets during the Second Pallas Cloud Experiment (Second PaCE), Pro-ceedings of the 7th International Aerosol Conference edited by: Biswas, P., Chen, D. R., and Hering, S., St. Paul, USA, 10–15 September 2006, 1352–1353, 2006.
Kreidenweis, S. M., Koehler, K., DeMott, P. J., Prenni, A. J., Car-rico, C., and Ervens, B.: Water activity and activation diameters from hygroscopicity data – Part I: Theory and application to in-organic salts, Atmos. Chem. Phys., 5, 1357–1370, 2005, http://www.atmos-chem-phys.net/5/1357/2005/.
Kuwata, M., Kondo, Y., Miyazaki, Y., Komazaki, Y., Kim, J. H., Yum, S. S., Tanimoto, H., and Matsueda, H.: Cloud condensa-tion nuclei activity at Jeju Island, Korea in spring 2005, Atmos. Chem. Phys., 8, 2933–2948, 2008,
http://www.atmos-chem-phys.net/8/2933/2008/.
inorganic solute, J. Atmos. Sci., 55, 1859–1866, 1998.
Lohmann, U., Quaas, J., Kinne, S., and Feichter, J.: Different ap-proaches for constraining global climate models of the anthro-pogenic indirect aerosol effect, Bul. Am. Meteorol. Soc., 88, 243–249, 2007.
Martinsson, B., Frank, G., Cederfelt, S.-I., Swietlicki, E., Berg, O., Zhou, J., Bower, K. N., Bradbury, C., Birmili, W., Stratmann, F., Wendisch, M., Wiedensohler, A., and Yuskiewicz, B.: Droplet nucleation and growth in orographic clouds in relation to the aerosol population, Atmos. Res., 50, 289–315, 1999.
McFiggans, G., Artaxo, P., Baltensperger, U., Coe, H., Facchini, M. C., Feingold, G., Fuzzi, S., Gysel, M., Laaksonen, A., Lohmann, U., Mentel, T. F., Murphy, D. M., O’Dowd, C. D., Snider, J. R., and Weingartner, E.: The effect of physical and chemi-cal aerosol properties on warm cloud droplet activation, Atmos. Chem. Phys., 6, 2593–2649, 2006,
http://www.atmos-chem-phys.net/6/2593/2006/.
McMurry, P. H.: A review of atmospheric aerosol measurements, Atmos. Environ., 34, 1959–1999, 2000.
Medina, J., Nenes, A., Sotiropoulou, R. P., Cottrell, L. D., Ziemba, L. D., Beckman, P. J., and Griffin, R. J.: Cloud condensation nuclei closure during the International Consortium for Atmo-spheric Research on Transport and Transformation 2004 cam-paign: Effects of size-resolved composition, J. Geophys. Res., 112, D10S31, doi:10.1029/2006JD007588, 2007.
Mertes, S., Lehmann, K., Nowak, A., Massling, A., and Wieden-sohler, A.:. Link between aerosol hygroscopic growth and droplet activation observed for hill-capped clouds at connected flow conditions during FEBUKO, Atmos. Env., 39, 4247–4256, 2005.
Ming, Y., Ramaswamy, V., Donner, L. J., and Phillips, V. T. J.: A new parameterization of cloud droplet activation applicable to general circulation models, J. Atmos. Sci., 63, 1348–1356, 2006. Mochida, M., Kuwata, M., Miyakawa, T., Takegawa, N., Kawamura, K., and Kondo, Y.: Relationship between hy-groscopicity and cloud condensation nuclei activity for ur-ban aerosols in Tokyo, J. Geophys. Res, 111, D23204, doi:10.1029/2005JD006980, 2006.
Nenes, A., Pandis, S. N., and Pilinis, C.: ISORROPIA: a new ther-modynamic model for inorganic multicomponent atmospheric aerosols, Aq. Geochem., 4, 123–152, 1998.
Nenes A., Ghan S., Abdul-Razzak, H., Chuang, P. Y., and Seinfeld, J. H.: Kinetic limitations on cloud droplet formation and impact on cloud albedo. Tellus, 53B, 133-149, 2001.
Nenes, A. and Seinfeld, J. H.: Parameterization of cloud droplet formation in global climate models, J. Geophys. Res., 108(D14), 4415, doi:10.1029/2002JD002911, 2003.
Noone, K. J., Ogren, J. A., Hallberg, A., Heintzenberg, J., Str¨om, J., Hansson, H.-C., Svenningsson, I. B., Wiedensohler, A., Fuzzi, S., Facchini, M. C., Arends, B. G., and Berner, A.: Changes in aerosol size- and phase distributions due to physical and chemi-cal processes in fog, Tellus B44, 489–504, 1992.
O’Dowd, C. D., Facchini, M. C., Cavalli, F., Ceburnis, D., Mircea, M., Decesari, S., Fuzzi, S., Yoon, Y. J., and Putaud, J. P.: Biogenically-driven organic contribution to marine aerosol, Na-ture, 431, 676–680, doi:10.1038/nature02959, 2004.
Padr´o, L. T., Asa-Awuku, A., Morisson, R., and Nenes, A.: In-ferring thermodynamic properties from CCN activation experi-ments a) single-component and binary aerosols, Atmos. Chem.
Phys., 7, 5263–5274, 2007,
http://www.atmos-chem-phys.net/7/5263/2007/.
Petters, M. D. and S. M. Kreidenweis, S. M.: A single parame-ter representation of hygroscopic growth and cloud condensation nucleus activity, Atmos. Chem. Phys., 7, 1961–1971, 2007, http://www.atmos-chem-phys.net/7/1961/2007/.
Pruppacher, H. R. and Klett, J. D.: Microphysics of Clouds and Precipitation. 2nd ed. Kluwer Academic, New York, USA, 1997. Quinn, P. K., Bates, T. S., Coffman, D. J., and Covert, D. S.: In?uence of particle size and chemistry on the cloud nucleating properties of aerosols, Atmos. Chem. Phys., 8, 1029–1042, 2008, http://www.atmos-chem-phys.net/8/1029/2008/.
Reischl, G. P.: Measurement of ambient aerosols by the different mobility analyzer method: concepts and realization criteria for the size range between 2 and 500 nm, Aerosol Sci. Technol., 14, 5–24, 1991.
Rissler, J., Swietlicki, E., Zhou, J., Roberts, G., Andreae, M. O., Gatti, L. V., and Artaxo, P.: Physical properties of the sub-micrometer aerosol over the Amazon rain forest during the wet-to-dry season transition – comparison of modeled and measured CCN concentrations. Atmos. Chem. Phys., 4, 2119–2143, 2004, http://www.atmos-chem-phys.net/4/2119/2004/.
Rissman, T. A., VanReken, T. M., Wang, J., Gasparini, R., Collins, D. R., Jonsson, H. H. Brechtel, F. J., Flagan, R. C., and Seinfeld, J. H.: Characterization of ambient aerosol from measurements of cloud condensation nuclei during the 2003 Atmospheric Radia-tion Measurement Aerosol Intensive ObservaRadia-tional Period at the Southern Great Plains site in Oklahoma, J. Geophys. Res., 111, D05S11, doi:10.1029/2004JD005695, 2006.
Shulman, M. L., Jacobson, M. C., Charlson, R. J., Synovec, R. E., and Young, T. E.: Dissolution behaviour and surface tension ef-fects of organic compounds in nucleating cloud droplets, Geo-phys. Res. Lett., 23, 277–280, 1996.
Snider, J. R., Guibert, S., Brenguier, J.-L., and Putaud, J.-P.: Aerosol activation in marine stratocumulus clouds: 2. K¨ohler and parcel theory closure studies. J. Geophys. Res., 108, 8629, doi:10.1029/2002JD002692, 2003.
Sorjamaa, R., Svenningsson, B., Raatikainen, T., Henning, S., Bilde, M., and Laaksonen, A.: The role of surfactants in K¨ohler theory reconsidered, Atmos. Chem. Phys., 4, 2107–2117, 2004, http://www.atmos-chem-phys.net/4/2107/2004/.
Stoltzenburg, M. R. :An ultrafine aerosol size distribution measur-ing system, Ph.D. Thesis, University of Minnesota, 1998. Stroud, C. A., Nenes, A., Jimenez, J. L., DeCarlo, P. F., Alex
Huff-man, J., Bruintjes, R. Nemitz, E., Delia, A. E., Toohey, D. W., Guenther, A. B., and Nandi, S.: Cloud Activating Properties of Aerosol Observed during CELTIC, J. Atmos. Sci., 64, 441–459, 2007.
Svenningsson, B., Hansson, H.-C., Wiedensohler, A., Noone, K. J., Ogren, J. A., Hallberg, A., and Colvile, R.: Hygroscopic growth of aerosol particles and its influence on nucleation scavenging in cloud: experimental results from Kleiner Feldberg, J. Atmos. Chem., 19, 129–151, 1994.
Svenningsson, B., Hansson, H.-C., Martinsson, B., Wiedensohler, A., Swietlicki, E., Cederfelt, S.-I., Wendisch, M., Bower, K. N., Choularton, T. W., and Colvile, R. N.: Cloud droplet nucleation scavenging in relation to the size and hygroscopic behaviour of aerosol particles, Atmos. Env., 31, 2463–2475, 1997.
Cederfelt, S.-I., Dusek, U., Berner, A., Birmili, W., Wieden-sohler, A., Yuskiewicz, B., and Bower, K. N.: A closure study of sub-micrometer aerosol particle hygroscopic behaviour, Atmos. Res., 50, 205–240, 1999.
Tang, I. N. and Munkelwitz, H. R.: Water activities, densities, and refractive indices of aqueous sulfates and sodium nitrate droplets of atmospheric importance, J. Geophys. Res. 99, 18801–18808, 1994.
Targino A. C., Noone, K. J., Drewnick, F., Schneider, J., Krejci, R., Olivares, G., Hings, S., and Borrmann, S. Microphysical and chemical characteristics of cloud droplet residuals and interstitial particles in continental stratocumulus clouds, Atmos. Res., 86, 225–240, 2007.
Weingartner, E., Nyeki, S., and Baltensperger, U.: Seasonal and diurnal variation of aerosol size distributions (10<D<750 nm) at a high-alpine site (Jungfraujoch 3580 m asl), J. Geophys. Res., 104, 26809–26820, 1999.
Verheggen, B., Cozic, J., Weingartner, E., Bower, K., Mertes, S., Connolly, P., Gallagher, M., Flynn, M., Choularton, T., and Bal-tensperger, U.: Aerosol partitioning between the interstitial and condensed phase in mixed-phase clouds, J. Geophys. Res., 112, D23202, doi:10.1029/2007JD008714, 2007.
Ziese, M., Wex, H., Nilsson, E., Salma, I., Ocskay, R., Hennig, T., Massling, A., and Stratmann, F.: Hygroscopic growth and activa-tion of HULIS particles: Experimental data and a new iterative parameterization scheme for complex aerosol particles. Atmos. Chem. Phys., 8, 1855–1866, 2008,