www.atmos-chem-phys.net/13/11709/2013/ doi:10.5194/acp-13-11709-2013
© Author(s) 2013. CC Attribution 3.0 License.
Atmospheric
Chemistry
and Physics
A WRF simulation of the impact of 3-D radiative transfer on surface
hydrology over the Rocky Mountains and Sierra Nevada
K. N. Liou1, Y. Gu1, L. R. Leung2, W. L. Lee3, and R. G. Fovell1
1Joint Institute for Regional Earth System Science and Engineering, Department of Atmospheric and Oceanic Sciences, University of California, Los Angeles, CA 90095, USA
2Pacific Northwest National Laboratory, Richland, WA, USA
3Research Center for Environmental Changes, Academia Sinica, Taipei, Taiwan
Correspondence to:Y. Gu ([email protected])
Received: 3 July 2013 – Published in Atmos. Chem. Phys. Discuss.: 23 July 2013 Revised: 18 October 2013 – Accepted: 22 October 2013 – Published: 3 December 2013
Abstract.We investigate 3-D mountains/snow effects on so-lar flux distributions and their impact on surface hydrology over the western United States, specifically the Rocky Moun-tains and Sierra Nevada. The Weather Research and Forecast-ing (WRF) model, applied at a 30 km grid resolution, is used in conjunction with a 3-D radiative transfer parameterization covering a time period from 1 November 2007 to 31 May 2008, during which abundant snowfall occurred. A compar-ison of the 3-D WRF simulation with the observed snow water equivalent (SWE) and precipitation from Snowpack Telemetry (SNOTEL) sites shows reasonable agreement in terms of spatial patterns and daily and seasonal variability, although the simulation generally has a positive precipita-tion bias. We show that 3-D mountain features have a pro-found impact on the diurnal and monthly variation of surface radiative and heat fluxes, and on the consequent elevation-dependence of snowmelt and precipitation distributions. In particular, during the winter months, large deviations (3-D-PP, in which PP denotes the plane-parallel approach) of the monthly mean surface solar flux are found in the morning and afternoon hours due to shading effects for elevations below 2.5 km. During spring, positive deviations shift to the earlier morning. Over mountaintops higher than 3 km, positive devi-ations are found throughout the day, with the largest values of 40–60 W m−2occurring at noon during the snowmelt season of April to May. The monthly SWE deviations averaged over the entire domain show an increase in lower elevations due to reduced snowmelt, which leads to a reduction in cumula-tive runoff. Over higher elevation areas, posicumula-tive SWE devia-tions are found because of increased solar radiation available
at the surface. Overall, this study shows that deviations of SWE due to 3-D radiation effects range from an increase of 18 % at the lowest elevation range (1.5–2 km) to a decrease of 8 % at the highest elevation range (above 3 km). Since lower elevation areas occupy larger fractions of the land surface, the net effect of 3-D radiative transfer is to extend snowmelt and snowmelt-driven runoff into the warm season. Because 60–90 % of water resources originate from mountains world-wide, the aforementioned differences in simulated hydrol-ogy due solely to 3-D interactions between solar radiation and mountains/snow merit further investigation in order to understand the implications of modeling mountain water re-sources, and these resources’ vulnerability to climate change and air pollution.
1 Introduction
In conjunction with radiative transfer in mountains/snow regions, we have developed a Monte Carlo photon tracing program, which is specifically applicable to intense and com-plex inhomogeneous mountains. We demonstrate that the ef-fect of mountains on surface radiative balance is substantial in terms of subgrid variability as well as domain average con-ditions; a significant solar flux deviation of∼10–35 W m−2 from the plane-parallel radiation parameterization of conven-tional climate models would occur if realistic mountain fea-tures were accounted for in surface energy modeling (Chen et al., 2006; Liou et al., 2007; Lee et al., 2011, 2012). Be-cause of the computational burden required by the 3-D Monte Carlo photon tracing program, an innovative parameteriza-tion approach in terms of deviaparameteriza-tions from the PP radiative transfer results, which are readily available in climate mod-els, was developed for the five components of surface solar flux: direct and diffuse fluxes, direct- and diffuse-reflected fluxes, and coupled flux, which involves mountain interac-tions (Lee et al., 2011). In the development of 3-D radia-tion parameterizaradia-tion in terms of deviaradia-tions from PP results, we adopted the mean values for the sky view factor, the ter-rain configuration factor, the cosine of the solar zenith angle, and conventional topographic parameters for a preselected 10 km×10 km domain (involving mean elevation and slope
in multiple linear regression analysis, along with their stan-dard deviations and skewness). We used a rugged area of the Sierra Nevada as an experimental testbed for this develop-ment (Lee et al., 2011). Five regression equations for flux deviations, which are linear and have a general 5×5
ma-trix form, have been derived. The flux components computed from Monte Carlo simulations were used to assess the accu-racies of multiple regression analysis results for the five flux components, along with multiple determination coefficients,
R2, with a number of surface albedos. The most significant term is the direct flux, which generally has high correlations of > 0.9 with root mean square errors less than 3 W m−2(out of 700 W m−2). Deviations from plane-parallel results are on the order of 100 W m−2. For other flux components,R2 ranges between 0.6–0.9 and deviations are on the order of a few W m−2.
The preceding 3-D radiative transfer parameterization was incorporated into the Weather Research and Forecasting (WRF) model (Skamarock et al., 2005) to investigate and understand the impact of the spatial and temporal distribu-tion and variadistribu-tion of surface solar fluxes on land-surface processes (Gu et al., 2012). The model domain selected for the study was the Sierra Nevada, a mountain range that is centered at 35◦
N–120◦
W and covers the area from 135– 105◦
W and 20–45◦
N. 48 h model integrations have been performed starting on 29 March 2007, at 00:00 UTC. We showed that the mountain effect could produce deviations in downward surface solar fluxes as large as−50 to+50 W m−2 over mountain areas, resulting in a temperature increase of up to 1◦
C on the sunnier side. Surface sensible and latent heat fluxes are modulated accordingly to compensate for the
change in surface solar fluxes. Snow water equivalent (SWE) and surface albedo both show decreases on the sunny side of the mountains, indicating more snowmelt and hence reduced snow albedo associated with more solar insolation due to the mountain effect. The daily averaged deviations in surface so-lar flux are positive over the mountain areas and negative in the valleys, exhibiting a range between−12 and+12 W m−2. Differences in the domain-averaged diurnal variation over the Sierra Nevada illustrate that mountain areas receive more solar flux in the early morning and late afternoon, resulting in enhanced sensible heat and latent heat fluxes from the sur-face, and a corresponding increase in surface skin tempera-ture.
In this paper, we investigate the longer-term effect of 3-D radiative transfer over mountains/snow in the western United States covering both the narrow coastal Sierra Nevada and the broad continental Rocky Mountains. Marked by complex terrain, and a surface hydrology dominated by seasonal pre-cipitation and snow accumulation and melt (e.g., Leung et al., 2003a, b), the western United States presents an interest-ing region to study the effects of 3-D radiation on the surface energy and water balance. The surface hydrology of the re-gion has been shown to be sensitive to climate change (Le-ung et al., 2004; Kapnick and Hall, 2010) and aerosol de-position in snowpack (Qian et al., 2009). Thus, understand-ing the factors leadunderstand-ing to uncertainties in modelunderstand-ing snowpack and runoff is important for improving hydrologic predictions from seasonal to century time scales. We present pertinent simulation results in terms of deviations (3-D-PP) of surface solar fluxes and their impact on a number of surface param-eters from 1 November 2007 to 31 May 2008, during which abundant snowfall occurred. We focus our analysis on the complex terrains ranging from 1.5 km to above 3 km, which are grouped into four elevation zones.
The organization of the present study is as follows. In Sect. 2, we describe the WRF model used in this investiga-tion, followed by a discussion in Sect. 3 on comparison of 3-D simulation results with available observations for SWE and precipitation. In Sect. 4, we discuss the significance of 3-D radiation effect on the diurnal, monthly, and elevation variation in solar flux, sensible and latent heat fluxes, and surface skin temperature. We do likewise for the monthly av-eraged surface fluxes, cloud water path, SWE, precipitation, and runoff. Concluding remarks are given in Sect. 5.
2 3-D Radiation parameterization in a WRF model
Webb, 1970; Beljaars, 1994; Zhang and Anthes, 1982), Lin scheme for microphysics (Lin et al., 1983), Kain–Fritsch cumulus scheme (Kain and Fritsch, 1990, 1993), and YSU scheme for planetary boundary layer (Hong et al., 2006). For snow-covered surfaces, the Noah LSM considers a mixed snow-vegetation-soil layer and simulates the snow accumu-lation, sublimation, melting, and heat exchange at the snow– atmosphere and snow–soil interfaces using a simple snow parameterization developed by Koren et al. (1999). The 3-D radiation parameterization follows the approach presented above, which was used in connection with the Fu–Liou–Gu plane-parallel radiation scheme (Fu and Liou, 1992, 1993; Gu et al., 2010, 2011); this scheme has been included in the WRF physics package.
We have selected a domain covering the Rocky Moun-tains and Sierra Nevada in the western United States, which is centered at 35◦N–120◦W and covers the area from 135–
102.5◦
W and 20–45◦
N. The horizontal grid resolution is 30 km, and the vertical resolution has 28 model levels, the same as discussed in Sect. 1. Initial and boundary conditions are provided by the National Centers for Environmental Predic-tion (NCEP) Final (FNL) OperaPredic-tional Global Analysis avail-able from the Global Forecast System (GFS) every 6 h on 1.0×1.0 degree grids. Model integrations have been
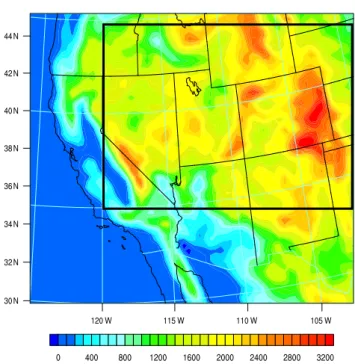
per-formed for a period of 7 months, starting on 1 November 2007 at 00:00 UTC and ending on 31 May 2008. This period was selected because the observed snowpack was above the climatological average during this time, enabling us to as-sess the effect of 3-D radiative transfer on surface hydrology during a wet year. To investigate the impact of 3-D moun-tains on surface insolation and snow budget over the Rocky Mountains and Sierra Nevada regions, we have designed the following two experiments. The PP experiment was the con-trol run in which the Fu–Liou–Gu radiation scheme was used for PP radiative transfer calculations, whereas the 3-D exper-iment was identical to PP, except that the parameterization for 3-D solar flux deviations over the Rocky Mountains and Sierra Nevada areas was implemented within the Fu–Liou– Gu radiation scheme. Figure 1 displays the elevation map over a 30 km resolution grid for the Rocky Mountains and Sierra Nevada areas in the western United States. The box on the map shows major mountainous areas where simulation results are analyzed.
3 Comparison with observations: SWE and precipitation
The spatial and temporal distributions of surface solar radi-ation are the primary energy sources that contribute to the energy and water balance at the 3-D and inhomogeneous mountain surface, particularly the snowmelt (Geiger, 1965; Bonan, 2002; Gu et al., 2002; Müller and Scherer, 2005). Figure 2b depicts a map of the monthly mean SWE (rang-ing from 5–1200 mm) for April 2008, simulated from the
Terrain Height (m): 30 x 30 km2 Resolution
Fig. 1.The elevation map over a 30 km resolution grid for the Rocky
Mountains and Sierra Nevada areas in the western United States. The box on the map displays major mountainous areas where sim-ulation results are analyzed and presented in the paper.
WRF with the inclusion of 3-D radiation parameterization for mountains/snow. The simulation SWE results are seen over the vast Rocky Mountains region and, to a lesser degree, over the Sierra Nevada to the west. The SWE pattern shows rel-atively smaller values at the highest elevation in response to the reduced precipitation and the largest solar flux available at mountaintops. The 3-D mountain shading effect also plays a pivotal role in reducing the solar flux availability at some lower-elevation areas, resulting in more SWE accumulation in these areas.
Snow Water Equivalent (SWE, mm)
(d) 3D Model
2.5-3 km
> 3 km
(b) 3D Model (c) CMC Obs
All Changes 0.85 Fresh Snow Albedo Stability Adjustment Terrain Adjustment Time-varying Albedo Control SNOTEL
May
Nov Dec Jan Feb Mar Apr Jun Jul Aug (e) Rasmussen et al. (2011)
120W 118W 116W 114W 112W 110W 108W 106W 104W 120W 118W 116W 114W 112W 110W 108W 106W 104W 120W 118W 116W 114W 112W 110W 108W 106W 104W (a) 3D - PP
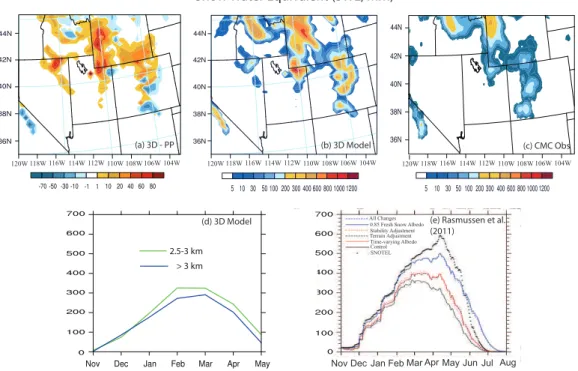
Fig. 2. (a)The monthly mean SWE deviation (3-D-PP) map.(b)The monthly mean SWE map (5–1200 mm, see Fig. 1) for April 2008
simulated from the WRF with the inclusion of 3-D radiation parameterization.(c)The monthly mean SWE values estimated from the Northern Hemisphere daily snow depth analysis data processed by the Canadian Meteorological Centre (CMC).(d)The monthly time series of SWE for the study domain for two elevation zones of 2.5–3 km and > 3 km.(e)The monthly time series of SWE presented in Rasmussen et al. (2011). The black dots denote the SWE measurements collected at stations that are typically between 2.4 and 3.6 km in Colorado.
2.4 and 3.6 km in Colorado), and the various curves corre-spond to WRF simulations performed at a 4 km resolution with various adjustments and averaged over all the SNOTEL locations. Our results at the two elevation zones, simulated by the WRF at a 30 km resolution with 3-D radiation param-eterization, are smaller than the observed SNOTEL data and the results of 4 km resolution WRF simulations. Considering the fact that no specific changes have been made to the WRF model for our simulations, as well as the coarser spatial res-olution in our study, our results are in reasonable agreement with the control simulation displayed in Fig. 2e. Addition-ally, we have included contours of differences (3-D-PP) in the simulated SWE (Fig. 2a). In comparison with CMC ob-servations, WRF model results tend to produce larger SWE values over mountain areas. As shown, the incorporation of 3-D radiation parameterization has reduced model overesti-mation in reference to PP results to certain degree. However, the model overestimation bias involving SWE can come from a number of sources, including snow parameterization and precipitation bias, and cannot be solely resolved by 3-D ra-diation parameterization.
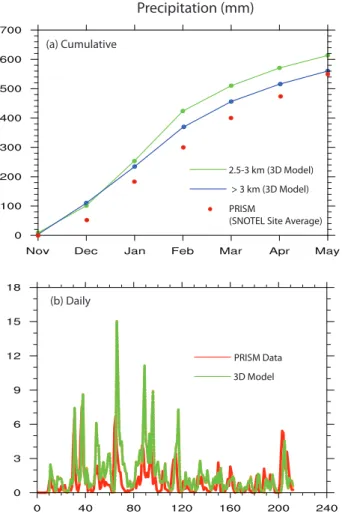
Moreover, we compared the domain-averaged monthly cumulative precipitation from the 3-D simulation for two elevation zones of 2.5–3 km and > 3 km with the Parameter-elevation Regressions on Independent Slopes
2.5-3 km (3D Model)
> 3 km (3D Model)
PRISM Data
3D Model
Precipitation (mm)
(b) Daily
PRISM
(SNOTEL Site Average)
(a) Cumulative
Fig. 3. (a)The domain-averaged monthly cumulative precipitation
simulated from the present model for two elevation zones (2.5–3 km and > 3 km) with the Parameter-elevation Regressions on Indepen-dent Slopes Model (PRISM) data, which are the averaged results determined from cumulative precipitation measured from 112 SNO-TEL sites.(b)The daily precipitation time series (0–240 days) com-puted from the 3-D model, along with the PRISM data.
4 Discussions of the 3-D radiation impacts on simulation results
4.1 Diurnal/monthly/elevation variation
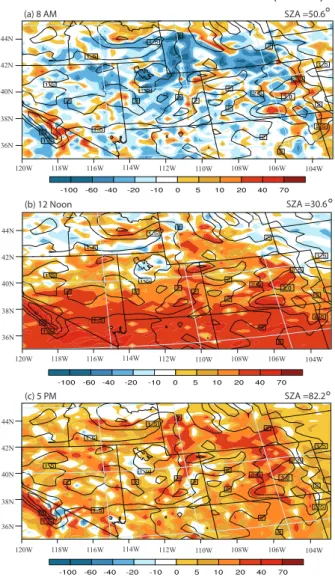
The diurnal variation of downward surface solar flux over mountain areas is critically important to regional weather and climate predictions. Figure 4 illustrates simulated devi-ations in the monthly averaged downward solar flux at the surface (3-D-PP) for 08:00, 12:00, and 17:00 local time in April 2008. The spatial and temporal variations of surface solar flux over the Rocky Mountains and Sierra Nevada re-gions are determined by the position of the Sun. The aver-aged solar zenith angles for the month of April correspond-ing to the three local times are also depicted in the figure. In the early morning, sunlight comes from the east, and
posi-tive deviations are shown on the southeast side of the moun-tains, while negative values are located in the northwest re-gion. At noon, positive deviations are mostly located south of 38◦
N and on mountaintops, while negative values are seen north of the mountains, especially in valley areas. In the late afternoon, the opposite conditions occur; increases in solar flux are located in the southwest of the mountains, while de-creases in solar flux are found in the northeast region. Solar flux deviations at each grid box are affected by surround-ing mountains through 3-D radiation parameterization us-ing a 1 km subgrid topographic data and the averaged solar zenith angle. For the north–south oriented mountains (e.g., the Sierra Nevada: 118–120◦
W, 36–38◦
N), positive/negative deviations are generally found on the mountain’s east/west sides in the morning (Fig. 4a), and its west/east sides in the afternoon (Fig. 4c). These deviations are distributed over the mountains and surrounding regions at noon (Fig. 4b). For west–east oriented mountains (e.g., 112–115◦
W, 44◦
N), positive deviations are primarily located at the mountain’s south slope. Also, the solar zenith angle has an impact on the latitudinal distribution of solar flux deviations. Because less solar fluxes are available at high latitudes, solar flux devia-tions due to the 3-D mountain effect are smaller. However, positive/negative patterns are primarily dependent on moun-tain orientation and elevation.
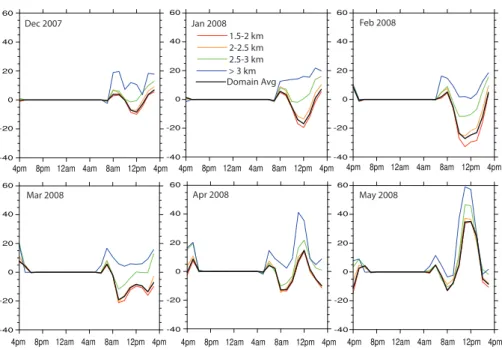
Deviations (3-D-PP) in the monthly mean domain-averaged diurnal variation time series of downward surface solar flux for a number of elevation ranges, including 1.5– 2 km (red), 2–2.5 km (orange), 2.5–3 m (green), above 3 km (blue), as well as the whole domain (black), over the Rocky Mountains and Sierra Nevada areas are shown in Fig. 5 for 6 months (December 2007 to May 2008). Flat lines denote nighttime, during which solar insolation is zero. During the winter months (December 2007–February 2008), positive de-viations in the surface solar flux are found in the morning (07:00–10:00) and afternoon (14:00–17:00), while negative deviations are shown between 10:00–14:00 for lower eleva-tions (below 2.5 km). For the higher elevation of 2.5–3 km, the negative-deviation regions only occur in February. The maximum negative deviation occurs in the lower elevation (1.5–2 km) around noon in February, with a value on the order of 30 W m−2 produced by the 3-D mountain effect. During the spring (March–May 2008), positive deviations shifts to earlier morning (06:00–08:00) while negative de-viations begin to occur at 08:00. Negative dede-viations become smaller in magnitude at noontime because of overhead sun-light, which reduces the shading effect. Starting in April, pos-itive deviations are seen around noon, in addition to those in the early morning and later afternoon, leading to larger diur-nal variations during the day. Over the mountaintops (above 3 km), positive deviations are found throughout the day, indi-cating that more solar fluxes are available in this region due to the 3-D mountain effect. The maximum positive deviation is found around noon in May with a value of∼60 W m−2,
Downward Surface Solar Flux Deviations (3D - PP)
(b) 12 Noon
(c) 5 PM
SZA =50.6
SZA =30.6
SZA =82.2 (a) 8 AM
44N
42N
40N
38N
36N
120W 118W 116W 114W 112W 110W 108W 106W 104W
120W 118W 116W 114W 112W 110W 108W 106W 104W
120W 118W 116W 114W 112W 110W 108W 106W 104W 44N
42N
40N
38N
36N
44N
42N
40N
38N
36N
3.0
3.0
3.0
Fig. 4.Deviations (3-D-PP) in the monthly averaged downward
sur-face solar flux distributions in W m−2for 8 AM, 12 noon, and 5 PM
local time in April 2008 (see the box in Fig. 1). The solar flux scale ranges from – 100 to+70 W m−2. Also shown are elevation height
contours of 1.5, 2, 2.5, and 3 km.
domain averaged variation is basically dominant at the lower elevations (below 2.5 km), which comprise∼65 % of the
do-main area in the current analysis. The available surface solar flux increases from December to May at any given time of the day, resulting in enhanced deviations (3-D-PP) induced by shading and elevation effects.
Moreover, it should be pointed out that the flux deviation (3-D-PP) at each model grid box is affected by surrounding mountains via 3-D radiation parameterization using the so-lar zenith angle and 1 km topographic data as the building block. In the parameterization, the sky view factor and the terrain configuration factor are used to represent the distance and height of nearby mountains with respect to a target point
at a given solar zenith angle. An unobstructed horizontal sur-face will intercept radiation emitted from the sun in all direc-tions. Over mountainous areas, however, the solar fluxes in-tercepted at a target point are subject to being blocked by sur-rounding mountains. Consequently, only a portion of the sky dome can be visible at the target point, which is defined by the sky view factor, representing the shadow effect of moun-tains on the direct and diffuse solar fluxes reaching the target point. The terrain configuration factor is defined as the area of surrounding mountains visible at the target point, which determines the portion of solar fluxes that is reflected to the target point from surrounding mountains. This parameter will affect the direct- and diffuse-reflected fluxes as well as the coupled flux induced by mountain topography.
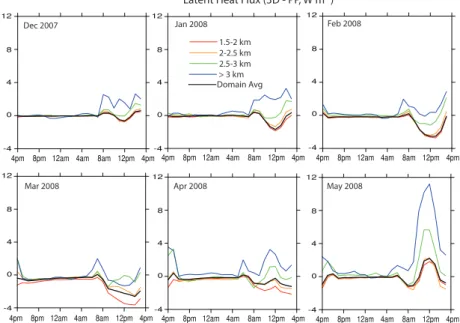
Increases or decreases in the surface downward solar radi-ation affect latent and sensible fluxes, leading to surface skin temperature variation, all of which are displayed in Figs. 6– 8. Changes in the seasonal sensible and latent heat fluxes – as functions of local time and elevation – basically follow the patterns of solar flux presented above. However, negative (winter) and positive (spring) deviations become smaller in magnitude around noon. The sensible heat flux is generally greater than the latent heat flux associated with temperature and water vapor gradients in mountain areas. For example, in May, we see a maximum of ∼30 W m−2 around noon
for sensible heat flux compared to ∼10 W m−2 for latent
heat flux. Deviations in the surface skin temperature largely match the diurnal time series patterns in surface solar fluxes during winter and spring. The surface skin temperature dis-plays cooling for lower elevations (< 2.5 km) produced by the 3-D mountain effect (except during the daytime in May). In mountaintop regions (> 3 km), warming is found throughout the day for both winter and spring, the degree of which is dependent on the mean solar zenith angle and sunlight hour. The surface temperature deviation ranges between−0.3 and
+0.3 K, except in May, during which surface temperature varies from 0.3 to 1.2 K.
4.2 Monthly averaged surface fluxes, CWP, SWE, precipitation, and runoff
The monthly averaged downward solar flux map for April 2008 simulated for the 3-D case as a function of latitude and longitude is shown in Fig. 9a. The corresponding deviations (3-D-PP) are displayed in Fig. 9c. Because of the cancella-tion of opposite deviacancella-tions on the two sides of mountains during morning and afternoon hours, solar flux is enhanced broadly on the south-facing side of the mountains south of 38◦
N and reduced on the north- facing side northward of 38◦
N. In addition, larger increases in solar flux due to the 3-D effect are mainly found over mountaintops. Larger re-ductions, on the other hand, are mostly observed over val-ley areas between 40–44◦
N and west of 110◦
Dec 2007 Jan 2008 Feb 2008
Mar 2008 Apr 2008 May 2008
1.5-2 km 2-2.5 km 2.5-3 km > 3 km Domain Avg
Surface Solar Flux (3D - PP, W m-2)
Fig. 5.Deviations (3-D-PP) in the monthly mean domain-averaged diurnal variation time series of surface solar flux for a number of elevation
ranges, including 1.5–2 km (red), 2–2.5 km (orange), 2.5–3 m (green), above 3 km (blue), as well as the whole domain (black), over the Rocky Mountains–Sierra Nevada area for 6 months (December 2007 to May 2008). Flat lines denote nighttime, during which solar insolation is zero.
Dec 2007 Jan 2008 Feb 2008
Mar 2008 Apr 2008 May 2008
Sensible Heat Flux (3D - PP, W m-2)
1.5-2 km 2-2.5 km 2.5-3 km > 3 km Domain Avg
Fig. 6.Same as in Fig. 5, except for the monthly mean domain-averaged diurnal variation time series of sensible heat flux.
formation of clouds, which in turn will impact the transfer of solar flux reaching the surface. Thus, we also examine cloud water path (CWP) produced from experiments 3-D and PP for April 2008. Figure 9b shows the CWP distributions, while Fig. 9d displays deviations (3-D-PP). In reference to Fig. 9d, CWP increases over the mountain summits in the vicinity of
Jan 2008 Feb 2008
Mar 2008 Apr 2008 May 2008
Dec 2007
Latent Heat Flux (3D - PP, W m-2)
1.5-2 km 2-2.5 km 2.5-3 km > 3 km Domain Avg
Fig. 7.Same as in Fig. 5, except for the monthly mean domain-averaged diurnal variation time series of latent heat flux.
Jan 2008 Feb 2008
Mar 2008 May 2008
Dec 2007
Surface Skin Temperature (3D - PP, K)
1.5-2 km 2-2.5 km 2.5-3 km > 3 km Domain Avg
Apr 2008
Fig. 8.Same as in Fig. 5, except for the monthly mean domain-averaged diurnal variation time series of surface skin temperature.
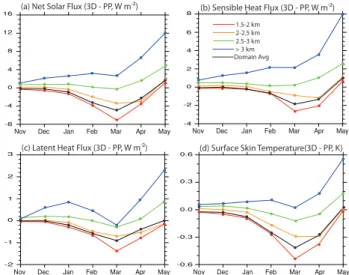
In Fig. 10a–d, we show deviations (3-D-PP) of the domain-averaged monthly net solar flux, which is defined as the downward solar flux multiplied by (1–A), where A
is the monthly surface albedo, sensible and latent heat fluxes, and surface skin temperature for a 7 month period as a func-tion of elevafunc-tion. For net solar, sensible heat, and latent heat fluxes over lower elevations (< 2.5 km), negative deviations are shown, with the largest reduction occurring in March. Surface skin temperature largely follows the preceding flux
patterns. For higher elevations (> 2.5 km), positive deviations are seen, with a minimum between the months of February and March and substantial increases in deviations starting in March associated with the position of the sun. The monthly changes of the whole domain basically follow the pattern of lower elevation ranges (< 2.5 km) which comprise∼65 % of
the area mentioned previously.
Downward Solar Fux (W m-2) Cloud Water Path (g m-2)
44N
42N
40N
38N
36N
April 2008
44N
42N
40N
38N
36N
44N
42N
40N
38N
36N 44N
42N
40N
38N
36N
120W118W116W114W112W 110W108W 106W 104W 120W118W116W114W112W 110W108W 106W 104W
120W118W116W114W112W 110W108W 106W 104W 120W118W116W114W112W 110W108W 106W 104W
(a) 3D (b) 3D
(c) 3D - PP (d) 3D - PP
Fig. 9. (a)The monthly averaged surface solar flux (W m−2)map
for April 2008 simulated for the 3-D case as a function of latitude and longitude.(b)The monthly averaged Cloud Water Path (CWP, g m−2)map for April 2008 simulated for the 3-D case as a function
of latitude and longitude.(c)The corresponding deviation (3-D-PP) map for downward solar flux.(d)The corresponding deviation (3-D-PP) map for CWP.
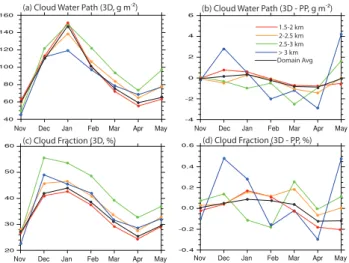
elevation is illustrated in Fig. 11a. The corresponding de-viations (3-D-PP) are displayed in Fig. 11b. The cloud wa-ter over the Rocky Mountains and Sierra Nevada regions appears to generally increase starting in November and, af-ter reaching a maximum in January, decreases until April; subsequently, it shows a trend of increasing in May. From November to January, due to the 3-D mountain effect, CWP presents positive changes for the lowest elevation (1.5–2 km) and elevations > 3 km. From January to April, negative de-viations occur in all elevation areas. The monthly averaged cloud fraction (%) is shown in Fig. 11c, with the associated deviations depicted in Fig. 11d. Their patterns generally fol-low those of CWP.
The monthly mean SWE (mm) averaged over the entire domain as a function of elevation is shown in Fig. 12a. The corresponding SWE deviations (3-D-PP) are displayed in Fig. 12d; these deviations show an increase in lower eleva-tions, due to the mountain shading effect, with the largest value occurring in March. The positive deviations become
(a) Net Solar Flux (3D - PP, W m-2) (b) Sensible Heat Flux (3D - PP, W m-2)
(c) Latent Heat Flux (3D - PP, W m-2) (d) Surface Skin Temperature(3D - PP, K)
1.5-2 km 2-2.5 km 2.5-3 km > 3 km Domain Avg
Fig. 10.Deviations (3-D-PP) of the domain-averaged monthly(a)
net solar flux,(b)sensible heat flux,(c)latent heat flux, and(d) sur-face skin temperature for a 7-month period (November 2007–May 2008) as a function of elevation. 1.5–2 km (red), 2–2.5 km (orange), 2.5–3 m (green), above 3 km (blue), and the whole domain (black).
smaller after March because the Sun is more often overhead during the spring, leading to a reduced shading effect. As a result of increased snow accumulation that reduces rain-fall and/or snowmelt contributions to runoff, the cumulative runoff deviations (3-D-PP) are reduced for lower elevation areas (Fig. 12f) with reference to the values produced from the 3-D mountain experiment displayed in Fig. 12c. Due to the mountain effect, SWE decreases over higher elevation ar-eas in connection with greater solar radiation available at the surface. At the elevation range above 3 km, SWE is reduced by 8 % in April and by 24 % in May due to 3-D effects. The cumulative runoff increases in February, and a maxi-mum increase occurs in April for the elevation range 2.5– 3 km, while for elevations above 3 km, the cumulative runoff values substantially increase after March because of the in-creased surface solar flux produced by the 3-D mountain ef-fect, which leads to increased snowmelt runoff. The surface runoff is calculated from the simple water balance (SWB) model (Schaake et al., 1996). The snow model in the Noah land-surface model simulates the snow accumulation, sub-limation, melting, and heat exchange at snow–atmosphere and snow–soil interfaces. The precipitation is categorized as snow when the temperature in the lowest atmospheric layer is below 0◦
C.
(a) Cloud Water Path (3D, g m-2)
(c) Cloud Fraction (3D, %)
(b) Cloud Water Path (3D - PP, g m-2)
(d) Cloud Fraction (3D - PP, %)
1.5-2 km 2-2.5 km 2.5-3 km > 3 km Domain Avg
Fig. 11. (a)The monthly averaged Cloud Water Path (CWP, g m−2)
over the entire domain simulated from the 3-D experiment as a func-tion of elevafunc-tion.(b) The corresponding deviations (3-D-PP) for CWP.(c)The monthly averaged cloud fraction (%) over the entire domain simulated from the 3-D experiment as a function of eleva-tion.(d)The corresponding deviations (3-D-PP) for cloud fraction. 1.5–2 km (red), 2–2.5 km (orange), 2.5–3 m (green), above 3 km (blue), and the whole domain (black).
terms of deviations (3-D-PP), we see decreases in higher ele-vation areas, with a minimum occurring in April in relation to the CWP deviation result (Fig. 11b), which also contributes to SWE decrease. For lower regions, precipitation deviations (Fig. 12e) increase and result in the increased SWE in con-junction with the reduced runoff. Thus, one important impact of the 3-D mountain effect is to delay the snowmelt-driven runoff into the warm season for lower elevations and, at the same time, to reduce the SWE in higher elevation regions.
5 Concluding remarks
The 3-D radiative transfer parameterization developed for the computation of surface solar fluxes has been incorporated into the WRF model and applied at a resolution of 30 km over the Rocky Mountains and Sierra Nevada in the western United States. We have carried out simulations for a seven-month period from 1 November 2007 to 31 May 2008, dur-ing which snow accumulation was abundant, to understand the effect of 3-D mountains/snow on the diurnal and monthly variation of surface radiative and heat fluxes and the conse-quence of snowmelt and precipitation at different elevations. The monthly mean SWE values from the WRF simulation with 3-D radiation are generally comparable in spatial pat-tern and seasonality to the CMC and SNOTEL data, in view of the relatively coarse resolution of 30 km compared to the 4 km resolution used for the WRF simulations presented by Rasmussen et al. (2011), our simulated SWE is high in mag-nitude. This is confirmed by comparing our simulated
pre-cipitation at high elevation zones (higher than 2.5 km) with SNOTEL data, which are also obtained at high elevations. Nevertheless, our simulations captured the spatial pattern, elevation dependence, and daily/seasonal variability of pre-cipitation and snowpack sufficiently well to provide confi-dence for investigating the impacts of 3-D radiation associ-ated with mountains/snow on the surface hydrology of the western United States. Key findings are summarized as fol-lows.
First, deviations of the monthly mean surface solar flux produced by 3-D mountain effects compared to PP results over the Rocky Mountains and Sierra Nevada regions are a function of elevation and time of the day. During win-ter, positive deviations up to 10 W m−2 are found in the morning from 07:00–10:00 as well as in the afternoon from 14:00–17:00 due to shading effects for areas at elevations be-low 2.5 km. The maximum negative deviation occurs in the lower elevation from 1.5–2 km around noon in February with a value of∼30 W m−2. During spring, positive deviations shifts to earlier morning (between 06:00–08:00), while neg-ative deviations begin to occur at 08:00. Over the mountain-tops above 3 km, positive deviations are found throughout the day, indicating that more solar fluxes are found in this region in association with longer daylight hours. The maximum pos-itive deviation is found around noon in May, with a value of
∼60 W m−2.
Second, deviations in the surface solar radiation field can affect latent and sensible heat fluxes, and the changes in the surface energy balance are reflected in changes in surface skin temperature. Changes in the seasonal sensible and la-tent heat fluxes as functions of local time and elevation pri-marily follow net solar flux patterns. Also, negative (winter) and positive (spring) deviations in sensible/latent heat fluxes become smaller in magnitude around noon. The deviations in sensible heat flux are generally greater than those of la-tent heat flux, which reflect the Bowen ratio in the semi-arid western United States. In May, we obtained a maximum of
∼30 W m−2around noon for sensible heat flux compared to ∼10 W m−2 for latent heat flux. Deviations in the surface
skin temperature, which largely follows the diurnal net solar flux pattern, displays cooling for elevations below 2.5 km due to shading effects. For mountaintop regions (> 3 km), warm-ing is found throughout the day for both winter and sprwarm-ing.
(a) Snow Water Equivalent (3D, mm) (b) Precipitation (3D, mm) (c) Cumulative Runoff (3D, mm)
(d) Snow Water Equivalent (3D - PP, mm) (e) Precipitation (3D - PP, mm) (f ) Cumulative Runoff (3D - PP, mm) 1.5-2 km
2-2.5 km 2.5-3 km > 3 km Domain Avg
Fig. 12. (a)The monthly mean snow water equivalent (SWE, mm) averaged over the simulation domain as a function of elevation.(b)The
monthly mean precipitation (mm) averaged over the simulation domain as a function of elevation.(c)The monthly mean cumulative runoff averaged over the simulation domain as a function of elevation.(d)The corresponding SWE deviations (3-D-PP).(e)The correspondence precipitation deviations (3-D-PP).(f)The correspondence runoff deviations (3-D-PP). 1.5–2 km (red), 2–2.5 km (orange), 2.5–3 m (green), above 3 km (blue), and the whole domain (black).
runoff increases in spring, with a maximum increase occur-ring in April for the elevation range 2.5–3 km. At the moun-taintops above 3 km, the cumulative runoff values substan-tially increase after March; this is associated with the in-creased surface solar flux produced by the 3-D mountain ef-fect, leading to increased snowmelt runoff. Precipitation creases from November to May, with substantially larger de-viations at elevations higher than 2.5 km. For lower eleva-tion regions, precipitaeleva-tion increases and contributes to the increased SWE due to shading effects. Thus, an important impact of the 3-D mountain effect is to enhance (reduce) the SWE in lower (higher) elevation regions, while concurrently shifting the runoff seasonality through changes in snowmelt. Overall, this study shows that deviations of SWE due to 3-D radiation effects range from an increase of 18 % at the lowest elevation range (1.5–2 km) to a decrease of 8 % at the highest elevation range (> 3 km) during the snowmelt season of April to May. Because lower elevation areas occupy larger fractions of the land surface, the net effect of 3-D radiation is to extend snowmelt and snowmelt-driven runoff into the warm season. The redistribution of SWE across different el-evations and the shift in runoff timing have important im-plications to cold season surface hydrology that may extend through the warm season due to changes in soil moisture and evapotranspiration. Since about 60–90 % of water re-sources worldwide originate from mountains, the aforemen-tioned differences in simulated hydrology due solely to 3-D
interactions between solar radiation and mountains merit fur-ther investigation in order to understand the implications to modeling mountain water resources and their vulnerability to climate change and air pollution.
Acknowledgements. This research was supported by the Office of Science of the US Department of Energy as part of the Earth System Modeling program through DOE Grant DESC0006742 to UCLA and separate funding to PNNL. PNNL is operated for DOE by Battelle Memorial Institute under contract DE-AC05-76RLO1830.
Edited by: Q. Fu
References
Beljaars, A. C. M.: The parameterization of surface fluxes in large-scale models under free convection, Q. J. Roy. Meteor. Soc., 121, 255–270, 1994.
Bonan, G. B.: Ecological Climatology: Concepts and Applications, Cambridge Univ. Press, New York, USA, 678 pp., 2002. Brown, R. D. and Brasnett, B.: Canadian Meteorological Centre
(CMC) Daily Snow Depth Analysis Data, Environment Canada, 2010, Boulder, CO, USA, National Snow and Ice Data Center (updated annually), 2010.
Chen, F. and Dudhia, J.: Coupling an advanced land surface – hy-drology model with the Penn State – NCAR MM5 modeling sys-tem. Part I: Model implementation and sensitivity, Mon. Weather Rev., 129, 569–585, 2001.
Chen, Y., Hall, A., and Liou, K. N.: Application of three-dimensional solar radiative transfer to mountains, J. Goephys. Res., 111, D21111, doi:10.1029/2006JD007163, 2006.
Daly, C., Neilson, R. P., and Phillips, D. L.: A statistical-topographical model for mapping climatological precipitation over mountainous terrain, J. Appl. Meteor., 33, 140–158, 1994. Dyer, A. J. and Hicks, B. B.: Flux-gradient relationships in the
con-stant flux layer, Q. J. Roy. Meteor. Soc., 96, 715–721, 1970. Fu, Q. and Liou, K. N.: On the correlatedk-distribution method
for radiative transfer in nonhomogeneous atmospheres, J. Atmos. Sci., 49, 2139–2156, 1992.
Fu, Q. and Liou, K. N.: Parameterization of the radiative properties of cirrus clouds, J. Atmos. Sci., 50, 2008–2025, 1993.
Geiger, R.: The Climate Near the Ground, Harvard Univ. Press, Cambridge, USA, 611 pp., 1965.
Gu, L., Baldocchi, D., Verma, S. B., Black, T. A., Vesala, T., Falge, E. M., and Dowty, P. R.: Advantages of diffuse radiation for terrestrial eco-system productivity, J. Geophys. Res., 107, 4050, doi:10.1029/2001JD001242, 2002.
Gu, Y., Liou, K. N., Chen, W., and Liao, H.: Direct climate effect of black carbon in China and its impact on dust storms, J. Geophys. Res., 115, D00K14, doi:10.1029/2009JD013427, 2010. Gu, Y., Liou, K. N., Ou, S. C., and Fovell, R.: Cirrus cloud
sim-ulations using WRF with improved radiation parameterization and increased vertical resolution, J. Geophys. Res., 116, D06119, doi:10.1029/2010JD014574, 2011.
Gu, Y., Liou, K. N., Lee, W.-L., and Leung, L. R.: Simulating 3-D radiative transfer effects over the Sierra Nevada Mountains using WRF, Atmos. Chem. Phys., 12, 9965–9976, doi:10.5194/acp-12-9965-2012, 2012.
Hong, S.-Y., Noh, Y., and Dudhia, J.: A new vertical diffusion pack-age with an explicit treatment of entrainment processes, Mon. Weather Rev., 134, 2318–2341, 2006.
Kain, J. S. and Fritsch, J. M.: A one-dimensional entrain-ing/detraining plume model and its application in convective pa-rameterization, J. Atmos. Sci., 47, 2784–2802, 1990.
Kain, J. S. and Fritsch, J. M.: Convective parameterization for mesoscale models: the Kain-Fritcsh scheme, in: The Represen-tation of Cumulus Convection in Numerical Models, edited by: Emanuel, K. A. and Raymond, D. J., Amer. Meteor. Soc., 246 pp., 1993.
Kapnick, S. and Hall, A.: Observed climate–snowpack relationships in California and their implications for the Future, J. Climate, 23, 3446–3456, 2010.
Koren, V., Schaake, J., Mitchell, K., Duran, Q. Y., Chen, F., and Baker, J. M.: A parameterization of snowpack and frozen ground intended for NCEP weather and climate models, J. Geophys. Res., 104, 19569–19585, 1999.
Lee, W. L., Liou, K. N., and Hall, A.: Parameterization of solar fluxes over mountain surfaces for application to climate mod-els, J. Geophys. Res., 116, D01101, doi:10.1029/2010JD014722, 2011.
Lee, W. L., Liou, K. N., and Wang, C.: Impact of 3-D topography on surface radiation budget over the Tibetan Plateau, Theor. Appl. Climatol., 113, 95–103, doi:10.1007/s00704-012-0767-y, 2012. Leung, L. R., Qian, Y., and Bian, X.: Hydroclimate of the western
United States based on observations and regional climate simu-lation of 1981–2000. Part I: Seasonal statistics, J. Climate, 16, 1892–1991, 2003a.
Leung, L. R., Qian, Y., Bian, X., and Hunt, A.: Hydroclimate of the western United States based on observations and regional climate simulation of 1981–2000. Part II: Mesoscale ENSO anomalies, J. Climate, 16, 1912–1928, 2003b.
Leung, L. R., Qian, Y., Bian, X., Washington, W. M., Han, J., and Roads, J. O.: Mid-century ensemble regional climate change sce-narios for the western United States, Clim. Change, 62, 75–113, 2004.
Lin, Y.-L., Farley, R. D., and Orville, H. D.: Bulk parameterization of the snow field in a cloud model, J. Climate Appl. Meteorol., 22, 1065–1092, 1983.
Liou, K. N., Lee, W.-L., and Hall, A.: Radiative transfer in moun-tains: Application to the Tibetan Plateau, Geophys. Res. Lett., 34, L23809, doi:10.1029/2007GL031762, 2007.
Müller, M. D. and Scherer, D.: A grid- and subgrid-scale radiation parameterization of topographic effects for mesoscale weather forecast models, Mon. Weather Rev., 133, 1431–1442, 2005. Paulson, C. A.: The mathematical representation of wind speed and
temperature profiles in the unstable atmospheric surface layer, J. Appl. Meteorol., 9, 857–861, 1970.
Qian, Y., Gustafson, W. I., Leung, L. R., and Ghan, S. J.: Ef-fects of soot-induced snow albedo change on snowpack and hy-drological cycle in western US based on WRF chemistry and regional climate simulations, J. Geophys. Res., 114, D03108, doi:10.1029/2008JD011039, 2009.
Rasmussen, R. M., Liu, C., Ikeda, K., Gochis, D., Yates, D., Chen, F., Tewari, M., Barlage, M., Dudhia, J., Yu, W., Miller, K., Arsenault, K., Grubistic, V., Thompson, G., and Gutmann, E.: Weather Support to Deicing Decision Making (WSDDM): a win-ter weather nowcasting system, Bull. Amer. Meteorol. Soc., 82, 579–595, 2011.
Skamarock, W. C., Klemp, J. B., J. Dudhia, J., Gill, D. O., Barker, D. M., Wang, W., and Powers, J. G.: A description of the Ad-vanced Research WRF Version 2, NCAR Tech. Note 468+STR, Natl. Cent. for Atmos. Res., Boulder, CO, USA, 88 pp., 2005. Skamarock, W. C., Klemp, J. B., Dudhia, J., Gill, D. O., Barker, D.
M., Wang, W., and Powers, J. G.: A description of the Advanced Research WRF Version 3, NCAR Tech. Note 475+STR, Natl. Cent. for Atmos. Res., Boulder, CO, USA, 125 pp., 2008.
Taylor, G., Daly, C., Gibson, W., and Sibul-Weisburg, J.: Digital and Map Products Produced Using PRISM, 10th Conf. on Applied Climatology, Reno, NV, Amer. Meteor. Soc., 217–218, 1997. Webb, E. K.: Profile relationships: The log-linear range and