N
o
ta
T
é
c
ni
c
a
*e-mail: [email protected] †In memoriam (02/03/2009)
APPLICATION OF CHOLESTEROL DETERMINATION METHOD TO INDIRECTLY DETECT MEAT AND BONE MEALS IN RUMINANT FEEDS
Cecília M. Bandeira* and José M. Ferreira†
Departamento de Tecnologia e Inspeção de Produtos de Origem Animal, Escola de Veterinária, Universidade Federal de Minas Gerais, 31270-901 Belo Horizonte – MG, Brasil
Gislaine C. Nogueira and Neura Bragagnolo
Departamento de Ciência de Alimentos, Faculdade de Engenharia de Alimentos, Universidade Estadual de Campinas, 13083-862 Campinas – SP, Brasil
Júlio C. C. Veado
Universidade Federal de Minas Gerais, 31270-901 Belo Horizonte – MG, Brasil Ronaldo L. Sanches
Laboratório Nacional Agropecuário – LANAGRO, Ministério da Agricultura Pecuária e Abastecimento, 33600-000 Pedro Leopoldo – MG, Brasil
Recebido em 29/11/12; aceito em 3/7/13; publicado na web em 2/8/13
The aim of this study was to verify the presence of meat and bone meal (MBM) in ruminant feed, by identifying the cholesterol using gas chromatography with a flame ionization detector. The proposed method demonstrated precision, trueness, and capability to detect MBM in the ruminant feed.
Keywords: bovine spongiform encephalopathy; cholesterol; meat and bone meal.
INTRODUCTION
Beef and dairy products are consumed all over the world. To ensure their quality and safety, several health organizations have imposed regulations on the production of beef and dairy products. These regulations include the prohibition of feeding the cattle with food that contains ruminant by-products, such as meat and bone meals or animal fat, to prevent contamination of the cattle with bovine spongiform encephalopathy (BSE), popularly known as “mad cow” disease.1–4
BSE first emerged in 1986 in the United Kingdom, and was related to the supply of cattle feed containing meat and bone meal, derived from ovine sources contaminated with scrapie, another kind of spongiform encephalopathy (SE). In humans, SE is attributed to the consumption of beef and dairy products contaminated with SRM (specific risk material) from bovines infected with PrPsc, which is a mutant protein that accumulates in the tissues of the central nervous system (CNS). SE causes fatal chronic and degenerative neurologi-cal disorder.3–7 One important way of spreading PrPsc is via cross
contamination in the slaughterhouse, where the prevalence of SRM carcass contamination can reach 68.4%. For the same reason, it is also important to prevent the disease in the cattle.8
According to the OIE (World Organization for Animal Health), there were more than 1,645 cases of BSE in the world in the last 3 years, despite all the controls that have been imposed. The commer-cial losses in the countries involved, included not only a nationwide decrease in beef consumption, but also decreased foreign trade as a result of the imposition of sanitary barriers.3 Therefore, monitoring of
the quality and origin of feed components becomes an instrumental factor in the control of BSE,6 which in turn can guarantee a totally
reliable product for the consumers d.4,9
Thus far, several methods have been proposed for the detection
of animal by-products in ruminant feed.10–19 Some are based on
im-munoassay techniques for the detection of animal protein that present a low detection limit, besides being easy to apply.12,13 Nevertheless,
in most cases, immunoassays present a cross reaction with certain compounds, yielding incorrect results or overestimating the concen-trations at the time of reading. Other methods, such as the polymerase chain reaction (PCR) for the species-specific identification of DNA have also been reported previously,14–18 using the enzyme-linked
immunosorbent assay (ELISA)20–22 or ELISA plus gas
chromato-graphy, to detect tissues from the central nervous system.23,24 The
non-chromatographic techniques present a low detection limit, but lack specificity. Furthermore, the use of heating in some of these methods leads to changes in the protein composition, which could in turn influence the results.
Microscopy is the official method currently accepted by the European Economic Community for the detection of animal by--products in ruminant feed25 and presents a low detection limit for
meat and bone meal. It is based on the morphological observation of fragments in the brute form using a stereoscopic microscope, and subsequent evaluation of the histological structure of thin particles with an optical microscope.26 However, as a result of the use of
sol-vents for sample preparation, all the lipid fractions are extracted, and hence animal fat, another prohibited component, is not identified.10,26
It has been reported that, using gas chromatography and mass spectrometry (GC/MS), CNS can be detected through markers, such as the fatty acids C22:6, C24:0-OH, C24:1 w9/ w7, C24:1 w9-OH/ w7-OH, and C24:0, since these show good thermal stability (up to and above 140 oC).19 In addition, the authors19 have compared this
method to PCR and ELISA and concluded that GCMS is more reliable in identifying traces of CNS as SRM or non-SRM.
the present study sought to validate an analytical method for the detection of meat and bone meal in ruminant feeds, by using gas chromatography to determine the cholesterol content. After verifi-cation of the control parameters of the analytical method proposed in this study, it was extended for the analysis of some commercial ruminant feeds.
The method proposed in this study is precise, reliable and is capable of detecting meat and bone meal in ruminant feed, indirectly from the presence of cholesterol at concentrations above 0.025 mg g−1 in the feed.
EXPERIMENTAL
Samples
A control sample of ruminant feed was obtained by a process free of animal by products, composed of soybean meal (15%), wheat bran (15%), corn grits (40%) and oats (30%). Each of these ingredients was also analyzed separately for its cholesterol content. A sample of bovine meat and bone meal containing 35% crude protein was also used, and added to the feed at concentrations of 3%, 4%, 5%, and 6%. Both the ruminant feed and the meat and bone meal were acquired from the National Agricultural Laboratory (Campinas, SP, Brazil), and were used to validate the method.
32 commercial feed samples for ruminants were obtained from stores in the city of Campinas (SP, Brazil), which contained mainly soybeans, corn and wheat. The samples were identified, homogenized, quartered, ground in a multiprocessor, and stored in a refrigerator, for analyzing the cholesterol content later.
Chemicals and reagents
All the solvents used for sample preparation were of analytical grade (Synth, SP, Brazil) and of chromatographic grade (JT Baker, Phillipsburg, NJ, USA) for the chromatographic analyses, and were filtered through a 0.45 µm organic filter (Millipore, Cork, Ireland) in vacuum system before use. High purity gases (5.0) were used throughout the experiment.
The cholesterol (C8667, > 99%), stigmasterol (S2424, 95%), and b-sitosterol with campesterol (S5753, ≥ 40%) standards were purchased from Sigma-Aldrich Chemical Company (St. Louis, MO, USA). Stock solutions were prepared with hexane at a concentration of 0.1 mg mL−1. Intermediate solutions at concentrations of 0.05 and
0.025 mg mL−1 were prepared from the respective stock solutions,
and refrigerated at −18 °C.
Sample preparation
The method adopted for the determination of the cholesterol content was previously optimized using an experimental design27
and involved the following steps: 1) saponification of the sample, 2) extraction of the unsaponifiable components with hexane, and 3) determination of cholesterol by gas chromatography.
Evaluation of the quality control parameters and application of the method
To apply the method, the analytical quality control parameters, such as linearity and the matrix effect, specificity, equipment detection and quantification limits, the detection limit of the method, precision, trueness, and robustness, were initially evaluated using the choles-terol standard, control ruminant feed samples, meat and bone meal samples, control samples with added meat and bone meal (3%, 4%,
5%, and 6%), and control samples with added cholesterol standard. The cholesterol was quantified using an external calibration curve with 5 points ranging from 0.01 to 0.1 mg mL−1, each concentration
being injected in triplicate. After verifying these parameters, the cholesterol contents of the 32 commercial samples of ruminant feeds were analyzed, with triplicates for each sample.
Linearity
Linearity and the matrix effect were verified by determining the coefficients (R2) of the linear regression curve for the cholesterol
standard and the ruminant feed with 5 concentrations of the cho-lesterol standard (from 0.01 to 0.1 mg mL−1) in random order, and
triplicating for each concentration. A regression analysis was carried out from the data independence and residue values. The mean values for the concentrations were obtained, and the difference between the observed and expected values were calculated. The slope and intercept values of the curves were compared using the t-test, and hypotheses tested at a level of a = 0.05.
Specificity, trueness, and precision
To confirm the identity of the cholesterol, the samples were injected into a Shimadzu (Kyoto, Japan) HPLC chromatograph equipped with quaternary pumps (LC-20AD) and a degasser unit (DGU-20A5), connected in series to a photodiode array detec-tor (PDA) (SPD-M20A) and to a mass spectrometer (MS) from Bruker Daltonics (Esquire 4000 model, Bremen, Germany), with an atmospheric pressure chemical ionization source (APCI) and an ion-trap analyzer. The analytical column was a 4 µm (Chromolith, Merck, Darmstadt, Germany) particle size column of dimension 100 mm x 4.6 mm, with a C18 stationary phase. The mobile phase was
acetonitrile:isopropanol (98:02) at a flow rate of 1 mL min−1. The MS
parameters were fixed as follows: positive mode; source temperature, 400 °C; corona, 4000 nA; dry gas (N2) 300
°C, 5 L min−1 flow and 65
psi nebulizer; scan range from 80 to 700 m/z. The MS spectra of the samples were compared with the MS spectra of cholesterol standards at the corresponding retention time and also compared with the MS spectral data reported in the literature.28,29 The range of mass spectra
(m/z) obtainment was from 100 to 700.
The trueness of the method was evaluated from the recovery values of the ruminant feed samples, to which the cholesterol stan-dard at concentrations ranging from 0.01 to 0.1 mg mL−1 was added
before extraction, with 6 independent replicates for each concentra-tion. Values between 80% and 110% were considered acceptable.30
In-house precision was assessed using the relative standard devia-tion of the ruminant feed samples containing cholesterol standard at the same concentrations and number of replicates employed for the determination of trueness. The obtained coefficients were considered acceptable according to the equation: CV = 2 (1 - 0.5 log C), using mg g−1, below 14.7%.31
Detection and quantification limits
The equipment detection limit was determined from the lowest concentration analyzed (cholesterol peak height was 3 times the noi-se), and six more injections were made at the lowest concentration. The measurement limit of the equipment was considered to be the value corresponding to 3 times the limit of detection, at which the precision and trueness were obtained.32 The detection limit of the
method was determined by adding meat and bone meal to the ruminant feed at concentrations of 3 to 6%, with triplicates, and additional 7 injections made for the concentration of 3%.
Robustness
parameters: 1) extraction of unsaponifiable components using a solvent (hexane), different from the one used during the validation procedures; 2) contact time of the solvent (hexane) with the sample during the extraction of unsaponifiable material, 3) injection of the sample into the chromatograph using syringe, different from that used during the validation procedures, although of the same brand and volume; 4) injection of the samples before cleaning the insert (immediately before exceeding the maximum number of injections per insert); 5) injection of samples after cleaning the insert (immediately after cleaning with appropriate solvents); 6) injection of samples into the chromatograph after storing 10 days in a refrigerator. The samples were stored dry for 10 days, and, on the day of the analysis, they were diluted with the solvent for injection and ultrasonicated for 1 min to ensure.
Three samples were prepared for the evaluation of parameters 1, 2, and 6, and each sample was analyzed individually. One sample was prepared to evaluate parameters 3, 4, and 5, and was analyzed in triplicate.
The statistical models used for the data analysis of robustness were the comparison of pairs and the differences between means, which were compared by the Student’s t-test, with a confidence level of 95%.31
Gas chromatography
For the analysis of the samples, Shimadzu (Tokyo, Japan) gas chromatograph (GC, model GC-2010) was used with a flame ionization detector (FID), 0.25 µm analytical column of dimen-sion 30 m x 0.25 mm containing a polyethylene VA-WAX (Varian, San Diego, CA) stationary phase, and appropriate software (GC Solution). Hydrogen was used as the carrier gas, while nitrogen was employed as the make-up gas. Compressed air was used as the carburant. The ratio of the flow rates of N2, H2, and synthetic
air was 30:40:400 mL min−1. The gas chromatographic conditions
used in this study were set as follows: injector temperature of 260
°C; splitless mode; injection volume of 1 µL; column flow rate of
1.68 mL min−1; initial column temperature of 100 °C for 2 min,
which was later increased to 260 °C at a rate of 15 °C min−1 and
maintained at that temperature for 48 min. The FID temperature was 300 °C.
The cholesterol was identified by a comparison between the re-tention times of the cholesterol standard and that of the sample, and by co-chromatography. Quantification was performed by external standardization.
RESULTS AND DISCUSSION
Figure 1 shows the GC-FID chromatogram of the control ruminant feed sample. As evidenced from the figure, cholesterol, campesterol, stigmasterol, and b-sitosterol are present in the rumi-nant feed. However, only cholesterol was quantified. The presence of phytosterols in the ruminant feed was expected, as it is an important constituent in corn, soybean and wheat.27 Using a polar
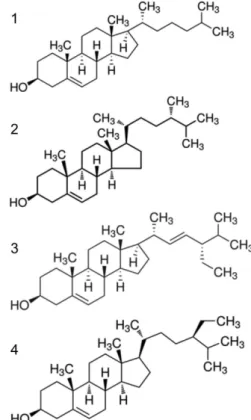
column (polyethyleneglycol), the retention times of cholesterol, campesterol, stigmasterol, and b-sitosterol, were determined to be 31.9, 36.2, 38 and 41 min, respectively. The corresponding struc-tures of cholesterol, campesterol, stigmasterol, and b-sitosterol, are shown in Figure 2.
Before validating the method, the results obtained were analyzed using a factorial experimental design27 to optimize the procedures,
considering peak cholesterol resolution, better efficiency to determine the cholesterol content, and less interference from sterols and solvents. After optimization the results were validated.
Quality control parameters
Linearity
The linear analytical curve was constructed between the concen-trations of 0.01 to 0.1 mg mL−1. The determination coefficients (R2)
present values greater than 0.99, while the residual values range from −0.002 to 0.006, being very close to zero. No outlier point could be detected in the cholesterol standard curve determined by the Jacknife test, or in the curve of the control sample (matrix) with added cho-lesterol standard. The independence of the residues was confirmed by Durbin Watson statistics for both curves, with values of 2.48 and 2.78, respectively (α > 0.05).
Figure 1. GC-FID chromatogram of the control ruminant feed sample, polar column (polyethyleneglycol), mobile phase: hydrogen. Chromatographic conditions: see text. Peaks: (1) cholesterol; (2) campesterol; (3) stigmasterol; (4) b-sitosterol
The intercepts of the curves were statistically different from zero. No noticeable difference between them could be observed (α > 0.05), although a difference was observed in the slope, indicating the matrix effect. The standard curves and matrix equations were: y = 0.8543x + 0.0024 and y = 0.8411x + 0.0098, respectively. Based on these re-sults, it can be concluded that the standard cholesterol curve exhibits a different signal from that of the matrix curve, containing the same cholesterol concentration. This fact signifies that it is necessary to use the curve constructed on the matrix to calculate the concentrations in ruminant feed. Considering the wide variety of ruminant feeds available, it is important to evaluate each individual case to test the matrix effect separately.
Specificity, trueness and precision
The specificity was confirmed by HPLC-APCI-MS/MS via the most intense m/z ion (369), which corresponds to a loss of hydroxyl groups from the protonated cholesterol molecule.28,29 The presence of
cholesterol in the control samples of ruminant feed is in agreement with the results reported previously in the literature,33–37 that some
plants produce small quantities of cholesterol. Earlier, it was concep-tualized that plant products do not contain cholesterol, partly due to the low concentrations of cholesterol present in those products, and also due to the lack of efficient analytical detection methods, which were not well developed until recently.27,37
Corn grits, soybean meal and wheat bran were used to make the ruminant feed control sample. These components were analyzed separately, to determine the cholesterol content in each of them, and their contribution to the total cholesterol content. The cholesterol concentrations were found to be 0.020 mg g−1 in the corn grits and
soybean meal, while that in the wheat bran was estimated to be 0.021 mg g−1.
The recovery values ranged from 84.0% to 86.7%,27 in the samples
spiked with the cholesterol standard, and the relative standard devia-tions varied from 2.9% to 4.0%,27 values within acceptable limits.30
Detection and quantification limits
All the cholesterol standard samples analyzed in this study indi-cated a concentration of at least 0.001 mg g−1. Therefore, this level
was established as the detection limit of the equipment, for the signal/ noise ratio ≥ 3 criterion. The measurement limit of the equipment was 0.003 mg g−1.
Due to the presence of cholesterol in the ruminant feed samples and the reflection of these results on the matrix effect, the criterion was adopted to determine the limit of the quantification method in the curve, up to the point where it intercepts the x-axis (in the direction of the negative x axis, but considering its absolute value). Thus, the concentration determined by the interception of the curve on the x--axis indicates the concentration of cholesterol present in the sample of ruminant feed, irrespective of the concentration of cholesterol standard added. Accordingly, the concentration of cholesterol in the ruminant feed is estimated to be 0.021 mg g−1, considering 0.024
mg g−1 as the limit of the method, which corresponds to the addition
of 3% meat and bone meal to the ruminant feed. To confirm these results, feed samples with the addition of 3%, 4%, 5%, and 6% of meat and bone meal were analyzed. The corresponding cholesterol concentration is found to be 0.024, 0.028, 0.032, and 0.036 mg g−1,
respectively, and the mean concentration in the meat and bone meal itself is 0.40 mg g−1.
According to the descriptive statistical analysis, the samples present homogeneous results, verified by the low values for the standard deviation and relative standard deviation, which varied from 3.4% to 4.9%, still remaining within the recommended range (< 14.7%).
The official method to determine animal by-products is micros-copy.25 The work developed by Sanches10 validated the microscopy
method, which showed a detection limit of 0.05% for meat and bone meal in the ruminant feed. On the other hand, using PCR, Brodman and Moor11 demonstrated a detection limit of 1% for
the same component. However, the PCR technique promotes the denaturation and degradation of proteins, which can cause changes in the final results.
Robustness
The results evaluating the robustness of the method were sub-mitted to a paired t test with a two-tailed probability of error. It was verified that no significant difference is observed (α > 0.05) upon changing the brand of hexane. Likewise, the stirring time of the samples in the vortex (15 s to 1 min) was not significant for a confi-dence interval of difference ranging from −0.002082 to −0.002672 and 0.002555 to 0.003065, respectively. However, when the syringe used to inject the samples was changed, a significant difference was found, with α > 0.05 (0.0003789 to 0.007434).
The conditions used to clean the insert (for the injection of the samples) did not interfere with the results (α > 0.05). This parameter was used to evaluate the equipment, as the device alerts a warning signal to clean the sample injection insert. According to the results, this cleaning procedure could have been carried out after a significant number of injections under the conditions tested.
Immunoassay techniques are capable of detecting even small quantities of animal protein and are easy to apply. Nevertheless, they can present cross-reactions, resulting in false-positive results. Other methods, such as PCR using ELISA20–22 or using ELISA and
gas chromatography, present low detection limits for the detec-tion of tissues from the central nervous system,23,24 but have no
specificity.
On the other hand, microscopy presents a low detection limit to identify the presence of meat and bone meal in ruminant feed. However, due to the use of solvents during sample preparation, all the lipid fractions are extracted. This makes it impossible to identify the animal fat, which is another prohibited component.
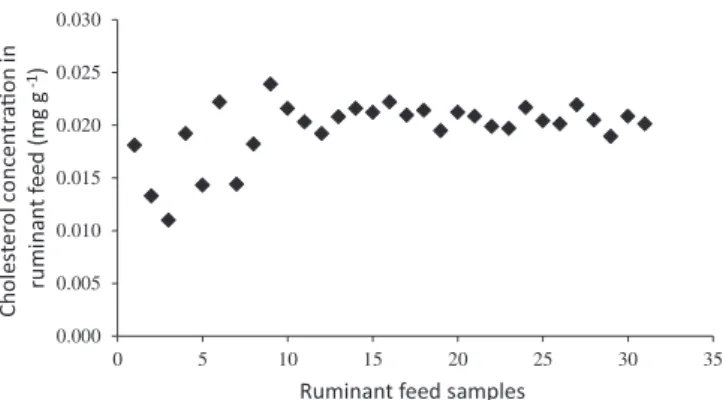
In the 32 commercial ruminant feed samples analyzed in this study, the cholesterol concentrations ranged from 0.011 to 0.024 mg g−1 of feed (Figure 3), thus remaining below the legal limit
of 0.024 mg g−1. This result indicates that the origin of the cholesterol
could not be confirmed up to this value, immaterial of whether it is from animal or vegetal sources.
Upon analyzing the presented scatter plot, we could observe significant variation in the results for the first 10 samples, since they were from different brands. Whereas, the samples that followed were from the same supplier, but from different batches.
CONCLUSIONS
The chromatographic method proposed in this study demonstrates precision, trueness and the ability to detect meat and bone meal in ruminant feed, indirectly from the presence of cholesterol.
REFERENCES
1. WHO. 1996. Report of a WHO consultation on public health issues related to human and animal transmissible spongiform encephalopathies. With the participation of FAO and OIE in World Health Organization. Geneva, Switzerland.
2. FAO. Animal Feeding and Food Safety, FAO: Italy, 1998.
3. http://www.oie.int/fileadmin/Home/eng/Media_Center/docs/pdf/ Disease_cards/BSE_ EN.pdf. Acessed in November 2012.
4. Ryan, E.; McGrath, G.; Sheridan, H.; More, S.J.; Aznar, I.; Prev. Vet. Med.2012, 105, 75.
5. Prusiner, S. B.; Science1997, 278, 2458.
6. Salman, M.; Silano, V.; Heim, D.; Kreysa, J. Prev. Vet. Med. 2012, 105, 255.
7. http://www.who.int/topics/encephalopathy_bovine_spongiform/en/. Acessed in November 2012.
8. Pitardi, D.; Meloni, D.; Maurella, C.; Di Vietro, D.; Nocilla, L.; Piscopo, A.; Pavoletti, E.; Negro, M.; Caramelli, M.; Bozzetta, E.; Food Control 2013, 30, 668.
9. Kusama, T.; Hibino, H.; Onodera, T.; Sugiura, K.; Veterinaria Italiana 2009, 45, 287.
10. Sanches, R. L.; Alkmin-Filho, J.; Souza, S. V. C.; Junqueira, R. G.; Food Control 2006, 17, 85.
11. Brodman, P. D.; Moor, D.; Meat Sci. 2003, 65, 599.
12. Ansfield, M.; Reaney, S. D.; Jackman, R.; Food and Agricultural Im-munology2000, 12, 285.
13. Hammon, A.; Duthorn, T.; Bauerlein, R.; Becker, C.M.; Pischetsrieder, M.; Pichner, R.; Gareis, M.; Arch. Lebensmittelhyg. 2007, 58, 214. 14. Bellagamba, F.; Moretti, V. M.; Comincini, S.; Valfre, F.; J. Agric. Food
Chem. 2001, 49, 3775.
15. Kingombe, C. I. B.; Lüthi, E.; Schlosser, H.; Howald, D.; Kuhn, M.; Jemmi, T.; Meat Sci. 2001, 57, 35.
16. Krcmar, P.; Rencova, E.; J. Agric. Food Chem. 2003, 51, 7655. 17. Fumière, O.; Dubois, M.; Baeten, V.; von Holst, C.; Berben, G.; Anal.
Bioanal. Chem. 2006, 385, 1045.
18. Frezza, D.; Giambra,V.; Chegdani, F.; Fontana, C.; Maccabiani, 353
G.; Losio, N.; Faggionato, E.; Chiappini, B.; Vaccari, G.; von Holst, C.; Lanni, L.; Saccares, S.; Ajmone-Marsan, P.; Innovative Food Sci. Emerging Technol. 2008, 9, 18.
19. Lücker, E.; Biedermann, W.; Alter, T.; Hensel, A.; Anal. Bioanal. Chem.
2010, 398, 963.
20. Simon, S.; Nugier, J.; Morel, N.; Boutal, H.; Creminon, C.; Benestad, S. L.; Andreoletti, O.; Lantier, F.; Bilheude, J. M.; Feyssaguet, M.; Biacabe, A. G.; Baron, T.; Grassi, J.; Emerg. Infect. Dis. 2008, 14, 608. 21. Yamamoto, T.; Ushiki, Y.; Hara, S.; Hall, W. W.; Tsukagoshi-Nagai, H.;
Yokoyama, D. T.; Tagawa, Y.; Sata, T.; Yamakawa,Y.; Kinoshita, N.; Tamura, F.; Hattori, S.; Irie, S.; J. Virol. Methods 2008, 149, 316. 22. Fumière, O.; Veys, P.; Boix, A.; von Holst, C.; Baeten, V.; Berben, G.;
Biotechnol. Agron. Soc. Environ. 2009, 13, 59.
23. Niederer, M.; Bollhalder, R.; Mitt. Geb. Lebensmittelunters. Hyg. 2001,
92,133.
24. Griessbach, M.; Baumann, D.; Biedermann,W.; Krex, C.; Kunath, O.; Truyen, U.; Lücker, E.; Arch. Lebensmittelhyg. 2008, 58, 208. 25. Association of Official Analytical Chemists - AOAC. Official method
964.07. Microscopy of animal feed, 1998.
26. Commission of the European Communities. Off. J. Eur. Union. 2003, L 339, 78.
27. Bandeira, C. M.; Ferreira, J. M.; Bragagnolo, N.; Mariutti, L. R. B.;
Quim. Nova. 2008, 31, 1422.
28. Mazalli, M. R.; Sawaya, A. C. H. F.; Eberlin, M. N.; Bragagnolo, N.;
Lipids2006, 41, 615.
29. Saldanha, T.; Sawaya, A. C. H. F.; Eberlin, M. N.; Bragagnolo, N.; J. Agric. Food Chem. 2006, 54, 4107.
30. Commission of the European Communities. Off. J. Eur. Commun. 2002,
L 221, 8.
31. A laboratory guide to method validation and related topics. EURACHEM: Teddington, 1998.
32. Montgomery, D.C.; Design and analysis of experiments, 5th ed, John Wiley & Sons INC: New York, 2001.
33. Rossell, J. B. In Vegetable oils and fats; Pritchard, J. R. ed.; Elsevier: New York, 1991.
34. Ballesteros, E.; Gallego, M.; Valcarcel, M.; J. Chromatogr. A1996, 719, 221.
35. Toivo, J.; Piironen, V.; Kalo, P.; Varo, P.; Chromatographia1998, 48, 745.
36. Phillips, K. M.; Ruggio, D. M.; Toivo, J. I.; Swank, M. A.; Simpkins, A. H.; J.Food Compos. Anal. 2002, 15, 123.