Bolm Inst. oceanogr., S Paulo,
33(1):29-38, 1985
ESTIMATE OF EXPLOITATION RATES AND POPULATION SIZE OF SKIPJACK TUNA
OFF THE SOUTHEASTERN COAST OF BRAZIL
Silvio JABLONSKI 1
&
Yasunobu MATSUURA21 Superintendência do Desenvolvimento da Pesca (SUDEPE), Coordenadoria Regional do Rio de Janeiro
2 Instituto Oceanográfico da Universidade de são Paulo
Synopsis
Size eorrrpositions and total landings of skipjaek tuna eaught in the southeastern Brazilian waters by bait-boats are used as the basis of the assessment of the population for 1980-1983 period, employing the length eohort analysis and virtual population analysis. From monthly size frequeney data it is suggested that there is eonstant immigration and emigration of different modal groups in the fishing area with an ~nteY'Val of two to three months. The exploitation rate was very low for
length elass between 35-45 em FL, then increased gradually. The weighted mean exploitation rates were 0.060 and 0.448, respectively for length classes smaller and larger than 55 em FL. The estima_te of the average number of fish attaining a size of 43 em FL (recruitJ was 11.0 x 10⁶ fish for assumed values of M
=
0.7 andK
=
0.307. Increasing the fishing mortality rate by 30% and 50%, an estimated increment in yield is 8% and 12%, respectively. From virtual population analysis, we obtained the biomass estimate of skipjack population older than two years-old to be 70.3 thousand tonnes for assumed value of M=
0.7 and the estimated MSY was 24.6 thousand tonnes.Descriptors: Biomass, Recruitment, Exploitation, Stock assessment, Potential yield, Commercial fishing, Continental shelf break, Pole-line fishing, Kat4uwon~ petam~, Scombridae, SW Atlantic, Southern coast: Brazil, Descritores: Biomassa, Recrutamento, Explotação, Estimativa do estoque, Rendimento
potencial, Pesca comercial, Borda da plataforma continental, Pesca com I inha/isca-viva, Kat4uwon~ petam~, Scombridae, Atlantico Sul Ociden-tal, Costa sul: Brasi I, Costa sudeste: Brasi I.
Introduction
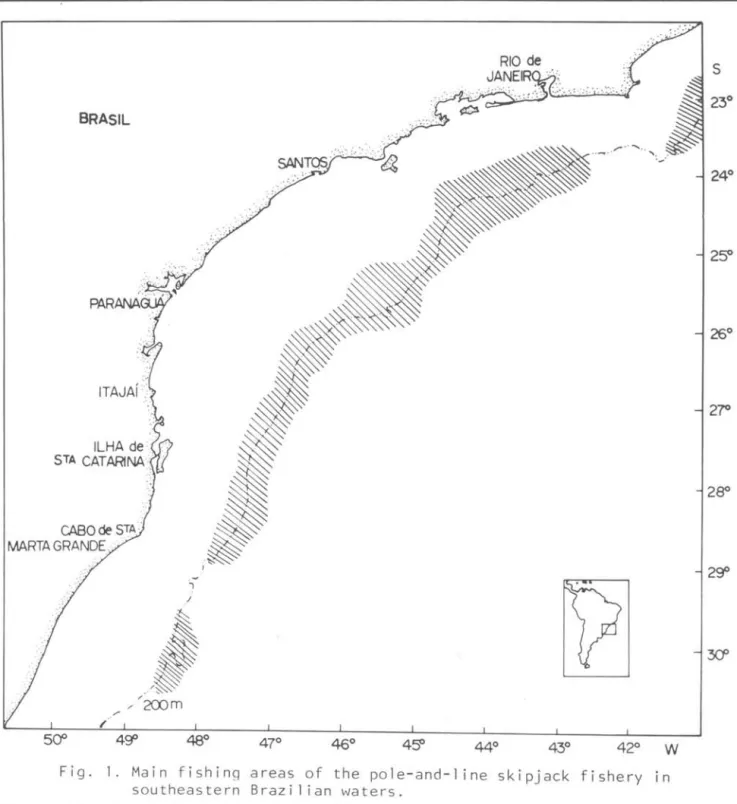
A bait-boat fishery for skipjack tuna (Kat4uwon~ pe1.am~) in Brazil began in 1979 and now involves several tens of bait-boats adapted from-other fishing boats (Matsuura, 1983a). They operate
in the open sea along the edge of the continental shelf off southeastern Brazil from Cape são To~é (22°S) to the south of Cape Santa Marta Grande
(28°30' S) (Fig. 1).
The number of bait-boats increased rapidly from seven in 1979 to near1y 100 in 1981-82, decreasing to 60 during 1983. The bait-boat catch has increased from 1,850 tonnes (t) in 1979 to about 18,000 t in 1982. The estimated catch in 1983 wi11 be about 15,500 t.
*
SUDEPEPraça XV, no. 2 - 39 ando 20.010 - Rio de Janeiro, RJ.
Publ. n.
613do
I~t. o~eanog~.da
U~p.Because the bait-boat fishery in Brazi1 started recent1y, there is 1ittle information on the biology of skipjack tuna in this area. Most of the
information avai1ab1e was co11ected during the Internationa1 Skipjack Year Program organized by the Internationa1 Commission for the Conservation of At1antic Tunas (ICCAT). For examp1e, Cayre & Farrugio (1983), Go1dberg & Au
(1983) and Jab10nski e;t
ai.
(1983)studied the sexual maturity and spawning of skipjack tuna off the southeas t ern Brazi1ian coast. Matsuura (1982;
1983b) studied skipjack 1arva1 abundance
in the western central At1antic . An ana1ysis of skipjack tuna stomach
contents was carried out by Ankenbrandt (1983) and those of predator fish preying on skipjack was made by Zava1a-Camin (1982; 1983).
30 Bolm Inst. oceanogr., S Paulo, 33(1) , 1985
S
BRASIL
2SO
26°
2?O
2SO
2~
50" 4~ 48° 44°
w
Fig. 1. Main fishing areas of the pole-and-l ine skipjack fishery in southeastern Brazil ian waters.
>
study the state of Atlantic skipjack stocks, using data taken from both the eastern and western Atlantic. For the eastern Atlantic population he
calculated the vectors of the coefficient of fishing mortality (F) using two
hypotheses of constant recruitment, i.e. moderate and low exploitation leveIs. For the western Atlantic population the same author combined data from the Brazilian bait-boat fishery in 1980-1981 with those taken from the Caribbean Sea by the United States and Cuban boats since 1973. Neither biomass nor fishery
potencial estimates were made for the western Atlantic population.
The present paper estimates annual recruitment and total biomass of the exploited stock of skipjack tuna in the actual fishing area of the Brazilian bait-boats.
Material and methods
JABLONSKI & MATSUURA: Exploitation: PopuJation size: Skipjack tuna
3 )
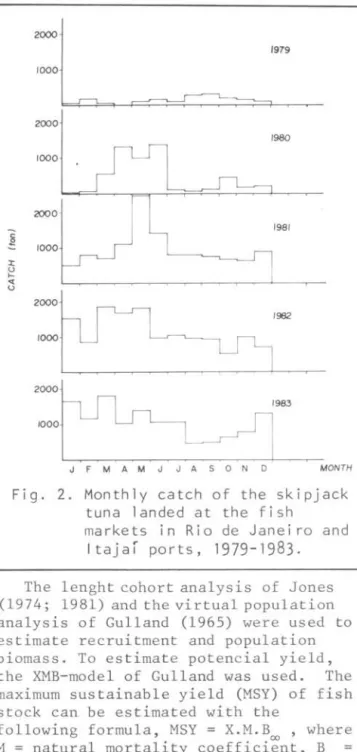
August 1983. Figure 2 shows monthly catches of skipjack tuna from 1979 to 1983 inclusive. The total number of skipjack tunas measured was 27,650. To cover alI the fishing areas, an attempt was made to obtain the maximum number of samples from commercial boats each month. The total catch of skipjack tuna was obtained from the landing control system of the SUDEPE (Superintendência do Desenvolvimento da Pesca), including both the Rio de Janeiro and Itajai fish markets.
1979
2000
1980
1000
2000
1000
: ~~'9S2
2000~
,~1000~
J F M A M J J A S o N D MONTH
Fig. 2. Monthly catch of the skipjack tuna landed at the fish
markets in Rio de Janei ro and Itajaí ports, 1979-1983.
The lenght cohort analysis of Jones (1974; 1981) and the virtual popu1ation analysis of Gu11and (1965) were used to estimate recruitment and population biomass. To estimate potencial yield, the XMB-model of Gulland was used. The maximum sustainab1e yield (MSY) of fish
stock can be estimated with the
following formula, MSY = X.M.Boo ' where
M = natural mortality coefficient, Boo =
bio~ass of virgin stock, and X
=
constant. In this paper, the constant X = 0.5 was applied.
Population parameters of skipjack tuna were taken from other papers
presented in the proceedings of the Internacional Skipjack Year Program o The following paramet~ were used: 1) Natural mortality coefficient:
M = 0.6 - 0.8 ... Fonteneau (1983) 2) Length-weight relationship:
W
=
7.48 X 10- 6 x L3.2526 ..•... ... ... Cayre & Laloe (1983),where W
=
weight in kg and L=
fork length in cm.3) Von Bertalanffy growth curve constants:
L 00 86.7 cm, K
=
0.307and to
=
-0.317 . . . •... Chur
et
alo (1983).For comparative purpose, another value of K obtained from tagging data was used:
K
=
0.322 Bard & Antoine (1983).The method used to estimate numbers of skipjack tuna caught in each length class was similar to that described by Jones (1979) and to estimate the mean weight at each length class, the
equation presented by Cayre & Laloe (1983) was used.
Using the length frequency data taken at the Rio de Janeiro fish market and catch data from all fishing areas, estimates of the numbers landed in each length class have been made for each year and then the average number of fish for the four year period was
calculated (Table 1). Length frequency data from 10 and 8 month periods were used for 1980 and 1983, respectively.
A cohort analysis of the length composition data has been carried out using the method described by Jones
(1974; 1981). Because we have a probable range of natural mortality coefficients (M = 0.6 - 0.8) and two
estimates of growth coefficients (K
=
0.307 and 0.322), various combinations of these parameters were used. The southern Brazilian skipjack fishery was commenced recently, therefore we chose, as input data, some relatively low values of the rate of exp1oitation
32 Bolm Inst. oceanogr., S Paulo, 33(1), 1985
Table 1. Estimated number (i n thousands) difference between results obtained assuming different exploitation rates, only the results obtained from the
lowest· exploitation rate, i.e.
Fiz
0.4, are given here. For each
combination of the values of M and K, of skipjack tuna caught annua 1I y
in southeastern Brazilian coast for the peri od 1980-1983
Year
1983
Lenlth ela . . (CIII) 1980 1981 198 2 we calculated the following information:
35 - 3 7 31 - 39 39 - 41
41 - 4 3 1. 38
4 3 - 45 2.7 6 9. 17 12.22
4 5 - 4 7 16 .56 36 . 68 28 .51
4 7 - 49 27. 61 94.11 105.9 1
49 - 51 26 .23 168 . 14 236 .27
5 1 - 53 6 3 . 50 302 . 65 354 . 41
53 - 55 6 3 . 50 31 4 . 88 492 . 91
55 - 51 122 .86 29 3 . 48 52).50
57 - S9 19 6 .0 2 253 . 1) 521.43
59 - 6 1 27 1. 95 34 5.45 476.62
61 - 63 207.07 363.79 )54.41
6 3 - 65 142. 18 299 . 59 305.52
6 5 - 67 110.43 247 . 62 256.64
6 7 - 69 64.88 140.62 211. 8)
69 - 11 4 1. 41 64 .20 1 18.13
7l-7J 19.33 39 . 74 48.88
73 - 7S 4.14 30 . 57 16.29
7S - 77 )).63 8. 15
77 - 79 12 . 2)
79 - 81 3.06
81 - 83 1. 38
Total lJ83.19 3054. 0 0 407).63
1980
..
:1
JAN:1
FEB MAR1
MAR APR1
APR MAY 10 10ZO JUN
10
JUl
~
j
JUlAUG j AUG 10 SEP j SEP ZO 10
:1
ocrLS
I
ocr:j
NOV~
LNOV
:]
DECx
~
I
DEC40 !lO 00 10 <o
7. 64 1.91
26 . 74 6.69
15 . 28 3 .8 2
7.6 4 2 . 26
14.4 2 10. 81
16. 39 39 .54
119.52 101.95
31 3.20 185. 96 44 3.07 290 . 91 488 .90 )40 . 05 492 . 72 358 . 64 427 . 19 349.74
370.50 366. 13
275.01 300. 0 7 179 . 52 23 1. 70 141. )2 189. 00
125.0 5 135.85
106 . 9S 82.67
61. 11 42.27
26 . 74 19. 44
15 . 28 14.27
11.46 5.92
7 . 64 2.68
0.35
381Q.55 3082.63
1981
~
N.'"~
~ N.~L-l
~
L1
~
1) values of the exploitation rate for each length class,
2) estimates of annual recruitment of fish attaining 43 em FL,
3) biomass of skipjack stock 1n the area.
For application of the length cohort analysis and virtual population analysis, the Burrough B-6900 computer in the computer center at the University of são Paulo was used.
Results
Analy~~
On
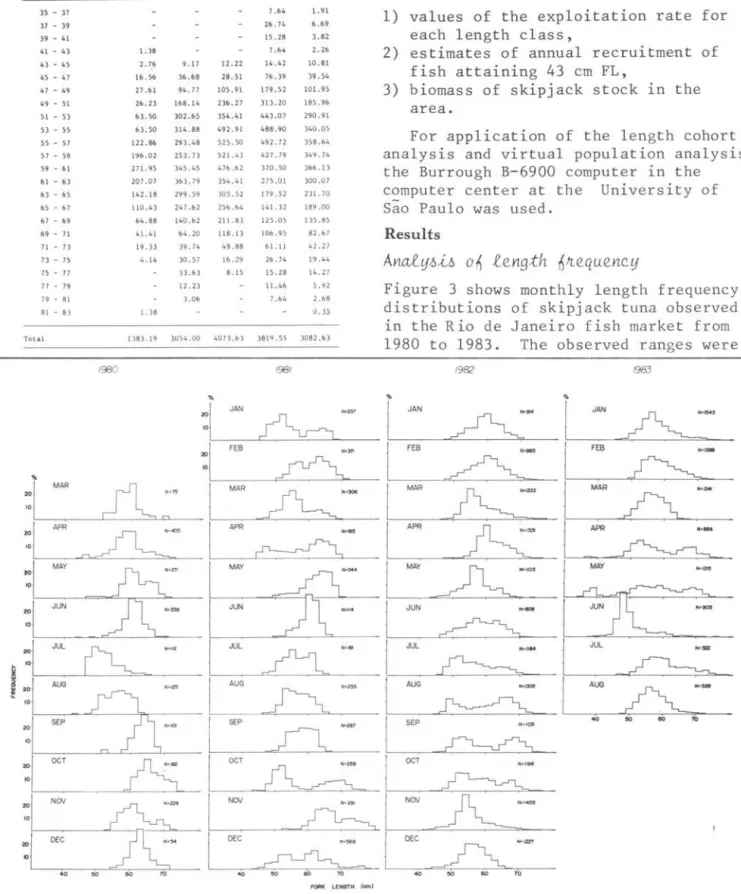
l~ng~h 6~~qu ~ ncyFigure 3 shows monthly length frequency distributions of skipjack tuna observed in the Rio de Janeiro fish market from 1980 to 1983. The observed ranges were
1982 1983
..
..
I
JAN ~ ~ 1JAN
~ ~
1
j
j
FEB N·'"
]
FEB N·'"
~
~
MAR
~
O»
j
MAR
~
APR
~
jAPR
~
j
MAY
~ ~ '~ ' MAY
j
j
JUN
~
JUl JUl N·'"
~
~
j
j
AUG AUG
~
..
-~
SEP 40 !lO 10 li>
~
j
ocr H- fiM
~
~j
~j
NOV~
'~
DEC~
!lO 60 10 <o !lO 60 70
FORK LENGTH {emJ
JABLONSKI
&
MATSUURA: Exploitation: Population size: Skipjack tuna33
42-82 em FL in 1980, 43-79 em FL in 1981 and 41-78 em FL in 1982. In 1983 many speeimens smaller than 40 em FL appeared during the period April-June and the observed range was 34-79 em FL. The total number of skipjaek tuna measured was 27,650, ranging from 34 em to 82 em FL with a mean length of 58.3 em FL.
The ehanges observed in the monthly length frequeney distributions failed to show any regularity in progressive growth of eaeh modal group and there was no definite periodieity in the appearanee of new modal groups,
suggesting eonstant ingress and egress of different modal groups of fish in the fishing area. In this figure we ean follow the presenee of the same modal group for two to three months, after whieh they were replaeed by another modal group.
E-6thnatu
06
Jtate
06
exptoda,UoYl
Values of the rates of exploitation
(FiZ)
for eaeh length elass have beendetermined by length eohort analysis using the average numbers of fish landed over the four year period (Table 2). We ean see that the exploitation rate deereases with an inerease in the assumed values of M/K.
Table 2. Values of the rate of exploitation (FIZ) using
the length frequency distribution of skipjack tuna for the per i od
1980-1983
M - 0.6 H-O. 7 H • 0 .8
Length e la .. K- O . )07 K- 0.322 K- 0.307 K- 0.322 K- O. )07 K- 0.322
(e m)
35 - 37 0.002 0.002 0 .001 0.002 0.001 0.001
31 - 39 0.008 0.008 0.005 0.006 0.003 0.004
l' - 4l 0.004 0.005 0.003 0.003 0 . 002 0 . 002
41 - 43 0.003 0.003 0.002 0.002 0.001 0 .00 2
43 - 45 0.014 0.015 0.010 0.011 0.007 0 . 008
45 - 47 0.051 0.056 0.036 0.041 0.026 0.030
47 - 49 0.127 0.D8 0.095 0.105 0.070 0,079
49 - 51 0.222 0.239 0.172 0.188 0.131 0.14b
5l - 53 O. ))0 0.350 0.266 0 . 286 0.210 0.231
5) - 55 0.394 0.415 0.326 O. )48 0.264 0.288
55 - 57 0.443 0 .464 0.374 0.397 0 . )10 0 . )34
57 - 59 0.481 0.502 0.412 0.435 0.347 O. )72
59 - 61 0.547 0.567 0.479 0 .502 0.412 0.4)8
6l - 63 0.563 0 .58 ) 0.496 0.519 0.4)0 0.456
63 - 65 0.573 0.592 0.507 0.529 0.442 0.468
65 - 67 0.608 0.626 0.544 0.565 0.479 0.504
67 - 69 0.629 0.646 0 .56 5 0.587 0.501 0.526
69 - 7l 0.626 0.644 0.562 0.583 0.497 0.522
7l -7J 0.590 0.609 0.524 0.546 0.459 0.484
7J - 7S 0.526 0.545 0.460 0.482 0.399 0.422
7S - 7) 0.594 0.612 0.5)) 0.554 0.475 0.497
7) - 79 0.571 0.588 0.514 0.533 0.460 0.481
79 - 81 0.624 0.638 0.578 0.59) O. \l5 0.551
M/K 1.954 1.86) 2.280 2.174 2.606 2.484
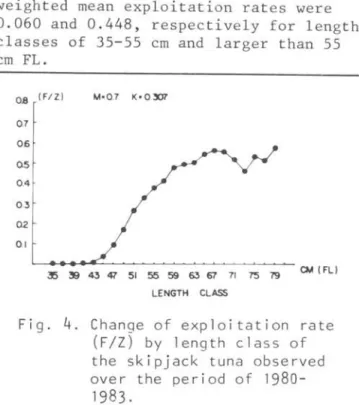
The exploitation rate at eaeh length for an intermediate value of M (0.7) and a growth eonstant (K) of 0.307 is shown
in Figure 4. The estimated
Fiz
values were very low for length classes between 35 and 45 em FL, then inereasedgradually up to 0.4 in the 53-55 em FL elass. Above this size the values of
Fiz
ranged between 0.41 and 0.58. The weighted mean exploitation rates were 0.060 and 0.448, respeetively for length classes of 35-55 em and larger than 55 em FL.0.8 0.7 06 05 0 .4 0 .:3 02
OI
(F/Z)
35 ~ 4:3 'fl 51 55 59 6:3 57 71 n; 79
LENGTH CLASS
CM (FL)
Fi g. 4. Chanqe of exploitation rate
(FIZ) by length class of
the skipjack tuna observed over the period of
1980-1983.
As pointed out in the original paper of Jones (1981), it is eonvenient to use the average numbers of fish eaught per year over a period of several years to eliminate the possible influenee of fluetuations of reeruitment. In this case we are assuming that the length 'eomposition is representative of a
steady state situation and that the numbers eaught represent the annual cateh per length class.
Estimates of the average numbers (in thousands) of fish attaining eaeh 1ength elass annually over a period of four years (1980-1983) is shown in Table 3. The smallest length elass eommon to the four years' observation was 43 em FL; thus we used this value as the size of first reeruitment in this region. The estimate of the
average number attaining a length elass of 43 em FL over the four year period was 11.0 x 10⁶ fish for assumed values
34
Bolm Inst. oceanogr., S Paulo,33(1), 1985
Table
3.
Estimate of average numbers (in thousands) of fish attaining each length class by length cohort analysis, using the average numbers of fish caught annually for the period1980-1983
Len gth Class 6t
(om
35 - 37 1.9 16235.3 0.001 0.090 0.000 0.129
37 - 39 6.7 14836 . 8 0.005 0 . 094 o ,Doa 0.134
39 - 41 3 . 8 13504.1 0.003 0.098 0 .000 0.140
41 - 43 2 . 3 12244.0 0 . 002 0 .102 0.000 0. 146
43 - 45 10 .8 11054.2 0.010 O.lOS 0 . 001 0. 15 3
45 - 47 39.5 9924.1 0.036 0.116 0.004 0 .160
47 - 49 101.9 8834.7 0 , 095 0.130 0.012 0. 168
49 - 51 185.9 7756.4 0 . 172 0.150 0.026 0 .1 78
51 - 53 290 . 9 6675.2 0 .266 0 . 179 0 .048 0.188
53 - 5S 340 . 0 5580 . 6 0.326 0 .207 0.067 0 .199
55 - 57 358.6 4536.9 0 .374 0 .238 0 .089 0.213
57 - 59 349.7 3577 .6 0,412 0.271 0 .11 2 0 .22 7
59 - 61 366 .1 2728.8 0.479 0.329 0 . 157 0 .245
61 - 63 300 . 1 1964.1 0.496 0 . 368 0.183 0 . 265
63 - 65 232.0 1359.2 0.507 0 . 410 Q. 208 0 . 289
65 - 67 189 . 0 901.9 0.544 0,487 0.265 0 . 318
67 - 69 135.8 554.2 0 . 565 0.568 0 . 321 0.353
69 - 71 82 . 7 313 . 9 0.562 0.633 0 .355 0.396
71 - 73 42 .3 166 . 7 0 . 524 0.662 0.347 0. 450
73 - 75 19.4 86.0 0 ,4 60 0.675 0 . 311 0.521
7S - 77 14.3 43.8 0 . 533 0.944 0.504 0 . 629
77 - 79 5." 17 .0 0.5 14 1.128 0.580 0.784
79 - 81 2.7 5.5 0.578 1.841 1.064 1 . 110
81 • 0.4 0 .9
Note: M • 0 . 70 , K - 0.307. L .... 86.7 em FL , Fiz (for 81 + em class)-0.4
Th~ ~66~ct
06
~hang~in
6~hing ~660~According to the method proposed by Jones (1974), it is possible to determine the effects on yield per recruit of changes in fishing effort, using the values of
Fdt
obtained in the length cohort analysis. For this we can assume at first approximation that a change in fishing effort would change the values ofFdt
at all lengths by the same proportion.Using the average numbers of fish caught at each length class over a four year period, the expected increment in yield by increasing fishing effort was determined. For 30% and 50% increase of fishing efforts, expected yield
increments were 8% and 12%, respectively.
Because we have no information on the age composition of skipjack tuna caught in Brazilian waters, we tentatively used the age-length key determined by the ageing method of dorsal fin section for skipjack tuna in the eastern
Atlantic (Chur
et
al.,
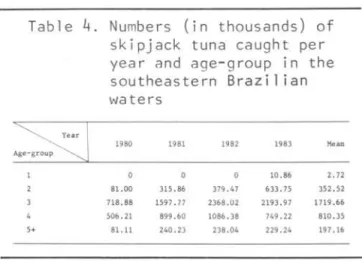
1983) andobtained a rough estimate of the number of skipjack tuna caught at each age group. The average lengths for one to five years-old fish were 29.2, 42.9, 55.5, 65.1 and 69.1 em FL, respectively. Table 4 shows estimates of number of
skipjack tuna caught per year and age-group during 1980-1983.
Table
4.
Numbers ( i n thousands) of skipjack tuna caught per year and age-group in the southeastern Brazilian waters~
1980 1981 1982 1983 MeaoAge-group
10 . 86 2.72
81.00 315.86 379.47 633.75 352.52
718.88 1597.77 2368.02 219 3 . 97 1719.66
506 .21 899.60 1086.38 749.22 810.35
5. 81. 11 240.23 238.04 229.24 197.16
Since there is no evidence of major differences in recruitment for the period 1980-1982, the mean numbers of skipjack tuna were used for virtual population analysis. At the same time, for comparative purpose we used the cohort data of the 1979-year-class of which the numbers of fish caught from second to five-plus year-olds are known, i.e. 81.00, 1597.77, 1086.38 and 229.24 thousands fish, respectively
To apply a virtual population analysis, we need, as input data, a fishing mortality coefficient of the last age-group (FÃ)' In this paper, we used arbitrarily selected FÃ values ranging from 0.5 to 0.9 for calculation. Since there is no significant difference between the results obtained from
different FÃ - values, only those obtained from FÃ= 0.5 are presented.
JABLONSKI & MATSUURA: Exploitation: Population size: Skipjack tuna 35
Table 5. Stock size estimates (in thousands) at the start of each yea r for
different natural
mortality coefficients, using the average
numbers of fish caught during 1980-1983 period
Natural Mortality Coefficient (M) Age-group
0.6 0.7 0.8
19352.7 26798.2 38367.4
1064 7.4 134 26.1 17139.0
5532.3 6392.3 7465 .6
1826 . 6 2031.9 2265.2
5+ 433 . 6 473.3 474.8
2 - 5+ 18440.1 22323.6 27382.5
Total 37792.8 49121.8 65749.9
Table
6.
Estimates of skipjack tuna biomass for different natural mortality coefficients for the 1980-1983 period (unit: tonnes)Age-group M • 0 .6 M " Q. 7 M = 0.8
18966 26262 37600
24489 30880 394 20
21133 24419 28519
10229 11379 12685
5+ 3301 3602 3902
2 - 5 + 59152 70280 84526
Total 78118 96542 122126
can estimate the potencial yield in this region by combining the data for two years-old and olders. The average biomass ranged from 59.2 to 84.5
thousand tonnes for natural mortality coefficients (M) of 0.6-0.8.
Using the XMB-equation of Gulland (1971), the annual potential yield of skipjack tuna was estimated. For different values of M, the maximum sustainable yield ranged from 17.7 to 33.8 thousand tonnes.
Discussion
An analysis of monthly size frequency distribution showed an irregular oscillation of modal size, indicating constant immigration and emigration of different modal groups in the fishin g area. Total landings during second semester always decrease to a lower leveI, which suggests a seasonal change of availability of the stock. It is probable that this change of
availa-bility may be associated not only with a change of habitat of skipjack tuna in the fishing area, but also indicates that other areas of major occurrence of skipjack tuna might exist which our fishing boats fail to cover.
The basic parameters required to apply a length cohort analysis are the natural mortality coefficient (M) and growth parameters (K & L). The first
00
attempts at age determination of
skipjack tuna were presented by Aikawa (1937) and Aikawa
& Kato (1938), based
on the growth marks observed onvertebral centra and they obtained an age-length key. Later many researchers have tried to determine the age of skipjack tuna by following the monthly length frequency composition or by reading growth marks on vertebrae
(Brock, 1954; Schaefer, 1960; Yokota
et
at.,
1961; Kawasaki, 1965; etc), butattempts to determine absolute age have been inconsistent and there remain large difference between the results obtained by different authors, including Aikawa's.
Recently in examining the various hard parts of skipjack, Batts (1972) showed clear growth marks on sections of the first dorsal spine and
determined the age-length relationship of skipjack tuna in North Carolina waters.
Using ta gg ing data several estimates of annual growth increments have been presented (Josse
et
at.,
1979; Cayre, 1979; wild & Foreman, 1980; Bard &Antoine, 1983). A series of these recent studies allows us to draw
fairly good conclusion about the growth of skipjack tuna. In this paper, we have used g rowth parameters based on g rowth ring determination from dorsal spines carried out by Chur
et
ato
(1983).
Whi1e skipjack tuna of just over 100 cm have been caught by the 1ong-1ine fishery, they are an anoma1y inasmuch as this size exceeds the limit deemed
possib1e on the basis of phy s io1ogical ca1cu1ation (Kitche1l
et
at.,
1978;Barda c h, 1983). The 1argest fish meas ured in the area studied was
82 cm FL. As shown by Beverton (1963), the body 1eng th of the lar ges t fish in commercial catches might be about 95% of the asymptotic leng th durin g ear1y
exploitation of the stock. Therefore the asymptotic 1 en g th L = 86.7 cm FL
36
used in this paper seems be reasonable for the stock exploited in this area.
As previously pointed out a good estimate of the natural mortality coefficient (M) is not available for either the western or eastern Atlantic populations. The range of natural mortality coefficients presented by Fonteneau (1983) was not precise, since he determined them from consideration of the moderate growth rate and the length of the exploitation period (5 to 6 years). For example, he considered values larger than 0.8 not to be realistic because they require a
growth rate greater than 20 cmíyear. In
the same way values less than 0.6 also seem not to be probable, because of the scarcity of big fish, at least in the catches.
Since we have size frequency data from only four years' observations, we could not apply virtual population
analysis on each cohort. To
overcome this difficulty, assuming a fairly stable recruitment, we applied the average numbers of fish caught during the four year period. In
addition, for comparative purposes, the cohort of 1979 of which the numbers of fish caught after recruit size are known, was used for virtual population analysis and the result is shown in Table 7. The total numbers of fish estimated using the 1979-cohort and average numbers over the four years showed reasonable
agreement.
Table 7. Virtual population analysis of the 1979-cohort. (I nput
datA: M
=
0.7, FÀ=
0.5)(unit: in thousand)
Numbera Fishing mortality Total mortality Survival Total
Age-group
caught coefficien t coefficient rate
81.0 0.008 0.708 0.493 14812.6
1598.0 0.354 1.054 0.349 7312.0
1086 .0 0.834 1.534 0.216 2546.8
5. 229.2 0.500 550.1
Total nuailer 25221. 5
Based on the estimated biomass of
96.5 thousand tonnes (with M = 0.7),
we determined the maximum sustainable yie1d to be 33.8 thousand tonnes, but if we consider on1y those older than two years, the estimated biomass and the MSY wil1 be 70.3 and 24.6 thousand tonnes, respective1y. This resu1t suggests that the actua1 landing of 18
Bolm Inst. oceanogr., S Paulo, 33(1), 1985
thousand tonnes is close to the MSY. The results of the length cohort analy-sis showed that increasing the fishing mortality rate by 30% and 50%, we obtained an increment in yield of 8% and 12%, respectively.
The method applied in this paper permits us to make an estimate of the size of the stock that is currently exploited in the present fishing area. In other words we can estimate how large the stock biomass is, which has sustained the annua1 landing of 18 thousand tonnes, but probably not the total biomass of
the area. Therefore, the estimated MSY does not mean the total potential yield, which can be obtained only by direct
stock assessment methods.
Introduction of large purse-seiner in this area which occurred in late 1983, does not imply a qualitative change in the fishery. Thus, if they operate in the same fishing area, we can not expect a significant increase in production. Furthermore, the operation of large purse-seiners will introduce hard competition with the Brazilian bait-boats in terms of disposable skipjack biomass.
Because the size of recruit in this fishing area is relatively large (43 cm FL), a growth overfishing problem seems to be remote. Furthermore, their
opportunistic reproduction behaviour
(Cayre & Farrugio, 1983) which occurs
in the vast tropical and subtropical ocean, may serve as a natural protection of spawners from commercial fishing boato This indicates that if the actual
fishing effort in the southeastern Brazilian waters does not reduce the spawning stock size to very low leveI, an overfishing problem will not occur. Then, our major concern will be if this skipjack stock is exploited by any other country in another part of the Atlantic, for examp1e, in the eastern central At1antic or in Caribbean sea?
Comparing genetic data of serum
esterase and transferrin systems, Fujino
et
alo
(1981) showed that there are fourJABLONSKI & MATSUURA: Exploitation: Population size: Skipjack tuna
37
possibi1ity of subgrouping within each subpopu1ation identified.
The resu1ts of tagging data obtained during the lnternationa1 Skipjack Yaar Program (1979-1983) of lCCAT showed there is no evidence of trans-At1antic movement of skipjack tuna, therefore, at the moment we can treat separate1y the two stocks exp10ited in the
eastern and western At1antic.
Acknowledgements
We thank Dr Roger Bai1ey of the Marine Laboratory, Aberdeen, for revision and critica1 reading of the manuscript. Dr Rodney Jones of the same 1aboratory kind1y gave some usefu1 suggestions on
the paper.
Financia1 support carne from the Financiadora de Estudos e Projetos S.A.
(FlNEP), for data processing with computer.
The junior author (Y.M.) received the research fe110wship of the Conselho Nacional de Desenvolvimento Científico e Tecnológico (CNPq).
References
AlKAWA, H. 1937. Notes on the shoa1 of bonito (skipjack, K~uwon~ p~~)
a10ng the Pacific coast of Japan. Bu11. Jap. Soc. scient. Fish., 6(1): 13-21.
- - - & KATO, M. 1938. Age
determination of fish (pre1iminary report). Bu11. Jap. Soc. scient. Fish., 7(1):79-88.
ANKENBRANDT, L. 1983. Food habits of bait-caught skipjack tuna from the southwestern At1antic oceano Paper presented at the Proc. int. Skipjack Yr Progm. Conf., lCCAT, June 21-25, 1983, Tenerife, Spain.
BARD, F. X. & ANTOlNE, L. 1983.
Croissance du lista0 dans l' At1antique Est. southwestern At1antic oceano Paper prespnted at the Proc. int. Skipj ack ',.,'\;0- Progm. Conf., lCCAT, June
21-25, 1983, Tenerife, Spain. BARDACH, J. E. 1983. Pacific tuna:
bio1ogy, economics, and po1itics of a 1arge fishery resources. In:
proceedings of the Joint Oceano-graphic Assemb1y 1982-genera1
symposia. Canadian National Cornrn./ SCOR, Ottawa, p. 76-94.
BATTS, B. S. 1972. Age and growth of the skipjack tuna, K~uwon~
puam-L6
(Linnaeus), in North Carolina waters. Chesapeake Sci., 13(4):237-244.
BEVERTON, R. J. H. 1963. Maturation, growth and morta1ity of c1upeid and engrau1id stocks in re1ation to fishing. Rapp. P.-v. Reun. Cons. perm. int. Exp1or. Mer, 154:44-67. BROCK, V. E. 1954. Some aspects of the
bio1ogy of the aku, K~uwon~
puam-L6,
in the Hawaiian lslands.Pacif. Sci., 8(1):94-104.
CAYRE, P. 1979. Deterrnination de l' age de lista0 K~uwon~
puam-L6
L., debarques
ã
Dakar. Co1. Vo1. scient. Pap., lCCAT, 8(1):196-200.- - - & FARRUGlO, H. 1983.
Bio1ogie de la reproduction du lista0 de l'ocean At1antique. Paper presented at the Proc. int. Skipjack Yr Progm. Conf., lCCAT, June 21-25,
1983, Tenerife, Spain. CAYRE, P. & LALOE, F. 1983.
Re1ations poids-1ongueur du lista0 de l'ócean At1antique. Paper presented at the Proc. int. Skipjack Yr Progm. Conf., lCCAT, June 21-25, 1983,
Tenerife, Spain.
CHUR, V. N.; OVCHlNNlKOV, V. V. &
KOROLEVlCH, L. l. 1983.
Some prob1ems of studying of age and growth of skipjack (K~uwon~
puam-L6
L.) of the At1antic oceanoPaper presented at the Proc. int. Skipj ack Yr Progm. Conf. , lCCAT, June 21-25, 1983, Tenerife, Spain.
FONTENEAU, A. 1983. Etat des stocks de l'At1antique par ana1yse des cohortes, ana1yse de production par recrue et par 1e mede1e global. Paper presented ~t the Proc. int. Skipj ack Yr Progm. Conf. , lCCAT, June 21-25, 1983, Tenerife, Spain.
38 Bolm Inst. oceanogr., S Paulo, 33(1), 1985
GOLDBERG, S. R. & AU, D. W. K. 1983. The spawning schedu1e of skipjack
tuna from southeastern Brazi1 as determined from histo1ogica1
examination of ovaries, with notes on spawning in the Caribbean. Paper presented at the .Proc. ~nt.
Skipjack Yr Progm. Conf., ICCAT, June 21-25, 1983, Tenerife, Spain.
GULLAND, J. A. 1965. Estimation of morta1ity rates. Annex to Artic Fisheries Working Group Reports. ICES CM 1965/Gadoid Fish. Comm. 3. p. 1-9. (mimeo).
1971. The fish resources of the oceans. London, Fishing News (Books), 255 p.
JABLONSKI, S.; BRAILE, A. A.; ROMÃO, C. M. & TEIXEIRA, M. S. M. 1983.
Sexual maturity and sex-ratios of the skipj ack tuna Ka;t6UWOYlM pUam~
(Linnaeus), from southeastern Brazi1. Co11. Vo1. scient. Papers, ICCAT,
20(1) :217 - 233.
JONES, R. 1974. Assessing the long term effects of changes in fishing effort and mesh size from 1ength composition data. ICES, CM 1974/F, 33:1922-1930. - - - 1979. An ana1ysis of a
Nep~op~ stock using 1ength composition data. Rapp. P.-v. Reun. Cons. perm. int. Exp1or. Mer, 175:259-269.
---1981. The use of 1ength
co ~ position data in fish stock
assessments (with notes on VPA and cohort ana1ysis). FAO Fish. Circ., 734:1-60.
JOSSE, E.; LE GUEN, J. C. & KEARNEY, R. F. 1979. Croissance des bonites ã
ventr e rayê. Commission du Pacifique sud Noumea, Nouve11e-Ca1edonie, Doc. occas.,11:1-33.
KAWASAKI, T. 1965. Eco1ogy and dynamics of the skipjack popu1ation (I), (11). Nihon suisan shi gen hogo kyokai,
s uisan kenkyu soshü (Study ser. Jap. Fish. Resour. Conservo Ass.) (in Japanese).
KITCHELL, J. F.; NEILL, W. H.; DIZON, A. E. & MAGNUSON, J. J. 1978.
Bi oen e r ge ti c s pec tra of s kipj ack and
ye110wfin tunas. IYl: Sharp, G. D.
&
Dizon, A. ed. The physio1ogica1 eco1ogy of tunas. New York, Academic Press, p. 357-368.MATSUURA, Y. 1982. Distribution and abundance of skipjack (K~wwonu~
pUam~) 1arvae in eastern Brazi1ian waters. Bo1m Inst. oceanogr., S Paulo, 31(2):5-7.
1983a. Deve10pment of a
new Brazi1ian skipjack fishery in the Rio de Janeiro region. BulI. Jap.
Soe. Fish. Oceanogr., 44:151-154. 19836. Distribution and abundance of skipjack 1arvae in the western central At1antic. Paper presented at the Proc. int. Skipjack Yr Progm. Conf., ICCAT, June 21-25, 1983, Tenerife, Spain.
SCHAEFER, M. B. 1960. Report on the investigations of the Inter-American Tropical Tuna Commission for the year 1959. Rep. inter-Amo trop. Tuna
Commn, 1959:39-156.
WILD, A. & FOREMAN, T. J. 1980. The ra1ationship between oto1ith
increments and time for ye110wfin and skipjack tuna marked with
Tetracycline. BulI., inter-Amo trop. tuna Commn, 17(7):509-521.
YOKOTA, T.; TORIYAMA, M,; KANAI, F.
&
NOMURA, S. 1961. Studies on the feeding habit of fishes. Rep. Nankai reg. Fish. Res. Lab., 14:234 p.ZAVALA-CAMIN, L. A. 1982. Informesobre la presencia de bonito-listado
(Ka;t6uWOYlM pUam~) en e1 contenido
estomacal de predadores capturados con palangre en el sudeste y sur deI Brasil. Co11. Vo1. Sei. Pap., ICCAT, 17(1): 209-210.
1983. Areas de cres-cimiento de listado obtenidas por medio de datos historicos de examenes de contenido estomacal de predadores. Paper presented at the Proc. int. Skipjack Yr Progm. Conf., ICCAT, June
21-25~ 1983, Tenerife, Spain.
