Genetic Structure of Water Chestnut Beetle:
Providing Evidence for Origin of Water
Chestnut
Xiao-Tian Tang1☯, Fu-Shan Zheng2☯, Jing Qin1, Ming-Xing Lu1, Yu-Zhou Du1*
1School of Horticulture and Plant Protection & Institute of Applied Entomology, Yangzhou University, Yangzhou 225009, China,2Institute of Shandong River Wetlands, Laiwu, 271100, China
☯These authors contributed equally to this work. *[email protected]
Abstract
Water chestnut beetle (Galerucella birmanicaJacoby) is a pest of the water chestnut (Trapa natansL.). To analyze the phylogeny and biogeography of the beetle and provide evidence for the origin ofT.natansin China, we conducted this by using three mitochondrial genes (COI,COIIandCytb) and nuclear ITS2 ribosomal DNA ofG.birmanica. As for mtDNA genes, the beetle could be subdivided into three groups: northeastern China (NEC), cen-tral-northern-southern China (CC-NC-SC) and southwestern China (SWC) based on SAMOVA, phylogenetic analyses and haplotype networks. But for ITS2, no obvious line-ages were obtained but individuals which were from NEC region clustered into one clade, which might be due to sequence conservation of ITS2. Significant genetic variation was observed among the three groups with infrequent gene flow between groups, which may have been restricted due to natural barriers and events in the Late Pleistocene. Based on our analyses of genetic variation in the CC-NC-SC geographical region, the star-like haplo-type networks, approximate Bayesian computation, niche modelling and phylogeographic variation of the beetle, we concluded that the beetle population has been lasting in the lower, central reaches of the Yangtze River Basin with its host plant, water chestnut, which is consistent with archaeological records. Moreover, we speculate that the CC-NC-SC pop-ulation ofG.birmanicamay have undergone a period of expansion coincident with domesti-cation of the water chestnut approximately 113,900–126,500 years ago.
Introduction
Water chestnut beetle,Galerucella birmanicaJacoby (Coleoptera: Chrysomelidae), is an impor-tant pest of a floating annual aquatic plant, Water chestnut (Trapa natansL.), and is relatively host-specific, although it has been known to feed on water shield plants (Brasenia schreberi
Gmelin) [1,2]. In China,G.birmanicais mainly distributed in habitat ofT.natans, such as Yangtze River Basin and Pearl River Basin. In recent decades, many studies have focused on the biology [3–5], ecology [6–8], and control [9]. In America, several studies suggested thatG.
a11111
OPEN ACCESS
Citation:Tang X-T, Zheng F-S, Qin J, Lu M-X, Du Y-Z (2016) Genetic Structure of Water Chestnut Beetle: Providing Evidence for Origin of Water Chestnut. PLoS ONE 11(7): e0159557. doi:10.1371/journal. pone.0159557
Editor:Youjun Zhang, Institute of Vegetables and Flowers, Chinese Academy of Agricultural Sciences, CHINA
Received:May 20, 2016
Accepted:July 5, 2016
Published:July 26, 2016
Copyright:© 2016 Tang et al. This is an open access article distributed under the terms of the Creative Commons Attribution License, which permits unrestricted use, distribution, and reproduction in any medium, provided the original author and source are credited.
Data Availability Statement:All haplotypes files are available from the NCBI database (accession numbers: EF512802-EF512833, EF512778-EF512800 and EF512757-EF512776).
Funding:This work was supported by the National Basic Research Program of China(973 Program) (2012CB114100 and 2006CB102002): YZD.
birmanicashowing promise as potential biological control agents to the invasive plant,T.
natans[10,11]. However, no further research concentrated on genetic aspects ofG.birmanica, such as genetic diversity, population genetic structure and phylogeography.
The beetle’s host, Water chestnut (T.natans), was introduced into North America around 1870 and has become invasive in the Northeastern United States and Canada [12]. However, there are distinct and controversial viewpoints about the origin ofT.natans; for example, some scholars consider Africa and Eurasia as the origin of water chestnut, even though it is consid-ered an endangconsid-ered species in Europe [13–15]. Other researchers suggest Asia as the origin [16–18], particularly parts of China such as the Taihu Basin [10,19] and lower, central reaches of Yangtze River Basin [20–23]. However, other accounts suggest thatT.natansoriginated from Europe and Asia [24], and despite this, no genetic evidence give us a clear picture regard-ing the origin of water chestnut.
The plant–insect co-evolutionary studies have evolved significantly since Ehrlich and Raven (1964) [25] formally introduced the concept of stepwise co-evolution based on butterfly-angio-sperm interactions. Interest in co-evolution has encompassed plant-insect, host–parasite, and host–bacteria interactions [26–33]. We hypothesize that there are potential co-evolutionary connections between the water chestnut beetle and water chestnut according to two important points. The first one is the oligophagous character ofG.birmanica. Secondly, the spread ofG.
birmanicais directly correlated with distribution of its host plant,T.natans.
Because mtDNA has some inherent characteristics including haploid uniparental inheri-tance and the absence of genetic recombination [34]; in addition, ITS regions of rDNA have been developed into a useful tool for many phylogenetic studies [35–37], which could provide additional information to supplement the findings of mtDNA analysis. Therefore, in the pres-ent study, on one hand, we integrate phylogenetic and biogeographic methods to reconstruct the population genetic structure, demographic history and molecular phylogeny of water chest-nut beetle using three mtDNA genes (COI,COIIandCytb) and nuclear ribosomal internal transcribed spacer 2 (ITS2) region. On the other hand, our study may provide indirect evidence for the geographical origin of water chestnut, which has long been debated, based on genetic structure of the water chestnut beetle.
Materials and Methods
Sample collection and DNA extraction
In this study, we collected specimens ofG.birmanicaandG.grisescens(outgroup) onT.natans
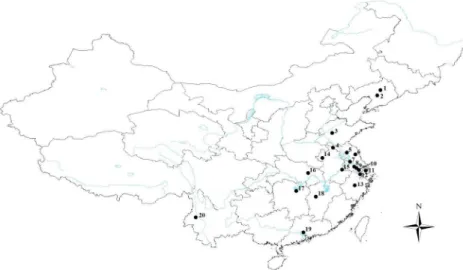
from 20 populations in ten provinces and one city. This included most of the areas where water chestnut occurs in China including Liaoning, Shandong, Jiangsu, Zhejiang, Anhui, Hubei, Hunan, Jiangxi, Guangdong, Yunnan and Shanghai (Fig 1;S1 Table). We declare that no spe-cific permissions were required for these activities and that the field studies did not involve endangered or protected species. It is noteworthy that the sampling areas covered five zoogeo-graphical regions, including northeastern China (NEC), northern China (NC), southwestern China (SWC), central China (CC) and southern China (SC). Specimens were preserved in 100% ethanol at -20°C until processing. Genomic DNA was then extracted from the thorax of individual beetles using a cetyltrimethyl ammonium bromide (CTAB) extraction protocol.
PCR amplification and sequencing
CTTGCTTTCAGTCATCT)[39], and Cytb-F (5’-TATGTACTACCATGAGGACAAATATC) and Cytb-R (5’-ATTACACCTCCTAATTTATTAGGAAT) [38], respectively. PCR reactions were carried out in 50μL aliquots containing 100 ng extracted DNA, 5μL 10× Taq buffer, 4μL
25 mmol/L MgCl2, 4μL 25 mmol/L dNTPs, 1μL 20μmol/L primers, 0.4μL rTaq DNA
poly-merase (5U/μL), and ultra-pure water. PCR was conducted using the following conditions:
94°C for 4 min; 35 cycles of 94°C for 50 s, Tm for 50 s, 72°C for 1 min, and a final extension step of 72°C for 10 min. About 680 bp fragment of 5.8S-ITS2-28S region was amplified with primers: ITS2-F (5’-GCATCGATGAAGAACGCAGC) and ITS2-R (5’-TCCTCCGCTTATT GATATGC) [40]. All amplification products above were purified using the AxyPrep™DNA Gel Extraction Kit (Axygen, Union City, CA, USA), cloned into pGEM-T Easy Vector (Pro-mega), and then transformed intoEscherichia coliDH5αcells. Finally, a total of 156 positive clones (three repeats) were picked and sequenced by IGE Biotechnology Co., Ltd (Guangzhou, China) and Sangon Biotechnology Co., Ltd (Shanghai, China).
Statistical analysis
The three mtDNA gene sequences were initially aligned using CLUSTAL X v. 1.83 [41] and then manually aligned. Haplotype diversity (H), nucleotide diversity (π) and the average
num-ber of nucleotide differences (K) were calculated using DnaSP v. 5.0 [42].
Spatial analysis of molecular variance was performed using SAMOVA v. 1.0 [43] to identify population groups. One hundred simulated annealing processes were used for each value of K (number of groups). The most supported number of groups (K) was determined by repeating the analysis with K ranging from 2 to 10 and selecting the subdivision scheme associated with the highest FCT. Analyses of molecular variance (AMOVA) were performed using Arlequin v. 3.5 [44] based on the groups inferred by SAMOVA analysis. F-statistic (FST) values were also calculated. Moreover, using the formula FST=1/ (1 + 2Nm), which is specific for organelle genetic data [45], we derived the value for gene flow (Nm). Phylogenetic trees were constructed using MrBayes v. 3.2.1 [46] and a PHYML online web server [47–48];G.grisescensserved as Fig 1. Sampling sites ofG.birmanicain China.Maps were created using Esri’s ArcGIS platform (http:// www.esri.com/software/arcgis). Numbers represent the following geographical locations (city, province): 1, Shenyang, Liaoning; 2, Anshan, Liaoning; 3, Taian, Shandong; 4, Xuzhou, Jiangsu; 5, Huaian, Jiangsu; 6, Yancheng, Jiangsu; 7, Yangzhou, Jiangsu; 8, Changzhou, Jiangsu; 9, Wuxi, Jiangsu; 10, Suzhou, Jiangsu; 11, Shanghai; 12, Jiaxing, Zhejiang; 13, Yiwu, Zhejiang; 14, Fuyang, Anhui; 15, Wuhu, Anhui; 16, Xiaogan, Hubei; 17, Yiyang, Hunan; 18, Xinyu, Jiangxi; 19, Guangzhou, Guangdong; and 20, Baoshan, Yunnan.
the outgroup. The best fit model for nucleotide alignments was determined by Modeltest 3.7 [49]. According to the Akaike information criterion, the GTR + I + G paradigm was the best model for analysis using nucleotide alignments. For analysis by Bayesian inference (BI), nucle-otide alignments were constructed using the MrBayes program with 1,000,000 generations and with the first 25% discarded as burn-in. Maximum likelihood (ML) analysis was performed using the following conditions: the proportion of invariable sites was“estimated,”the number of substitution rate categories was four; the gamma distribution parameter was“estimated,”
and the starting tree was a BIONJ distance-based tree. Tree data were visualized and edited using FigTree v. 1.3.1 [50]. Median-joining networks of haplotypes of the three genes were con-structed using NETWORK v. 4.6 [51] and used to infer evolutionary relationships among haplotypes.
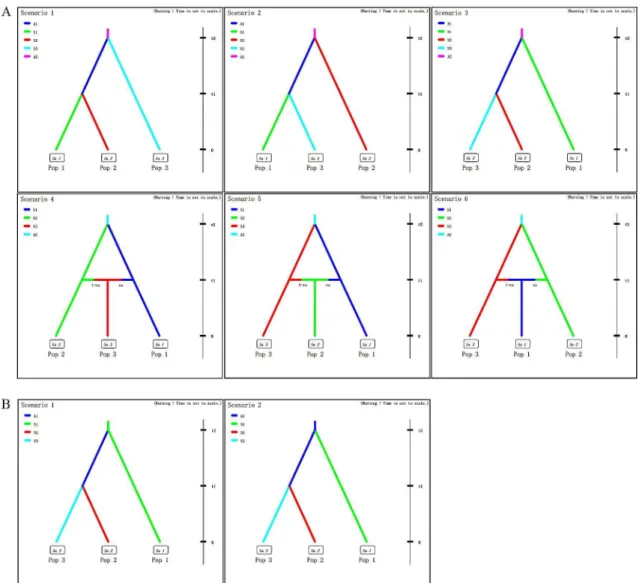
The software DIYABC version 2.0 [52] was used to compare different competing scenarios regarding the ancestral populations ofG.birmanica. Step 1, a total of six scenarios were consid-ered regarding the variation in population size and the split and admixture events (Fig 2A); Step 2, two competing scenarios based on the scenario that northeastern China (NEC) and southwestern China (SWC) split from central-northern-southern China (CC-NC-SC) were analyzed, regarding the source of the entire China populations (Fig 2B).
We used ecological niche modelling to predict the geographic distribution of climatically suitable habitats forG.birmanicawithin our study area and analyze whether climatic stability and current and past climate conditions are responsible for observed patterns of genetic diversity and structure using MaxEnt [53]. We obtained bioclimatic data layers for current (1950–2000), last glacial maximum (LGM) and last interglacial (LIG) conditions from the WorldClim database (http://worldclim.org/current.htm) [54]. The random test percentage was set to 25%, and the Jackknife procedure was used to estimate the contribution of each variable based on performance of the model. The area under the curve (AUC) value was calculated for model validation; AUC reflects the model’s ability to distinguish between present records and random background points. AUC values ranged from 0.5 (not different from a randomly-selected predictive distribu-tion) to 1 (with perfect predictive ability). Models having AUC values>0.9 were considered to
have very good,>0.8 good, and>0.7 useful discrimination abilities [55]. The final map was
visu-alized and processed using the ArcGIS platform (http://www.esri.com/software/arcgis). The demographic history of all populations (pooled) and individual population groups identified by SAMOVA analysis was studied using mismatch distributions in ARLEQUIN. Tajima’sDand Fu’sFStests were used to test for neutrality. Population expansion time (τ) and
the sum of squared deviation (SSD) between observed and expected mismatch distributions were similarly calculated. All parameters were evaluated based on 1,000 bootstrap replicates.
Results
Genetic diversity
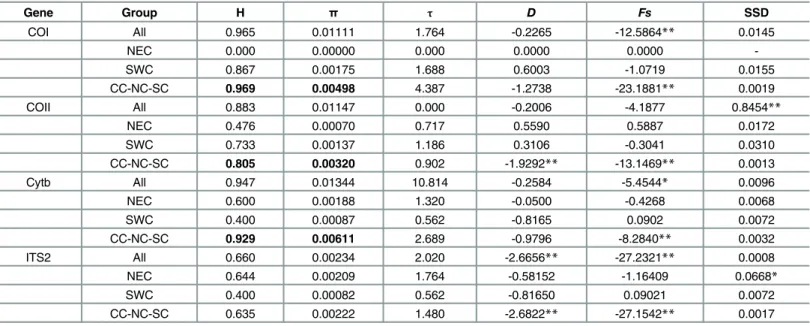
The length of aligned sequences ofCOI,COIIandCytbgenes was 837, 681 and 462 bp, respec-tively. Among individuals from 20 populations, 33COI, 23COIIand 20Cytbhaplotypes were identified; these were submitted to GenBank as accession numbers EF512802-EF512833, EF512778-EF512800 and EF512757-EF512776, respectively. The average pairwise sequence divergence among haplotypes ofCOI,COIIandCytbwas 0.965, 0.883 and 0.947, respectively (Table 1). Nucleotide diversity (π) over all populations was 0.01111, 0.01147 and 0.01344,
respectively. Interestingly, there was a larger genetic variation in the CC-NC-SC geographic region as compared to other areas of China (see bold font,Table 1).
research were submitted to GenBank (accession numbers: KR401224-KR401257). However, ITS2 haplotype and nucleotide diversity were relatively low (H = 0.660 andπ= 0.00234).
We also calculated the number of unique haplotypes (n), haplotype diversity (H), nucleotide diversity (π) and the average number of nucleotide differences (K) for each population (S2 Table). Overall, our statistics suggest that entire populations ofG.birmanicaretain high levels of genetic diversity.
Population genetic structure and phylogenetic analysis
When FCTvalues were analyzed by SAMOVA, three population groups were suggested as the optimal number forCOII(FCT= 0.88007),Cytb(FCT= 0.76822) and ITS2 (FCT= 0.31787); however, five groups were suggested whenCOIwas considered (FCT= 0.78653) (Table 2). Pop-ulations from the 20 geographical locations formed three clusters as follows: SY and AS; TA, XZ, HUA, YC, YZ, CZ, WX, SZ, SH, JX, YW, FY, WH, XG, YY and XY; and BS (codes repre-sent geographical locations; seeS1 Table). The three clusters correspond to three
Fig 2. Scenarios for the DIY ABC analyses, which was designed to infer the origin ofG.birmanica.A, Six scenarios showing relationships of three groups regarding the variation in population size and the split and admixture events. B, Two scenarios showing the origin ofG.birmanica.
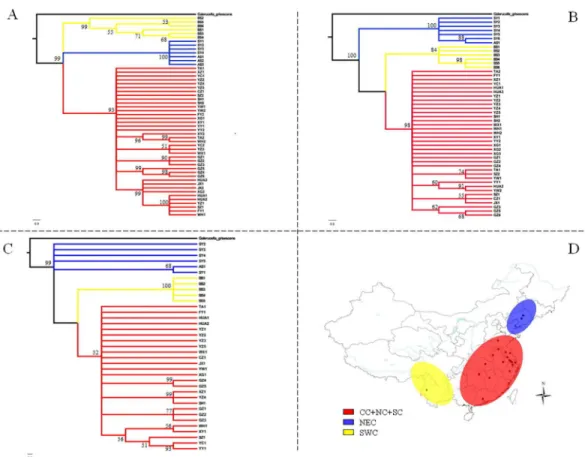
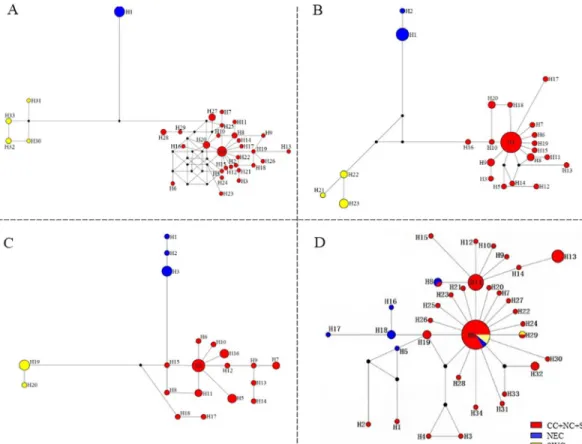
geographically distinct regions that we refer to as northeastern China (NEC), central-northern-southern China (CC-NC-SC), and southwestern China (SWC), which agreed with the phyloge-netic trees constructed with Bayesian and ML methods and the three mtDNA genes. The phy-logenetic trees had similar topology using the two methods; consequently, only phylograms derived using Bayesian analysis are shown (Fig 3). Interestingly, networks constructed using median-joining corroborated the assignment of haplotypes into one of the three clades (NEC, CC-NC-SC and SWC) (Fig 4). However, as for phylogenetic tree based on ITS2 ribosomal DNA, no obvious lineages were obtained but with haplotypes which were from NEC region clustered into one clade (Fig 5).
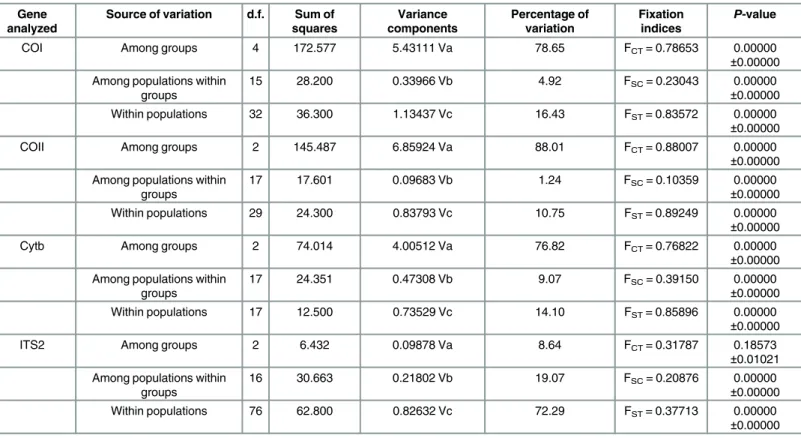
Analyses of molecular variance (AMOVA) revealed that most (COI, 78.65%;COII, 88.01%;
Cytb, 76.82%) of the variation was distributed between groups (Table 2). Genetic differentia-tion was limited among populadifferentia-tions within groups (COI, 4.92%;COII, 1.24%;Cytb, 9.07%) and within individual populations (COI, 16.43%;COII, 10.75%;Cytb, 14.10%) (Table 2). Fixation indices that indicate genetic differentiation, including FCT(between groups), FSC(among pop-ulations within groups) and FST(within populations) were all highly significant (P<0.01) for the three mtDNA genes (Table 2). The hierarchical AMOVA was also conducted for ITS2 region. Unlike mtDNA genes, the main genetic variation attributed to within populations (72.29%,Table 2).
Median-joining networks had star-like conformations with limited substructures (Fig 4). For three mtDNA genes, members of haplotype 4, which derived from beetle populations inhabiting the lower, central Yangtze River Basin in the CC-NC-SC region (e.g. YZ, SZ, XZ, HUA, YC, SH, WH and FY), were considered to be ancestral since they had a central position in the networks (Fig 4A, 4B and 4C). The remaining haplotypes formed star-like topologies that were consistent with recent population expansion [56,57]; furthermore, three clades Table 1. Parameters of genetic diversity and demographic analysis.
Gene Group H π τ D Fs SSD
COI All 0.965 0.01111 1.764 -0.2265 -12.5864** 0.0145
NEC 0.000 0.00000 0.000 0.0000 0.0000
-SWC 0.867 0.00175 1.688 0.6003 -1.0719 0.0155
CC-NC-SC 0.969 0.00498 4.387 -1.2738 -23.1881** 0.0019
COII All 0.883 0.01147 0.000 -0.2006 -4.1877 0.8454**
NEC 0.476 0.00070 0.717 0.5590 0.5887 0.0172
SWC 0.733 0.00137 1.186 0.3106 -0.3041 0.0310
CC-NC-SC 0.805 0.00320 0.902 -1.9292** -13.1469** 0.0013
Cytb All 0.947 0.01344 10.814 -0.2584 -5.4544* 0.0096
NEC 0.600 0.00188 1.320 -0.0500 -0.4268 0.0068
SWC 0.400 0.00087 0.562 -0.8165 0.0902 0.0072
CC-NC-SC 0.929 0.00611 2.689 -0.9796 -8.2840** 0.0032
ITS2 All 0.660 0.00234 2.020 -2.6656** -27.2321** 0.0008
NEC 0.644 0.00209 1.764 -0.58152 -1.16409 0.0668*
SWC 0.400 0.00082 0.562 -0.81650 0.09021 0.0072
CC-NC-SC 0.635 0.00222 1.480 -2.6822** -27.1542** 0.0017
H: Haplotype diversity;π: nucleotide diversity;τ: population expansion time;D: Tajima’sD;Fs: Fu’sFs; SSD: sum of squared deviations between observed
and expected mismatch distribution under a sudden expansion model; bold indicates there is a larger genetic variation in CC-NC-SC region than in other regions
*P<0.05
**P<0.01.
(marked in red, yellow and blue, seeFig 4) were generally present in each network. The three clades represent three geographically-distinct regions with no shared haplotypes, suggesting that the populations differentiated within the three different regions. However, no obvious lin-eages were obtained in the median joining networking of the ITS2 ribotypes (Fig 4D). We must note that the network shows few mutational steps and also displays a star like pattern, where the most common ribotype (Hap 6) lied at the star’s center and derivatives were connected to it by short branches (Fig 4D). Most of haplotype 6s also derived from the lower, central Yangtze River Basin in the CC-NC-SC region but with few from NEC and SWC regions. Haplotype 11 as the secondary common haplotype were all from Taihu Basin in lower Yangtze River Basin including SZ and CZ populations.
FSTvalues for the three regions were 0.732–0.963 forCOI, 0.826–0.957 forCOII, 0.728– 0.952 forCytb, but -0.025–0.200 for ITS2 (Table 3). However, the Nmvalues representing gene flow were low: 0.019–0.183 forCOI; 0.022–0.105 forCOII; 0.025–0.187 forCytB; but more than 2.000 for ITS2 (Table 3). We also provide FSTand Nmvalues for 20 populations inS3–S5 Tables. These data indicate a very low level of gene flow between populations from different regions, whereas a high level of gene flow was observed between population clusters residing in the CC-NC-SC region.
Scenario testing
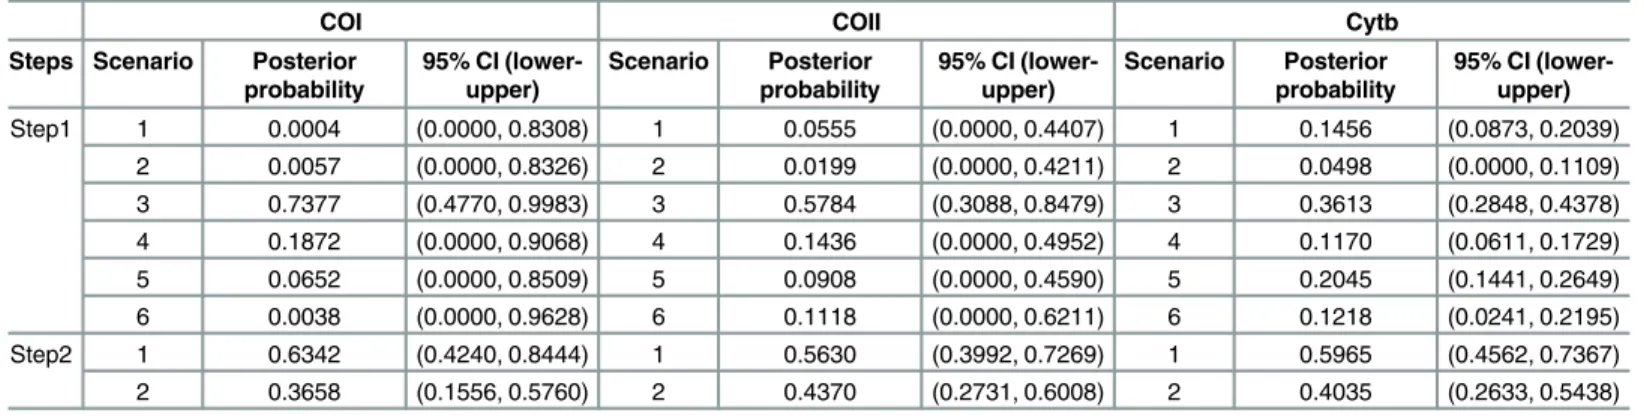
In the scenario testing analyses of step 1, the scenario with the highest likelihood was scenario 3 (logistic regression of COI, COII and Cytb is 0.7377 [95% CI: 0.4770–0.9983], 0.5784 [95% CI: 0.3088–0.8479], 0.3613 [95% CI: 0.2848, 0.4378], respectively) (Fig 2A;Table 4), indicating Table 2. AMOVA results comparing genetic variation inGalerucella birmanicacollected from 20 localities among the three geographical regions.
Gene analyzed
Source of variation d.f. Sum of squares Variance components Percentage of variation Fixation indices P-value
COI Among groups 4 172.577 5.43111 Va 78.65 FCT= 0.78653 0.00000
±0.00000
Among populations within groups
15 28.200 0.33966 Vb 4.92 FSC= 0.23043 0.00000
±0.00000
Within populations 32 36.300 1.13437 Vc 16.43 FST= 0.83572 0.00000
±0.00000
COII Among groups 2 145.487 6.85924 Va 88.01 FCT= 0.88007 0.00000
±0.00000
Among populations within groups
17 17.601 0.09683 Vb 1.24 FSC= 0.10359 0.00000
±0.00000
Within populations 29 24.300 0.83793 Vc 10.75 FST= 0.89249 0.00000
±0.00000
Cytb Among groups 2 74.014 4.00512 Va 76.82 FCT= 0.76822 0.00000
±0.00000
Among populations within groups
17 24.351 0.47308 Vb 9.07 FSC= 0.39150 0.00000
±0.00000
Within populations 17 12.500 0.73529 Vc 14.10 FST= 0.85896 0.00000
±0.00000
ITS2 Among groups 2 6.432 0.09878 Va 8.64 FCT= 0.31787 0.18573
±0.01021
Among populations within groups
16 30.663 0.21802 Vb 19.07 FSC= 0.20876 0.00000
±0.00000
Within populations 76 62.800 0.82632 Vc 72.29 FST= 0.37713 0.00000
±0.00000
a split of NEC and SWC from CC-NC-SC. In step 2, the scenario testing revealed that samples from NEC and SWC region most likely originated from CC-NC-SC region (Fig 2B;Table 4).
Niche modelling
The area under the curve (AUC) for the test data was 0.991–0.994, indicating a high fit of the modelled and observed distribution [53,58]. The MaxEnt distribution models indicates thatG.
birmanicapopulations had a larger distribution during the LGM with a range contraction between the LGM and its current distribution (Fig 6A and 6B). What’s more, the LIG distribu-tion mirrored current distribudistribu-tion (Fig 6C). As a whole, the region of the lower, central reaches of the Yangtze River Basin was predicted to be highly suitable forG.birmanica, which may potentially suggest that this region acted as refugia during glacial period (Fig 6). In addition, the Jackknife evaluation indicated that precipitation during the warmest quarter (Bioclim 18) was the main factor influencing the distribution ofG.birmanica.
Demographic history
For mtDNA genes, neutrality tests using Tajima’sDstatistical test generally resulted in nega-tive values with no significance; an exception wasCOIIin the CC-NC-SC region (-1.9292,
P<0.01,Table 1). When Fu’sFStest was utilized, samples from the CC-NC-SC region
devi-ated significantly from neutrality, suggesting that the CC-NC-SC region is responsible for Fig 3. Bayesian phylograms based on sequences obtained fromG.birmanicasamples.Sequence data are shown forCOI(A),COII(B); and (C)Cytb. (D) Geographical distribution of the three groups. Abbreviations: CC-NC-SC (central-northern-southern China); NEC, northeastern China (NEC), and SWC, southwestern China.
population disequilibrium (Table 1). As for ITS2 region, significantly negative values of Taji-ma’sD(-2.6656,P<0.01) and Fu’sFS(-27.2321,P<0.01) indicated that the whole set ofG.
birmanicasamples studied here did not fit a simple model of neutral evolution.
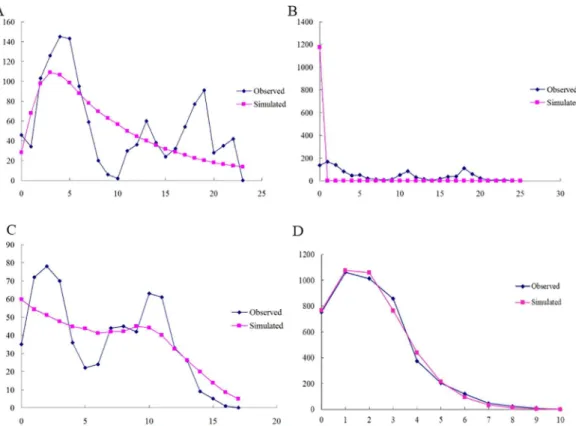
Since most of the populations belonged to the CC-NC-SC geographical region, we con-structed mismatch distributions for all regions combined and the CC-NC-SC region separately based on mtDNA gene and ITS2 region. Surprisingly, we found that the mismatch distribution of all 20 populations pooled together as well as of the CC-NC-SC region only was distinctly diverse based on mtDNA gene. When theFStest was utilized, significant, negative values were
obtained forCOI (-12.5864,P<0.01) andCytb(-5.4544,P<0.05) as well as multimodal
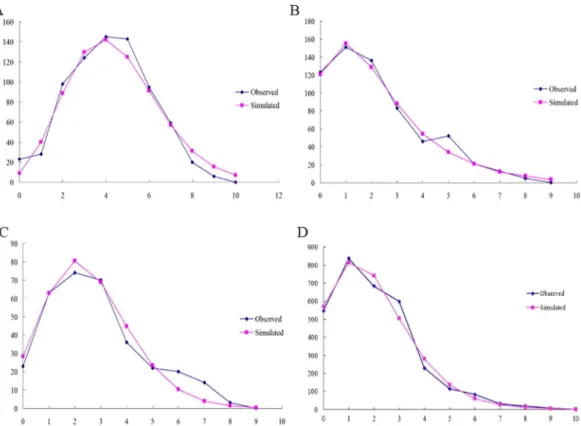
curves were obtained for all groups (Fig 7), indicating no recent population expansion events for all populations. Analysis of the CC-NC-SC region separately using theFSstatistic showed
significant negative values of neutrality for all three genes (COI, -23.1881,P<0.01;COII,
-13.1469,P<0.01; andCytb, -8.2840,P<0.01) and a unimodal curve, which demonstrates
population expansion within the CC-NC-SC region (Fig 8). However, The mismatch distribu-tion of allG.birmanicapopulations pooled together as well as of the CC-NC-SC region only were distinctly unimodal based on ITS2 region (Figs7and8), coupled with significantly nega-tive values of Tajima’sDand Fu’sFS, suggesting recent population expansion events.
Besides, positiveDandFSvalues of mtDNA genes as well as no significant value ofDandFS
in the NEC and SWC regions, such asD= 0.6003 in SWC (COI) andFS= 0.5887 in NEC
Fig 4. Median-joining (MJ) networks ofG.birmanicahaplotypes based on analysis of the following genes (A)COI; (B)COII; (C)Cytband (D) ITS2 region. The sizes of circles are proportional to the number of individuals in the data point. Abbreviations: CC-NC-SC (central-northern-southern China); NEC, northeastern China (NEC), and SWC, southwestern China.
(COII) may indicate recent population bottlenecks in the two regions (Table 1). The sum of squared deviation (SSD) did not exclude the sudden expansion model due to a no significant difference from the expected distribution (P>0.05).
Theτvalue (mean of population expansion time) of CC-NC-SC region that was estimated
for the sudden expansion model was approximately 4.387, 2.689 and 1.480 mutation units for
COI,Cytband ITS2 ribosomal DNA, respectively, but only 0.902 forCOII(Table 1). Theτ
parameter forCytb(all samples) was 10.814, whereasτforCOIIwas 0.000.
Discussion
As mentioned above, greater genetic differentiation was observed between the three groups versus between populations within groups and within populations based on mtDNA genes but relatively lower revealed by ITS2 ribosomal DNA (Table 2). The genetic differentiation may be attributed to geographical isolation and the nonmigratory behavior of the water chestnut bee-tle. With respect to geographical isolation, the genetic differentiation of the NEC and
CC-NC-SC regions may be related to the geography of the Yellow River and Yanshan
Table 3. Estimates of FSTand gene flow (Nm) for pairs of the three regions.
NEC CC-NC-SC SWC
NEC 0.105, 0.056, 0.187, 2.038 0.019, 0.022, 0.025, 2.000 CC-NC-SC 0.826, 0.899, 0.728, 0.197 0.183, 0.105, 0.134, Inf
SWC 0.963, 0.957, 0.952, 0.200 0.732, 0.826, 0.788, -0.025
The data above the diagonal are Nm; the data below the diagonal are FST; Data from left to right represent
COI, COII, Cytb genes and ITS2 region, respectively.
doi:10.1371/journal.pone.0159557.t003
Fig 5. Bayesian phylograms based on ITS2 region sequences obtained fromG.birmanicasamples.
Blue indicates haplotypes from northeastern China (NEC) region.
Mountain; whereas the CC-NC-SC and SWC regions are demarcated by the Wu Mountain and Xuefeng Mountain, respectively. Concerning its nonmigratory character,G.birmanicahas limited dispersal ability; e.g., normally 15–20 m under favorable conditions [4]. It is also Table 4. Description of the scenarios used in the approximate Bayesian.
COI COII Cytb
Steps Scenario Posterior probability
95% CI (lower-upper)
Scenario Posterior probability
95% CI (lower-upper)
Scenario Posterior probability
95% CI (lower-upper)
Step1 1 0.0004 (0.0000, 0.8308) 1 0.0555 (0.0000, 0.4407) 1 0.1456 (0.0873, 0.2039)
2 0.0057 (0.0000, 0.8326) 2 0.0199 (0.0000, 0.4211) 2 0.0498 (0.0000, 0.1109)
3 0.7377 (0.4770, 0.9983) 3 0.5784 (0.3088, 0.8479) 3 0.3613 (0.2848, 0.4378)
4 0.1872 (0.0000, 0.9068) 4 0.1436 (0.0000, 0.4952) 4 0.1170 (0.0611, 0.1729)
5 0.0652 (0.0000, 0.8509) 5 0.0908 (0.0000, 0.4590) 5 0.2045 (0.1441, 0.2649)
6 0.0038 (0.0000, 0.9628) 6 0.1118 (0.0000, 0.6211) 6 0.1218 (0.0241, 0.2195)
Step2 1 0.6342 (0.4240, 0.8444) 1 0.5630 (0.3992, 0.7269) 1 0.5965 (0.4562, 0.7367)
2 0.3658 (0.1556, 0.5760) 2 0.4370 (0.2731, 0.6008) 2 0.4035 (0.2633, 0.5438)
Computation analysis in DIYABC to test the source and the differentiation time among species. The relative posterior probabilities and 95% confidence intervals for each scenario were computed via the logistic regression on 1% of the closest data sets to the observed data.
doi:10.1371/journal.pone.0159557.t004
Fig 6. Potential distribution ofG.birmanicaunder (A) current, (B) last glacial maximum (LGM) and (C) last interglacial (LIG) climate conditions. Maps were created using Esri’s ArcGIS platform (http://www.esri.com/software/arcgis).
important to consider that a greater degree of genetic diversity may be related to a longer evo-lutionary history. High mitochondrial haplotypic diversity contrasting with lower of the ITS2 was also reported in many insects, such asAnopheles funestus[59] and mite species [60], which might due to low selective pressure or concerted evolution on ITS region [61,62].
Based on analyses of three mtDNA sequences using AMOVA, phylogenetic tests, and hap-lotyping, we conclude thatG.birmanicahas three genetically-diverse, geographically-localized clades in China; these are the NEC, CC-NC-SC and SWC clades. According to AMOVA, more than 75% of the variability was observed between these three regions with some differences arising between populations based on the three mtDNA genes; this indicates that the three groups have infrequent gene flow and are distinct entities. Thus it is tempting to hypothesize that the natural barriers present in the study area (Yellow River and the Yanshan Mountain, Wu Mountain, and Xuefeng Mountain) may deter or limit gene flow; whereas gene flow in the CC-NC-SC region was frequent. Similar results have been obtained for theChilo suppressalis
[63], where rivers and mountains function as effective barriers to gene flow. More importantly, this pattern may be related to events that occurred in the Late Pleistocene (75,000–130,000 years ago), when geographic events occurred that caused separate populations to arise within species [64]. However, no obvious lineages obtained and most of the variability was observed were within populations based on ITS2 ribosomal DNA, which may be due to its conserved character.
Based on a proposed standard rate of 2.3% divergence per million years (My) for the insect mitochondrial genome [65] (But rate of divergence for ITS region was unknown), the coales-cence time (equated with the onset of demographic or range expansion) forCOI,COII, and Fig 7. Observed and simulated mismatch distributions of entire samples.Sequence data are shown for (A) COI; (B)COII; (C)Cytband (D) ITS2 region. The horizontal axis represents the number of pairwise differences, and the vertical axis shows relative frequency.
Cytbin the CC-NC-SC region is about 113,900 (τ= 4.387 mutation units), 28,800 (τ= 0.902
mutation units) and 126,500 years (τ= 2.689 mutation units), respectively. Due to the lower
number of sample sites in the NEC and SWC regions and reduced haplotype diversity, diver-gence times in these two regions could not be accurately predicted.
Analyses of theFSstatistics in the three groups and mismatch distribution of the CC-NC-SC
region suggested that the CC-NC-SC group may have undergone population expansion, whereas the NEC and SWC regions may have experienced recent bottlenecks. This may have occurred because theG.birmanicapopulation did not adapt to the local habitat and climate changes, especially in the colder NEC region. The contention that the beetle species underwent population expansion is consistent with the observation that median-joining networks for the three mtDNA genes and ITS2 region have a distinct star-like structure, which is typical of demographic expansion. This structure is particularly obvious in the CC-NC-SC group, and haplotypes from the NEC and SWC regions are derived from a subset of the CC-NC-SC group that is the ancient mtDNA haplotype4s (H4s) and ITS2 haplotype 6 and 11 are derived from this group. In addition, the scenario tests based on ABC method revealed that the CC-NC-SC area is the most likely origin of the beetle in China. Coupled with this area acted as refugia dur-ing glacial period, therefore, we speculate that the water chestnut beetle originated in the lower, central reaches of the Yangtze River Basin. What’s more, populations at the center of origin generally exhibit the greatest variation, which is consistent with the perspective that ancestral populations possess higher genetic diversity than derived populations [66]. The larger genetic variation in the CC-NC-SC geographical region also supported our speculation.
Fig 8. Observed and simulated mismatch distributions of the CC-NC-SC group.Sequence data are shown for (A)COI; (B)COII; (C)Cytband (D) ITS2 region. The horizontal axis represents the number of pairwise differences, and the vertical axis represents the relative frequency.
Water chestnut beetles are likely to have co-evolved with the host plant, water chestnut; thus, it has been suggested that the insect and pest share a common origin, which we speculate is located in the lower, central region of the Yangtze River Basin. Recent studies suggest that the Yangtze Valley is a potential center of origin for domesticated, aquatic vegetables [22,23, 67], rice [68,69] and dog [70,71]. As pointed out in the introduction, the origin of water chest-nut is unclear and both Asia and Europe are potential geographical origins. There are numer-ous species and variants ofT.natansin Asia, including wildT.natans,T.japonicum,
domesticatedT.bicornisandT.bispinosa. In China, 15 species and variants of water chestnut have been identified, whereas only wildT.natansoccurs in Europe and North America. Fur-thermore, water chestnut is now considered an endangered species in Europe and Russia [14]. These differences in biogeography compel us to speculate that the introduction or occurrence of water chestnut is more recent in Europe. More importantly, analysis of Neolithic (3,300 to 2,800 BC) sediment collected from archeological sites in the village of Pannala, southern Fin-land, revealed that the dominant aquatic plant in lake basins was water chestnut, along with species ofPotamogeton,Nymphaea, andNuphar, which also have a floating leaf habit [72]. However, archaeological evidence for water chestnut in Zhejiang, China, was documented 20,000–30,000 years ago based on geological exploration 78 meters underground [22]. It is also important to mention the discovery of charred water chestnuts at the Hemudu archaeological site in the 1970s as these were estimated to be over 7,000 years old [21]. A similar finding was made at the Majiabang site where carbonized water chestnuts approximately 6,000 years old were discovered [20]. Furthermore, the Taihu Basin in the lower, central reaches of the Yangtze River is regarded by some researchers as a center of origin for water chestnut [10,19]. In Chi-nese history, reference to water chestnuts occurs many times in ancient literature; e.g.“Zhou Li”(300 BC) and“Guo Yu”(400 BC). Poems about water chestnuts were also popular in ancient China, including the Tang and Song dynasties. When combined with our statistical analysis of the water chestnut beetle’s divergence time (113,900–126,500 years ago), we specu-late that water chestnuts have existed in China for a much longer period of time than Europe. Our studies do not exclude Europe as an origin for water chestnut, because we have not system-atically studied the demographic history ofT.natanson a global scale. However, based on our work with the beetle and archaeological findings, we believe that the lower, central region of Fig 9. Inferred dispersal route of the water chestnut beetle,G.birmanica(arrow shows the direction of dispersal from the proposed origin).Maps were created using Esri’s ArcGIS platform (http://www.esri. com/software/arcgis).
the Yangtze River basin is one of origin centers forT.natans. We show a proposed expansion route for the water chestnut beetle (G.birmanica) inFig 9; furthermore, we hypothesize that the beetle likely followed the expansion and distribution ofT.natansin the Late Pleistocene. Our study provides insight into the origin of water chestnut by examining population genetics of its pest, water chestnut beetle. Our results suggest that the lower, central region of the Yang-tze River basin is one of the potential origin centers for the beetle, and we speculate that this dispersal was concordant with the host plant. Most importantly, we provide a plant-insect co-evolutionary system example on revealing the origin and dispersal history of a pest insect and its host.
Supporting Information
S1 Table. Sampling information.
(DOC)
S2 Table. Genetic diversity indices for each population.
(DOC)
S3 Table. Estimates of FSTand gene flow (Nm) for pairs of each population based onCOI gene.
(DOC)
S4 Table. Estimates of FSTand gene flow (Nm) for pairs of each population based onCOII gene.
(DOC)
S5 Table. Estimates of FSTand gene flow (Nm) for pairs of each population based onCytb gene.
(DOC)
Acknowledgments
We thank Dr. Carol Bender for polishing our manuscript. We express our deep gratitude to the Testing Center of Yangzhou University.
Author Contributions
Conceived and designed the experiments: YZD MXL. Performed the experiments: XTT FSZ JQ. Analyzed the data: XTT FSZ. Wrote the paper: XTT FSZ.
References
1. Lu ZQ, Zhu J, Zhu SD, & Chen ZD. Preliminary studies on the beetle (Galerucella birmanicaJacoby)–
an insect pest of water chestnut and water shield. Scientia Agricultura Sinica. 1984; 5: 73–76.
2. Zheng FS. Population ecology of water chestnut beetle, Gallerucella birmanica Jacoby. Master Disser-tation of Yangzhou University. 2007.
3. Yadav HS, & Gargav VP. Studies on the biology of singhara beetle,Galerucella birmanicaJacoby on Trapa bispinosaRoxb. J Insect Sci. 1992; 5: 206–208.
4. Singh RB, Tripathi PN, & Prakash S. Studies on neuroendocrine system of Singhara beetle,Galerucella birmanica(Coleoptera: Chrysomelidae). Journal of Experimental Zoology, India. 2013; 16: 229–234.
5. Fan H, Wang Y, Li J, & Zhang G. Exposure to males reduces the benefit gained from multiple mating in femaleGalerucella birmanicaJacoby (Coleoptera: Chrysomelidae). Behav Ecol Sociobiol. 2015; 69: 109–116.
7. Zheng FS, Du YZ, Lu YY, Qiang CK, & Ding JQ. Spatial distribution pattern of water chestnut beetle (Galerucella birmanicaJacoby). Chinese Journal of Eco-Agriculture. 2006; 4: 045.
8. Zheng FS, Du YZ, Wang ZJ, & Xu JJ. Effect of temperature on the demography ofGalerucella birma-nica(Coleoptera: Chrysomelidae). Insect Sci. 2008; 15: 375–380.
9. Yadav HS, & Gargav VP. Chemical Control of Singhara Beetle,Galerucella BirmanicaJacoby. Indian Journal of Plant Protection. 1988; 16: 159–162.
10. Ding JQ, Blossey B, Du YZ, & Zheng FS.Galerucella birmanica(Coleoptera: Chrysomelidae), a promis-ing potential biological control agent of water chestnut,Trapa natans. Biol Control. 2006a; 36: 80–90.
11. Ding JQ, Wang Y, & Jin X. Monitoring populations ofGalerucella birmanica(Coleoptera: Chrysomeli-dae) onBrasenia schreberiandTrapa natans(Lythraceae): Implications for biological control. Biol Con-trol. 2007; 43: 71–77.
12. Pemberton RW. Biological Control of Invasive Plants in the Eastern United States. In: van Driesche R, Blossey B, Hoddle M, Lyon S, & Reardon R, editors. 2002. pp. 33–40.
13. Muenscher WC. Aquatic Plants of the United States, New York: Cornell University Press; 1944.
14. Hummel M, & Kiviat E. Review of world literature on water chestnut with implications for management in North America. J Aquat Plant Manage. 2004; 42: 17–27.
15. Hummel M, & Findlay S. Effects of water chestnut (Trapa natans) beds on water chemistry in the tidal freshwater Hudson River. Hydrobiologia. 2006; 559: 169–181.
16. Ding JQ, Blossey B, Du YZ, & Zheng FS. Impact ofGalerucella birmanica(Coleoptera: Chrysomelidae) on growth and seed production ofTrapa natans. Biol Control. 2006b; 37: 338–345.
17. Singh GD, Bawa AS, Singh S, & Saxena DC. Physicochemical, pasting, thermal and morphological characteristics of Indian water chestnut (Trapa natans) starch. Starch‐Stärke. 2009; 61: 35–42.
18. Khanum R, Mumtaz AS, & Kumar S. Predicting impacts of climate change on medicinal asclepiads of Pakistan using Maxent modeling. Acta Oecol. (Montrouge) 2013; 49: 23–31.
19. Chen RD. Thoughts on the Water Environment and Ecological Agriculture in Taihu Drainage Area. Ancient and Modern Agriculture. 2005; 2: 1–10.
20. Yao ZY, & Mei FG. Excavation in Zhejiang Jiaxing Majiabang Site. Archaeology. 1961.
21. Chen WH. Map of agricultural scientific and technological development in ancient China. Beijing: Agri-culture press; 1991.
22. You XL. Talk about water chestnut. Ancient and Modern Agriculture. 1993; 4: 68–72.
23. Luo GH. Cultivation History of Arrowhead (Sagittaria sagittifolia) and Some Other Aquatic Crops. Ancient and Modern Agriculture. 2005; 1: 26–34.
24. Countryman WD. The history, spread and present distribution of some immigrant aquatic weeds in New England. Hyacinth Control J. 1970; 8: 50–52.
25. Ehrlich PR, & Raven PH. Butterflies and plants: a study in coevolution. Evolution. 1964; 586–608.
26. Musser RO, Hum-Musser SM, Eichenseer H, Peiffer M, Ervin G, Murphy JB, et al. Herbivory: caterpillar saliva beats plant defences. Nature. 2002; 416: 599–600. PMID:11948341
27. Wheat CW, Vogel H, Wittstock U, Braby MF, Underwood D, Mitchell-Olds T. The genetic basis of a plant–insect coevolutionary key innovation. Proc Natl Acad Sci USA. 2007; 104: 20427–20431. PMID: 18077380
28. Poelman EH, Broekgaarden C, Van Loon JJ, & Dicke M. Early season herbivore differentially affects plant defence responses to subsequently colonizing herbivores and their abundance in the field. Mol Ecol. 2008; 17: 3352–3365 doi:10.1111/j.1365-294X.2008.03838.xPMID:18565114
29. Cavalier-Smith T. Predation and eukaryote cell origins: a coevolutionary perspective. Int J Biochem Cell B. 2009; 41: 307–322.
30. Wilfert L, & Jiggins FM. Host–parasite coevolution: genetic variation in a virus population and the inter-action with a host gene. J Evolutiona Boil. 2010; 23: 1447–1455.
31. Janz N. Ehrlich and Raven revisited: mechanisms underlying codiversification of plants and enemies. Annu Rev Ecol Evol S. 2011; 42: 71.
32. Ali JG, & Agrawal AA. Specialist versus generalist insect herbivores and plant defense. Trends Plant Sci. 2012; 17: 293–302. doi:10.1016/j.tplants.2012.02.006PMID:22425020
33. Xiao JH. Wang NX, Murphy RW, Cook J, Jia LY, Huang DW.Wolbachiainfection and dramatic intra-specific mitochondrial DNA divergence in a fig wasp. Evolution. 2012; 66: 1907–1916. doi:10.1111/j. 1558-5646.2011.01561.xPMID:22671555
35. Agnarsson I, Avilés L, Maddison WP. Loss of genetic variability in social spiders: genetic and phyloge-netic consequences of population subdivision and inbreeding. J Evol Biol. 2013; 26: 27–37. doi:10. 1111/jeb.12022PMID:23145542
36. Kitson JJ, Warren BH, Vincent Florens FB, Baider C, Strasberg D, Emerson BC. Molecular characteri-zation of trophic ecology within an island radiation of insect herbivores (Curculionidae: Entiminae: Cra-topus). Mol Ecol. 2013; 22: 5441–5455. doi:10.1111/mec.12477PMID:24112379
37. Norris LC, Norris DE. Phylogeny of anopheline (Diptera: Culicidae) species in southern Africa, based on nuclear and mitochondrial genes. J Vector Ecol. 2015; 40: 16–27. doi:10.1111/jvec.12128PMID: 26047180
38. Simon CF, Frati A, Beckenbach B, Crespi H, Liu H, & Flook P. Evolution, weighting, and phylogenetic utility of mitochondrial gene sequences and a compilation of conserved polymerase chain reaction primers. Ann Entomol Soc Am. 1994; 87: 651–701.
39. Gómez-Zurita J, Juan C, & Petitpierre E. The Evolutionary History of theGenus Timarcha(Coleoptera, Chrysomelidae) Inferred from Mitochondrial COII Gene and Partial 16S rDNA Sequences. Mol Phylo-genet Evol. 2000; 14: 304–317. PMID:10679162
40. White TJ, Bruns T, Lee S, & Taylor J. Amplification and direct sequencing of fungal ribosomal RNA genes for phylogenetics. PCR protocols: a guide to methods and applications. 1990; 18: 315–322.
41. Chenna R, Sugawara H, Koike T, Lopez R, Gibson TJ, Higgins DG, et al. Multiple sequence alignment with the Clustal series of programs. Nucleic acids res. 2003; 31: 3497–3500. PMID:12824352
42. Librado P, & Rozas J. DnaSP v5: a software for comprehensive analysis of DNA polymorphism data. Bioinformatics. 2009; 25: 1451–1452. doi:10.1093/bioinformatics/btp187PMID:19346325
43. Dupanloup I, Schneider S, & Excoffier LA. Simulated annealing approach to define the genetic structure of populations. Mol Ecol. 2002; 12: 2571–2581.
44. Excoffier L, & Lischer HEL. Arlequin suite ver 3.5: a new series of programs to perform population genetics analyses under Linux and Windows. Mol Ecol Resour. 2010; 10: 564–567. doi:10.1111/j. 1755-0998.2010.02847.xPMID:21565059
45. Takahata N, & Palumbi SR. Extranuclear differentiation and gene flow in the finite island modal. Genet-ics. 1985; 109: 441–457. PMID:17246255
46. Ronquist F, & Huelsenbeck JP. MrBayes 3: Bayesian phylogenetic inference under mixed models. Bio-informatics. 2003; 19: 1572–1574. PMID:12912839
47. Guindon S, & Gascuel O. A simple, fast, and accurate algorithm to estimate large phylogenies by maxi-mum likelihood. Syst boil. 2003; 52: 696–704.
48. Guindon S, Lethiec F, Duroux P, & Gascuel O. PHYML online-a web server for fast maximum likeli-hood-based phylogenetic inference. Nucleic acids res. 2005; 33: W557–W559. PMID:15980534
49. Posada D, Buckley TR. Model selection and model averaging in phylogenetics: advantages of Akaike information criterion and Bayesian approaches over likelihood ratio tests. Syst Biol. 2004; 53: 793–
808. PMID:15545256
50. Rambaut A. 2009. FigTree Version 1.3.1. Available:http://tree.bio.ed.ac.uk/software/figtree/. Accessed 2011 April 1.
51. Bandelt HJ, Forster P, & Rohl A. Median-joining networks for inferring intraspecific phylogenies. Mol Biol Evol. 1999; 16: 37–48. PMID:10331250
52. Cornuet JM, Pudlo P, Veyssier J, Dehne-Garcia A, Gautier M, Leblois R, et al. DIYABC v2.0: a software to make approximate Bayesian computation inferences about population history using single nucleo-tide polymorphism, DNA sequence and microsatellite data. Bioinformatics. 2014; 30: 1187–1189.
53. Phillips SJ, Anderson RP, & Schapire RE. Maximum entropy modeling of species geographic distribu-tions. Ecol Modell. 2006; 190: 231–259.
54. Hijmans RJ, Cameron SE, Parra JL, Jones PG, & Jarvis A. Very high resolution interpolated climate surfaces for global land areas. Int J Climatol. 2005; 25: 1965–1978.
55. Khan TA, Nazir M, & Khan EA. Adsorptive removal of rhodamine B from textile wastewater using water chestnut (Trapa natansL.) peel: adsorption dynamics and kinetic studies. Toxico Enviro Chem. 2013; 95: 919–931.
56. Slatkin M, & Hudson RR. Pairwise Comparisons of Mitochondrial DNA Sequences in Stable and Expo-nentially Growing Populations. Genetics. 1991; 129: 555–562. PMID:1743491
57. Dynesius M, & Jansson R. Evolutionary consequences of changes in species' geographical distribu-tions driven by milankovitch climate oscilladistribu-tions. Proc Natl Acad Sci USA. 2000; 16: 9115–9120.
59. Mukabayire O, Boccolini D, Lochouarn L, Fontenille D, & Besansky N. Mitochondrial and ribosomal internal transcribed spacer (ITS2) diversity of the African malaria vectorAnopheles funestus. Mol Ecol. 1999; 8: 289–297. PMID:10065543
60. Navajas M, & Boursot P. Nuclear ribosomal DNA monophyly versus mitochondrial DNA polyphyly in two closely related mite species: the influence of life history and molecular drive. P Roy Soc B- Biol Sci. 2003; 270: S124–S127.
61. Hillis DM, Moritz C, Porter CA, & Baker RJ. Evidence for biased gene conversion in concerted evolution of ribosomal DNA. Science. 1991; 251: 308–310. PMID:1987647
62. Szalanski AL, Austin JW, McKern JA, Steelman CD, & Gold RE. 2008. Mitochondrial and ribosomal internal transcribed spacer 1 diversity ofCimex lectularius(Hemiptera: Cimicidae). J Med Entomol. 45: 229–236. PMID:18402138
63. Meng XF, Shi M, & Chen XX. Population genetic structure ofChilo suppressalis(Walker) (Lepidoptera: Crambidae): strong subdivision in China inferred from microsatellite markers and mtDNA gene sequences. Mol Ecol. 2008; 17: 2880–2897. doi:10.1111/j.1365-294X.2008.03792.xPMID:18482260
64. Avise JC, Walker D, & Johns GC. Speciation durations and Pleistocene effects on vertebrate phylogeo-graphy. P Roy Soc B- Biol Sci. 1998; 265: 1707–1712.
65. Brower AVZ. Rapid morphological radiation and convergence among races of the butterflyHeliconius eratinferred from patterns of mitochondrial-DNA evolution. Proc Natl Acad Sci USA. 1994; 91: 6491–
6495. PMID:8022810
66. Savolainen P, Zhang YP, Luo J, Lundeberg J, & Leitner T. Genetic evidence for an East Asian origin of domestic dogs. Science. 2002; 298: 1610–1613. PMID:12446907
67. Ye JY. Cultivation History of Aquatic Crops. Ancient and Modern Agriculture. 1992; 1: 13–22.
68. Molina J, Sikora M, Garud N, Flowers JM, Rubinstein S, Reynolds A, et al. Molecular evidence for a sin-gle evolutionary origin of domesticated rice. Proc Natl Acad Sci USA. 2011; 108: 8351–8356. doi:10. 1073/pnas.1104686108PMID:21536870
69. Gross BL, & Zhao Z. Archaeological and genetic insights into the origins of domesticated rice. Proc Natl Acad Sci USA. 2014; 111: 6190–6197. doi:10.1073/pnas.1308942110PMID:24753573
70. Leonard JA, Wayne RK, Wheeler J, Valadez R, Guillén S, & Vila C. Ancient DNA evidence for Old World origin of New World dogs. Science. 2002; 298: 1613–1616. PMID:12446908
71. Pang JF, Kluetsch C, Zou XJ, Zhang AB, Luo LY, Angleby H. mtDNA data indicate a single origin for dogs south of Yangtze River, less than 16,300 years ago, from numerous wolves. Mol Biol evol. 2009; 26: 2849–2864. doi:10.1093/molbev/msp195PMID:19723671