A New Approach of Power System Protection Based on Wavelet
Transformation
EID Gouda
1, MOHAMED S. Hasan
21
University of Mansoura, Egypt,
Department of Electrical Engineering, Faculty of Engineering, Dakahlia, 35516 Mansoura, Egypt, E-Mail1: [email protected]
2 University of Mansoura, Egypt,
Department of Electrical Engineering, Faculty of Engineering,
Dakahlia, 35784 Mansoura, Egypt, E-Mail2: [email protected]
Abstract – Wavelet transformation has been used in many protection applications such as transmission lines, transformers and generators protection. In the previous researches, the technique of wavelet protection was applied only to protect one element of the power system, but in this paper, the wavelet protection method is modified to protect the whole elements of a proposed power system in the same time, the proposed power system consists of a transmission line that connects two generation bus bars. The proposed system is divided into three protection zones; two zones for the two generation bus bars and one zone for the transmission line. Recorded current samples of the two ends of the transmission line are obtained by matlab simulink then fed to the wavelet based detector and classifier machine to check the health of the whole power system through the approximate coefficients of the recorded signals, once a fault occurs at any of the zones, the based protection technique detects, classifies and determines the zone of fault through the detail coefficients of the current signal modal components.
Keywords: Protection; wavelet; approximate coefficient; detail coefficient; Matlab.
I. INTRODUCTION
Your Protection of power systems is an essential issue that has been and remains a major subject in the electrical power researches. Power system components like generators, transformers and transmission lines are exposed to internal and external faults which can cause destructions to these components, that’s why researchers in the field of electrical protection aim to develop protection systems that achieve more accuracy and reliability [1]. Wavelet transformation has been used in many protection applications. P. Rajaraman et al. [2] proposed an algorithm for identification and classification of faults on transmission lines, K. Ramesh et al. [3] presented a novel technique for power transformer protection, C. M. S. Neto et al. [4] proposed an algorithm for synchronous generator protection and
Jamal Moshtagh et al. [5] proposed a new approach to fault location in three-phase underground distribution system using combination of wavelet analysis with ANN and FLS. In the previous researches, the technique of wavelet protection was used only to protect one element of the power system elements, but in this paper, the wavelet protection method is modified to protect the whole elements of a proposed power system consists of a transmission line that connects two generation bus bars. In this paper, Daubechies four (db4-level 1) is suggested to be used in wavelet transformation. wavelet transformation has the following multi tasks:
1) The first task is continuously checking the health of the three zones of the proposed power system as shown in Fig. 1, by comparing the absolute peak value of the approximate coefficient with the threshold value.
2) Once a fault occurred at any zone of the power system, the second task is to detect and locate the zone of the fault.
3) The third task is to classify the type of fault, whether the fault is line to ground, line to line, double line to ground or three lines to ground. If the detected fault in the transmission line zone, travelling waves method based on wavelet transformation is used to determine how far the distance of the fault from each bus bar [6].
II. WAVELET ANALYSIS
another approximate and detail coefficients as shown in Fig. 1, where A1, A2 and A3 are approximation coefficients (ApCo) of the decomposed signal at level 1, 2 and 3. Similarly D1, D2 and D3 are detail coefficients (DeCo) of the decomposed signal at level 1, 2 and 3
.
Fig. 1. Multi levels signal decomposition through high pass
and low pass filter.
III. STUDIED POWER SYSTEM
The considered power system in this paper consists of two generation bus bars connected together through a transmission line as shown in Fig. 2. Global positioning system (GPS) is used as a standard reference to ensure the accuracy of time of the travelling waves at each bus bar. The studied system is divided into three zones of protection; zone1 for generation bus1, zone2 for generation bus2 and zone3 for transmission line. Current signals at each bus bar are continuously recorded then fed to its wavelet based detector and classifier machine.
Fig. 2. Three protection zones of the studied power system.
IV. THRESHOLDS DETERMINATION
Threshold values are pre-decided values which are calculated based on the parameters of the studied system, these values differ from system to another due to the difference of each system parameters and configurations[8][9][10]. To obtain the threshold value for a specific type of system fault, normal and fault cases have to be studied; threshold line separates the normal and fault cases as shown in Fig. 3 . Threshold line is determined at the upper border of normal case and the bottom of fault case. It’s essential to determine the different thresholds values (T3Ln, TLGn, TLLGn, TLLn,
and TP) for each zone, where n is the zone index, T3L is
the three line to ground threshold, TLG is the line to
ground threshold, TLLG is the double lines to ground
threshold, TLL is the double lines fault threshold and TP
is travelling waves first peaks difference threshold. Thresholds values help to determine and classify the fault and its zone accurately.
Fig. 3. Threshold line is the border line between normal and
fault case.
Zone1 and zone2 have the same fault currents. Different types of faults are measured for zone1 and zone2 at different inception angles as shown in Fig. 4, Fig. 5, Fig. 6 and Fig. 7.
Fig. 4. Threshold of three lines to ground faultfor zone1
Fig. 5. Threshold of double lines to ground fault for zone1
Fig. 6. Threshold of line to line fault for zone1
Fig. 7. Threshold of line to ground faultfor zone1
Amplitude
Zone1 Bus1 Zone3 Bus2 Zone2
Wavelet based detector & classifier
Wavelet based detector & classifier Communication
Channel
TLLG1 Line
TLL1 Line
TLG1 Line
T3L1 Line
Time Fault case
Normal case
!" # !! # !!" # !!! # !" #
$%
$%
$%
$%
$%
$%
$%
$%
$%
$% $%
$% $% $%
$% $% $%
$%
$% $% $% $% $% $% $% $% $%
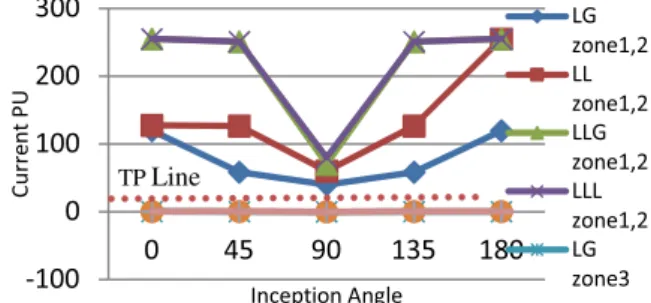
Fig. 8. Peak difference threshold (TP) of different fault at zone 1, 2, 3.
The peak difference threshold (TP) value is very important to be determined for the three zones and then a suitable peak threshold must be chosen. Fig. 8 Illustrates the peak difference between the absolute first peak of traveling wave at bus1and absolute first peak of traveling wave at bus2 of different faults at different inception angles.
Similarly for transmission line zone, three lines to ground double line to ground, line to line and line to ground faults values are measured for zone 3 at different inception angles and different distances at transmission line as shown in Fig. 9, Fig. 10, Fig. 11 and Fig. 12.
Fig. 9. Threshold of three lines to ground fault at zone 3.
.
Fig. 10. Threshold of double lines to ground fault at zone 3.
Fig. 11. Threshold of line to line fault at zone 3.
Fig. 12. Threshold of line to ground fault at zone 3.
After calculating the thresholds values (TLGn, TLLn,
TLLGn & T3Ln), the next step is to develop general values
of thresholds that would satisfy the whole system, by choosing the minimum value of thresholds for each type of fault among the three zones as shown in equation (1), (2), (3) & (4).
The peak difference when zone1or zone2 are faulty is much greater than when zone3 is faulty. From Fig. 8, the peak difference for transmission line is almost a straight line near zero unlike the peak difference at zone1, 2. The peak difference threshold value for the recent system is 1. The fault resistance effect has been investigated by different researchers like CH Kim, H Kim[11] and found out that wavelet technique is majorly deals with the resultant faults waves and not with the faults resistances.
However, this paper focuses on a very specific case study to verify the idea of the work, but in the future work, the system would be more complex with more
$% $% $% $% $% $% $% $% $%
T3L3 Line
TLLG3 Line
TLL3 Line
TPLine
TLG3 Line
Fig. 13. Flowchart to detect, classify determine zone fault of a
power system
than two bus bars, in addition to that, the effect of tap changer transformers will be studied, and also the fault resistance will be taking into account.
V. PROPOSED PROTECTION ALGORITHM
Parameters of the proposed system are available at appendix (A).For the proposed system, if any fault occurs at any zone; both of the current recorders will measure the fault currents then send it to its wavelet
based detector and classifier machine to be processed by Daubechies-4 (db4-level 1) to get the absolute peak value of ApCo, if the absolute peak is greater than T3L,
TLLG, TLL or TLG, then a system fault is detected. Next
step is to locate the zone of the fault, but first, the current samples have to be turned into their modal component to obtain the detail coefficient (D) which will be used to locate the fault zone. Depending on the travelling waves’ theory, the fault wave travels through the system with a certain speed [12]:
Last step is to classify the fault type. This step is parallelly processed with the previous step so that while the system is locating the fault, it also classifies the fault type. The flowchart at Fig. 13 describes the previous metioned protection steps. Wavelet detectors at both ends of transmission line measure the wave arrival time (TB1) and (TB2). Three cases are needed to be studied:
Case 1: fault at zone1, the fault wave will travel passing wavelet based detector at bus1, then continue travelling through transmission line with LTL length till it
reaches wavelet based detector at bus 2 as shown in Fig. 14. It's noted that the time of the travelling wave to reach bus1 (TB1) is very small almost zero because fault is so close to bus1, while time of the travelling wave to reach bus2 (TB2) is much larger and can be calculated from equation (2):
Case 2: fault at zone2, the fault wave will travel passing wavelet based detector at bus2, then continue travelling
Yes
NO
NO
Yes
!"#$ #
If abs.wave peaks difference at Bus1 &Bus2 >TP
&TB2<TB1
Zone 2 fault
Transmission line fault
Location of Transmission line fault
Zone 1 fault
3 lines to ground fault
Line to line to ground
Line to ground fault
Line to line fault Yes
NO
NO NO
Yes
Yes
Fault classification
If L1&L2& L3> T3L
If only 2 lines> TLLG
If other line, >TLL Yes
Read Currents samples at bus1 and bus2
Signal processing by WT (db-4) level 1
Fault location
Get (DeCo) Of Modal transformation of current samples
If abs.wave peaks difference at Bus1 &Bus2 >TP &TB2>TB1
Start
Get approximation coefficient (ApCo)
If absolute peak values of (ApCo) >
TLG,TLL,TLLG, T3L
Fig. 14. Travelling wave of system fault at zone 1
through transmission line till it reaches wavelet based detector at bus1 as shown in Fig. 15. It's noted that the time of the travelling wave to reach bus2 (TB2) is very small almost zero because the fault is so close to bus2, while time of the travelling wave to reach bus1 (TB1) is much larger and can be calculated from equation (3):
%
Fig. 15. Travelling wave of system fault at zone 2
Case 3: fault at zone 3, the fault wave will travel in both directions towards wavelet based detector at bus 1 and wavelet based detector at bus 2 as shown in Fig. 16. It's noted that the time of the travelling wave to reach bus2 (TB2) and the time of the travelling wave to reach bus1 (TB1) can be calculated from equation (7), (8):
&'(
) &'*
+
Fig. 16. Travelling wave of system fault at zone 3
Where LFB1 and LFB2 are fault distance from bus 1 and
bus 2 respectively. It’s very important to determine the distance of fault for rapid restoration of the power source in addition to economical loss decreasing, (TB1) and (TB2) in case of transmission line fault are used to determine the fault distance as follows[13]:
, -.-#/.012.033 14
VI. MODAL TRANSFORMATION
In three phase transmission lines, traveling waves are mutually coupled, so there is no single traveling wave velocity. The phase domain signals are decomposed into their modal components by using modal Karrenbauer transformation[14]as following:
56687
69
: ; # < < #= ;
6> 6? 6@
=
VII. PROPOSED SYSTEM MODELLING AND RESULTS
There are two conditions for locating fault at zone1; i- Time of the traveling wave to reach bus1
(TB1) will be much smaller than time of the traveling wave to reach bus (TB2). ii- The peak difference between the absolute
first peak of traveling wave at bus1and absolute first peak of traveling wave at bus2 is greater than the peak difference threshold value (TP).
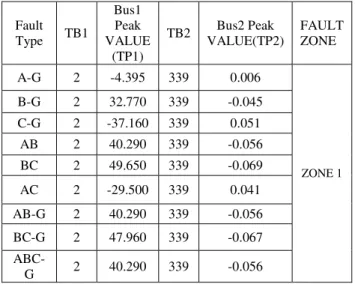
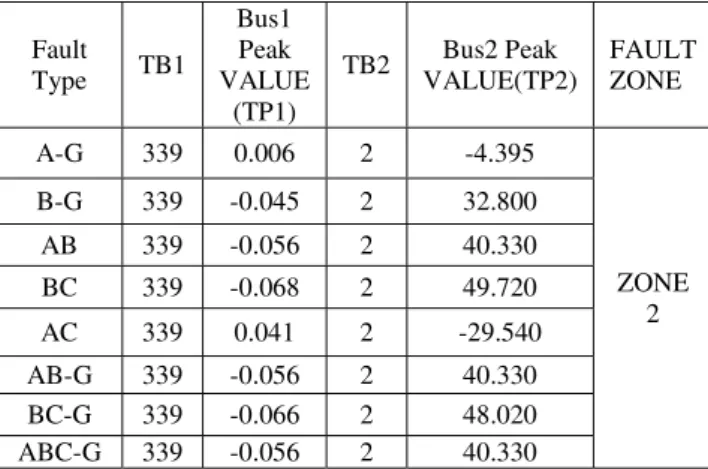
Results of various types of faults at zone1 are shown in Table 1. Similarly, for the second studied case, various types of faults at zone2 are detected, classified and zone located by the same steps followed in the previous case as shown in Table 2. Two condition for locating fault at zone2;
i- Time of the traveling wave to reach bus2 (TB2) will be much smaller than time of the traveling wave to reach bus1 (TB1). ii- The peak difference between the absolute
first peak of traveling wave at bus1and absolute first peak of traveling wave at bus2 is greater than the peak difference threshold value (TP).
TABLE 1. Analysis of different faults types at zone1
Fault Type TB1
Bus1 Peak VALUE
(TP1)
TB2 Bus2 Peak VALUE(TP2)
FAULT ZONE
A-G 2 -4.395 339 0.006
ZONE 1
B-G 2 32.770 339 -0.045
C-G 2 -37.160 339 0.051
AB 2 40.290 339 -0.056
BC 2 49.650 339 -0.069
AC 2 -29.500 339 0.041
AB-G 2 40.290 339 -0.056
BC-G 2 47.960 339 -0.067
ABC-G 2 40.290 339 -0.056
F
Zone1 Bus1 Zone3 Bus2 Zone2
Wavelet based detector & classifier
Wavelet based detector & classifier Communication
Channel
Travelling waves
Zone1 Bus1 Zone3 Bus2 Zone2
Wavelet based detector & classifier
Wavelet based detector & classifier Communication
Channel
F Travelling waves
Zone1 Bus1 Zone3 Bus2 Zone2
Wavelet based detector & classifier
Wavelet based detector & classifier Communication
Channel
Travelling wave
TABLE 2. Analysis of different faults types at zone2
Fault Type TB1
Bus1 Peak VALUE
(TP1)
TB2 Bus2 Peak VALUE(TP2)
FAULT ZONE
A-G 339 0.006 2 -4.395
ZONE 2
B-G 339 -0.045 2 32.800
AB 339 -0.056 2 40.330
BC 339 -0.068 2 49.720
AC 339 0.041 2 -29.540
AB-G 339 -0.056 2 40.330
BC-G 339 -0.066 2 48.020
ABC-G 339 -0.056 2 40.330
TABLE 3. Fault distance calculation at transmission Line from Bus1.
For the third studied case, faults at zone3 , If the fault occurs at the right half of transmission line, then TB1 > TB2, If the fault occurs at the left half of transmission line, then TB1 < TB2, peak difference between the absolute first peak of traveling wave at bus1and absolute first peak of traveling wave at bus2 is smaller than the peak difference threshold value (TP). Fault distance can be calculated from equation (10) as shown in Table 3.
VIII. CONCLUSION
Wavelet protection technique is usually applied to protect one element of the Power system, in this paper the wavelet protection technique is modified to protect the whole elements of the power system in the same time which will be costless. Signal processing of the recorded currents sample based on the suggested Daubechies four (dp4- level 1) is used to detect faults and classify their types by comparing currents approximate values with the threshold values. Once a fault is detected and classified, recorded current samples are turned into their modal component using Karrenbauer transformation, then by applying the proposed algorithm approached in the paper, the zone of fault is determined, if the fault is located at transmission line zone, distance of fault from each bus is calculated. Time of the travelling wave to reach bus2 (TB2), time of
the travelling wave to reach bus1 (TB1) and difference absolute peak value (TP1-TP2) are the used to determine and specify the zone of the fault.
APPENDIX (A)
System Base Power: 100 MVA System Frequency: 60 Hz Bus 1&2 Voltage: 500 KV
Bus 1 Positive Sequence Impedance:17.177+j45.5285 Bus 1 Zero Sequence Impedance: 2.5904+14.7328 Bus 2 Positive Sequence Impedance: 15.31+j45.9245 Bus 2 Zero Sequence Impedance: 0.7229+15.1288 Line Length: 100 km
Sampling rate: 983.040 KHZ REFERNCES
[1] Kamshad Eshghi, Brian K Johnson & Craig G Rieger “Analysis Power System Protection and Resilient Metrics”, IEEE, P212-219, 2015.
[2] P. Rajaraman, N.A. Sundaravaradan and D.K. Mohanta. “Fault Classification in Transmission Lines Using Wavelet Multiresolution Analysis" IEEE, P38-44, 2016.
[3] K. Ramesh and M.Sushama “Power Transformer Protection using Wavelet Packet Transform” 2014 International Conference on Computer Communication and Informatics (ICCCI, Coimbatore, INDIA), Jan. 03 – 05, 2014. [4] C. M. S. Neto, F. B. Costa and R. L. Barreto “Wavelet-Based Method for Detection of Electrical and Electromechanical Oscillations in Synchronous Generators”, IEEE, P699-704, 2013.
[5] W. Zhao, Y.H. Song and Y. Min, “A new approach to fault location in three-phase underground distribution system using combination of wavelet analysis with ANN and FLS”, Electrical Power and Energy Systems 55 - 261–274, 2014 [6] Ch.Durga, N.srinivasu "fault detection in transmission lines using instantaneous power with ED based fault index", smart grid technologies, science direct, 132-138, 2015.
[7] Jeevanand Seshadrinath & Bhim Singh, "Investigation of Vibration Signatures for Multiple Fault Diagnosis in Variable Frequency Drives Using Complex Wavelets ", IEEE transaction on power electronics, 936-944, 2014.
[8] K. M. Silva and B. A. Souza "Fault Detection and Classification in Transmission Lines Based on Wavelet Transform and ANN", IEEE transaction on Power Delivery, Vol. 21, NO. 4, October 2006.
[9] Masoud Karimi, Hossein Mokhtari, and M. Reza Iravani " Wavelet Based On-Line Disturbance Detection for Power Quality Applications", IEEE transaction on Power Delivery, Vol. 15, NO. 4, October 2000.
[10] P.L. Mao , R.K. Aggarwal "A wavelet transform based decision making logic method for discrimination between internal faults and inrush currents in power transformers" Electrical Power and Energy Systems 389–395, 2000.
[11] CH Kim, H Kim "A novel fault-detection technique of high-impedance arcing faults in transmission lines using the wavelet transform", IEEE Power Delivery, 921-922, 2002. [12] Sushma Ghimire, " Analysis of Fault location methods on transmissionlines " MSc thesis. P-29, Spring 5-16-2014. [13] Abdelsalam Mohamed Elhaffar " power transmission line fault location based on current travelling " PhD thesis, P-83,2008.
[14] Y. Ge, The New Type Rely Protection and Fault Location Theory, Xi An: Xi'an, JiaoTong University, pp. 184-187, 2007. Fault
type TB1 TB2
Calculated Distance
(Km)
Actual Distance
(Km)
%Error
A-G 19 323 4.87 5 -2.62
B-G 53 289 14.96 15 -0.24 AB 71 273 20.01 20 0.06
BC 171 171 50.00 50 0.00 AC 307 37 90.08 90 0.09
ABG 121 225 34.56 35 -1.26
BCG 289 53 85.04 85 0.04