EMG BIOANALYZER
BRFOR ANALYZING
ELECTROMYOGRAPHIC SIGNALS WHEN SWALLOWING
EMG Bioanalyzer
BRpara a análise
de sinais eletromiográicos na deglutição
Paulo Feodrippe (1), Luciana Rodrigues Belo (2), Maria das Graças Wanderley de Sales Coriolano (3),
Danielle Carneiro de Menezes (4), Otávio Gomes Lins (5)
(1) Graduate student in engineering from the University of Per-nambuco – UPE.
(2) Speech Pathologist; Master in neuroscience from the Department of Neuropsychiatry and Behavioral Sciences, Federal University of Pernambuco.
(3) Physical Therapist, Associate Professor, Department of Anatomy, Federal University of Pernambuco.
(4) Occupational Therapist, Master in Neuroscience from the Department of Neuropsychiatry and Behavioral Sciences, Federal University of Pernambuco.
(5) Clinical Neurophysiology, Professor, Department of Neu-ropsychiatry and Behavioral Sciences, Federal University of Pernambuco.
Conlict of interest: non-existent
conscious and involuntary, and both are controlled by the central nervous system, while the esopha-geal phase is unconsciously and involuntarily controlled by the parasympathetic automonic nervous system3-5.
Understanding how muscles act during swal-lowing is decisive for diagnosis and therapeutic management. Because the clinical myofunctional evaluation is subjective, the electromyographic
examination can be used to quantify and demon -strate the functioning of these muscles during swallowing6.
The EMG record is less expensive, simpler,
involves less discomfort for the patient, is noninva-sive and provides information to suggest electro-physiological dysfunction in swallowing (dysphagia)7.
Clinical electromyography involves the detec-tion and recording of electrical potentials of skeletal
muscle ibers. This record requires a system of three
phases: an entry phase, which includes electrodes for recording of electrical potentials of contracting muscle; a processing phase, during which the small
electrical signal is ampliied; and an output phase,
in which the electrical signal is converted to visual
INTRODUCTION
Swallowing is the process by which food is transported from the mouth to the stomach1, and
comprises a complex, bilateral coordination of
muscle contraction and inhibition of the lips, tongue,
larynx, pharynx and esophagus2.
Swallowing is usually divided into three phases: oral, pharyngeal and esophageal. The oral phase is conscious and voluntary, the pharyngeal phase
ABSTRACT
Purpose: to describe the construction phases of EMG BioanalyzerBR (version 1.0) and demonstrate its applicability in analyzing parameters provided by surface electromyography (EMG). Method: it is a descriptive analysis software developed in order to analyze the parameters obtained in surface electromyography of muscles involved in swallowing. This software was written in a development environment used by worldwide researchers, with easy accessibility and programming: Scilab.
Results: this tool has proved effective for analyzing transferring short data records, having on average 10 seconds duration, but for with longest periods above 20s there were some failures that did not harm the calculation after a few tries. Conclusion: despite the dificulties, EMG BioanalyzerBR fostered the
development of channel-by-channel markings and how many marks were needed simultaneously, and thus the tabulation of data became faster and with reduced margin as for human error, but needing improvements for version 2.0.
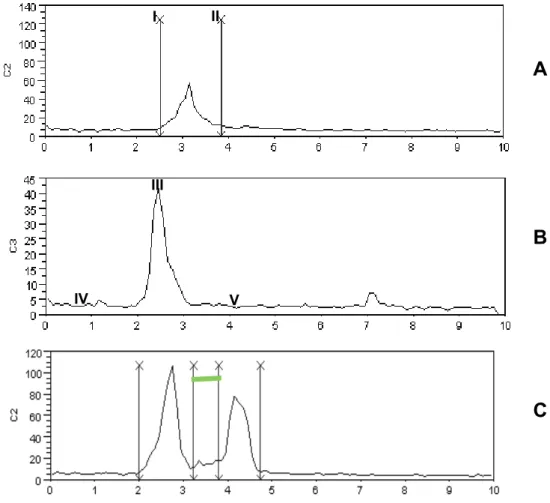
beginning of swallowing and is indicated with an
odd-numbered mark, i.e., the moment of the irst
mark is the beginning of swallowing (Figure 1A). The duration of swallowing is the relative time from the even-numbered mark subtracting the time of the odd-numbered mark immediately preceding, i.e., the time of the second mark subtracting the time
of the irst mark. If more than one swallow occurs,
then the time of the second swallow is obtained by subtracting the time of the fourth mark by the time of the third, and so on [Figure 1A].
The Maximum RMS (RMS MAX) is the maximum
RMS amplitude in one swallow, considered the highest point of the electromyogram [Figure 1B].
The average RMS of a swallow corresponds to the amplitude of average RMS, of the voltage picked up by EMGs, calculated in the interval between the onset and end of the same swallow (Formula 2)8,9,11,12.
Where: AM means arithmetic mean; a
i, with i = 1, 2, ..., n, represents the RMS values of the captured signal, n is the number of points obtained.
The interswallowing duration (ISD) is obtained when there are additional swallows to consume a
certain amount offered. It is calculated by subtracting
the onset (odd-numbered mark) of the second swal-lowing minus the end (even-numbered mark) of the
irst swallow [Figure 1C].
The average RMS of the pre-swallowing base-line is the parameter consisting of the amplitude of the average RMS of the baseline that corresponded to the 100 ms interval considered the moment of onset of swallowing.
The average RMS of the post-swallowing baseline is the parameter consisting of the ampli-tude of the average RMS of the baseline corre-sponding to the 100 ms interval considered inal
moment of the last swallow.
If the participants perform more than one
swallow, the average RMS interswallow baselines are also calculated, which correspond to the onset
of subsequent swallows.
The signal-to-noise ratio (SNR) is the factor
that relects the ability of the ampliier to limit noise, with respect to the ampliied signal. At the same
time, it also refers to the desired/undesired signal ratio (noise). This noise is usually produced by the
internal electronics of the ampliier (resistors, tran -sistors and integrated circuits)8,9.
and analyzed using the EMG signal acquisition soft -ware8, 9.
The acquisition and analysis software usually comes with EMG equipment, but the analysis
performed by these instruments does not provide detailed information necessary for the work of
researchers. Often the technical speciications of the equipment are not suitable for research, there
-fore adjustment is required.
Thus, the objective of this study was to describe the stages of construction of the EMG BioanalyzerBR
(version 1.0) and demonstrate its applicability in the analysis of parameters provided by surface electro-myography (EMG), which is important for the study of electrical activity of muscles activated during swallowing.
METHOD
This is a descriptive study that consisted of a graphical interface for use by health professionals,
who use EMGs in scientiic research for the study of
swallowing.
The EMG BioanalyzerBR was written in Scilab,
which is a development environment of easy
acces-sibility and programming. It was used for analysis of
EMG data obtained at the Electroneuromyography Laboratory of the Hospital das Clinicas, Federal University of Pernambuco.
The equipment used has four channels, with preampliiers and a Butterworth type bandpass ilter of 20 to 500Hz, ampliied 2000 times (common mode
rejection > 120 dB) and digitized with a sampling
frequency of 2 KHz per channel.
After analog processing, the signal is digitized and displayed on a computer screen by means of
the data acquisition software of EMG System do Brasil and converted to the format (.txt) to be read
by EMG BioanalyzerBR.
The EMG parameters related to swallowing
func-tion were: onset, durafunc-tion, maximum RMS, average
RMS, duration of interswallowing, average RMS of the pre- and post-swallowing baseline and signal-to-noise ratio.
To calculate the root mean square (RMS) signal,
we used a moving window of 100 ms, without over-lapping by means of the following formula10:
III
IV V
I II
A
B
C
Figure 1 – 1A: onset (I) end of the swallowing (II). 1B: RMS MAX (III), pre-swallowing baseline (IV), post-swallowing baseline (V). 1C: interswallowing duration (green line-VI)
This parameter is calculated by dividing the average RMS of the signal by the average RMS of the immediately preceding baseline. The result of this division is raised to the second power13.
RESULTS
To properly use the EMG BioanalyzerBR, it
is necessary to follow a sequential routine of
commands shown in Figures 1 and 2.
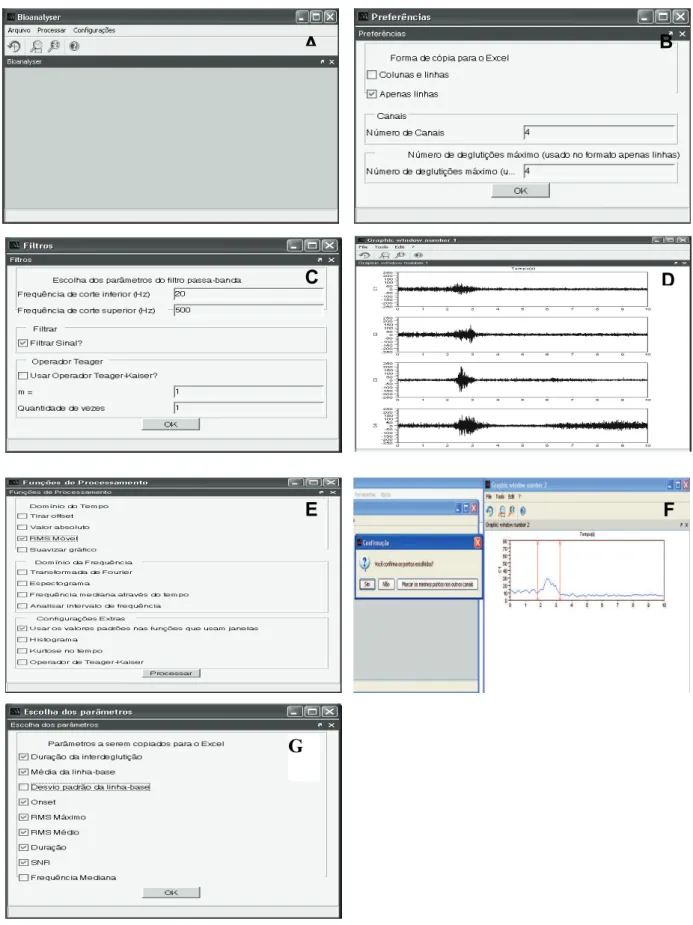
Figure 2A shows the initial screen of the soft-ware. The menu has three items for accessing the EMG signal, “File”, where you can open the raw
EMG signal in .txt format or exit the software; “Edit”,
where the functions for processing the EMG signal can be found, among them: remove the offset, obtain the absolute value and mobile RMS; “Settings”,
where you can deine preferences, ilters, functional
parameters and parameters that you wish to study.
Clicking on File Open, which is the irst time the .txt signal is accessed, the “Preferences” screen
opens [Figure 2B], in which you can choose the
format to copy the parameters for Microsoft Ofice Excel or Br Ofice.Org.Calc. You can also deine the number of channels of the ile and the maximum
number of swallows that were made.
The following must be decided if the signal is to
be digitally iltered. In Figure 2C, a Finite Impulse Response (FIR) type ilter was used and a ilter in which the signal passes through the Teager-Kaiser operation. In this case the operator must choose the FIR ilter.
After choosing the ile to be opened in .txt format,
the EMG BioanalyzerBR builds a new window with
the raw data of the EMG signal [Figure 2D]. Then, the raw signal must be processed by means of the “Edit” menu in the main window of the software.
In the edit window [Figure 2E], the functions in the time domain, frequency, and other less commonly
used functions in the analysis of EMG signals can be found. However, only the RMS function was used, calculated by Formula 1.
With editing inished, a new window opens
A
B
C
D
E
F
G
Figure 2 – 2A: Initial screen of EMG BioanalyzerBR; 2B: Preferences window of the EMG BioanalyzerBR;
2C: Window for the setting of parameters of the ilters to be used; 2D: Display window of raw records
After setting the marks of swallows in all
chan-nels and then conirming the marks, the software
will open a new window for selection of parameters to be analyzed and copied to the clipboard [Figure
2G]: onset, duration, maximum RMS, average RMS,
interswallowing duration, average RMS of the pre- and post-swallow baseline and signal-to-noise ratio.
Thus, all the parameters of the EMG channels (separated by commas by Scilab) are transferred simultaneously to the program chosen by the researcher, as shown in Table 1.
in sequence. At this point, the marks where each
swallow begins and ends should be made [Figure
2F]. Then, the examiner will be asked if he wants to conirm the points (Yes or No) or if he wants to mark
the same points in the other channels [Figure 2G ].
If the chosen points are wrong, the researcher has the option of clicking on “No” in the “Conirma -tion” window, which will allow a new marking. The
irst channel is free to make as many marks as
needed, while the other channels allow the same
number of marks made in the irst channel.
Table 1 – Spreadsheet of the Data Table containing the parameters of the EMGs related to the function of swallowing (BrOfice.org.Calc)
DISCUSSION
The EMG BioanalyzerBR was developed by
Feodrippe, a member of the Clinical and Experi
-mental Neurophysiology research group. It was
developed due to the need to analyze parameters that were not provided by the surface electromyog-raphy software that is part of the collection of the Electroneuromyography Laboratory of the Hospital das Clínicas, Federal University of Pernambuco, as well as to make the tabulation (transfer of data for each parameter) faster, with less margin for error and standardized to achieve the necessary statis-tical tests.
As performed by Ruark et al, 200214 and Green
et al, 199715, the analysis of EMG data is performed
after processing the raw signal in a rectiied and iltered wave (Botterworth = 8 and low-pass cutoff
= 30Hz), then the setting of marks is done manu-ally from visual analysis by the researcher, with the
onset deined as the instant when the signal activity
begins to exceed the baseline and the end corre -sponds to when this activity return to baseline or its reduction14,16-19.
The parameters provided by the software include information about the duration, amplitude and morphology of the electromyograms of the muscles of interest obtained at intervals before, during and after swallowing. These parameters were: onset,
duration, maximum RMS, average RMS, interswal -lowing interval, average RMS pre- and post-swallow baseline and signal-to-noise ratio.
The marking of the “on” (onset) and the “off”
intervals enables the analysis of activation time and duration of the contraction of muscles to perform a
speciic motor activity. The literature recommends
Vaiman (2005)23, the need is clear for studies to
assess the interswallow duration, especially in the analysis of free swallowing of 100 ml of water. Analysis of this parameter can indicate the status
of muscle coordination in sequential action of each
swallow and its variation with time.
The signal-to-noise ratio is an important param-eter to improve the reliability of EMG recordings in order that from their analysis electromyograms can
be included or excluded that present a very low STN
value, suggesting contamination of the electromyo-graphic signal by noise that is so intense as to preju-dice the data obtained in research13.
The EMG BioanalyzerBR, in the shortest
record-ings of approximately 20,000 points, proved effec -tive for the processing and transfer of data for the chosen parameters. However, longer electromyo-graphic recordings, with nearly twice as many points (40000), led to overload in the program memory with system freezes and crashes, though it was possible to complete the calculation after a few tries. Despite these occurrences the software achieved its goals.
CONCLUSION
The EMG BioanalyzerBR, despite failures in the
system, proved effective for the processing and transfer of parameters chosen for the spreadsheet and later statistical analysis, especially due to the possibility of carrying out channel-by-channel mark-ings and simultaneously setting as many marks are
required per swallow. Thus, the data tabulation was faster and with reduced margin of human error. Yet, there is a need for improvements in the next edition.
ACKNOWLEDGEMENTS
Dr. Amdore Guescel C Asano, Emmily Silva Fortuna, Elizabeth Gomes da Silva, Douglas Monteiro da Silva and Paulo José de Andrade Lira Oliveira.
evaluate whether the period of contraction of the muscles studied in swallowing is very long in rela-tion to electromyographic activity in subjects without
swallowing dificulties, suggesting lack of coordina -tion and/or slow reac-tion to the realiza-tion of pharyn-geal swallowing (swallowing itself), whether as a
normal consequence of aging18, due to the presence
of neurological disease such as Parkinsons7,12,21,22 or
other types of dysphagia.
The baseline corresponds to a period of elec-tromyographic silence, when the muscles are at rest. The rest period can provide important infor-mation, such as the presence of noise and interfer-ence in the EMG signal by involuntary contractions of the studied muscles performed before or after swallowing11,17,18.
The analysis of noise in the baseline is extremely
important to identify the amount of effective electro-myographic signal in the recording22.
It is important to note that muscle tone is not
evaluated by EMG, because tone is not a func-tion of the motor unit, but is the tension in a resting
muscle. Thus, as with a normal relaxed muscle, a
spastic muscle will also feature a electromyographic silence9.
The average RMS and maximum RMS are
important to quantify the electrical activity of the
muscles studied. These values are commonly used to compare the electrical activity between rehabilita-tion sessions, muscles and individuals, but the great variability of the captured signal due to anatomical
differences and differences in the execution of move -ments can lead to erroneous interpretations8,9,11,12.
It is recommended in the evaluation of muscle
activity, such as in the swallowing of different volumes or of different consistencies, that normal-ization of the signal is done by means of calculating the percentage of these values from peak to peak or calculating the percentage from the baseline11,14.
10. Kenney JF, Keeking ES. Root mean square.
Mathematics of statistics. Princeton, NJ: Van Nostrand; 1962 .p. 59-60.
11. Cram J, Kasman GS. The Basics of Electromyography. In: Criswell E. Cram’s Introduction to Surface Electromyography.
2ª edição. Massachusets: Jones and Bartlett Publishers; 2011. p.35-61.
12. Coriolano MGW, Lins OG, Belo LR, Carneiro D, Moraes SRA, Amdore Guescel Asano AG, Oliveira PJ, Silva DM. Monitorando a deglutição através da
eletromiograia de superfície. Rev. CEFAC 2010;
12(3): 434-40.
13. Solnik S, Vita PD, Rider P, Long B, Hortobágyi
T. Teager–Kaiser Operator improves the accuracy
of EMG onset detection independent of signal-to-noise ratio. Acta Bioeng Biomech 2008; 10(2): 65-8. 14. Ruark JL, Mccullough GH, Peters RL, Moore CA. Bolus Consistency and Swallowing in Children an Adults. Dysphagia 2002; 17(1):24-33.
15. Green JR, Moore CA, Ruark JL, Rodda PR, Morvee WT, Vanwitzenburg MJ. Development of Chewing in Children from 12 to 48 months: Longitudinal study of EMG patterns. Journal Neurophysioly 1997; 77: 2704-16.
16. Pelman AL, Palmer PM, Mccoulloch TM, Vandaele DJ. Electromyography active from human laryngeal, pharyngeal, and submental muscles during swallowing. Journal of Applied Phisiology 1999; 86: 1663-9.
17. Vaiman M, Eviatar E, Segal S. Evaluation of
normal deglutition with the help of rectiied surface
electromyography records. Dysphagia 2004; 19: 125-32.
18. Vaiman M, Eviatar E, Segal S. Surface electromyographic studies of swallowing
REFERENCES
1. Steenhagen CHVA, Motta LB. Deglutição
e envelhecimento: enfoque nas manobras
facilitadoras e posturais utilizadas na reabilitação do paciente disfágico. Revista Brasileira de Geriatria e Gerontologia 2006; 9(3): 89-100.
2. Ertekin C, Aydogdu I. Neurophysiology of
swallowing (invited review). Clinical Neurophysiology 2003;114: 2226-44.
3. Ertekin C, Aydogu I, Yüceyar, N, et al.
Electrodiagnostic methods for neurogenic dysphagia. Electroencephalography and clinical neurophysiology 1998; 109: 331-40.
4. Schindler JS, Kelly JH. Swallowing Disorders in
the Elderly. The Laryngoscope 2002; 112: 589-602.
5. Marchesan I.Q. Deglutição – Normalidade. In: Furkin A.M., Santine C.S. (org). Disfagias
orofaríngeas. São Paulo: Pró-Fono; 2004. p. 3-16.
6. Rahal A, Lopasso FP. Eletromiograia dos
Músculos Masséteres e Supra-Hióideos em Mulheres com Oclusão Normal e com Má Oclusão
Classe I de Angle Durante a Fase Oral da Deglutição.
Revista CEFAC. 2004; 6(4): 370-5.
7. Eterkin C. Physiological and Pathological Aspects of Oropharingeal Swallow. Movements Disorders 2002; 17(2): 86-9.
8. Portney L. Eletromiograia e testes de velocidade de condução nervosa. In: O`Sullivan SB, Schmitz
TJ editores. Fisioterapia: Avaliação e Tratamento. São Paulo: Manole, 1993. p. 183-217.
9. Portney L, Roy SH. Eletromiograia e testes de velocidade de condução nervosa. In: O`Sullivan
S.B., Schmitz T.J. Fisioterapia: avaliação e tratamento. São Paulo: Manole, 2004. p. 213-56.
RESUMO
Objetivo: descrever as etapas de construção do EMG BioanalyzerBR (versão 1.0) e demonstrar a
sua aplicabilidade na análise de parâmetros fornecidos pela eletromiograia de superfície (EMGs).
Método: trata-se de um estudo descritivo do software de análise desenvolvido para analisar
parâ-metros obtidos na eletromiograia de superfície de músculos envolvidos na deglutição. Este software foi escrito em um ambiente de desenvolvimento utilizado por pesquisadores do mundo todo, de fácil acessibilidade e programação: o SCILAB. Resultados: esta ferramenta se mostrou eicaz para a
análise e transferência de dados nos registros curtos, contendo em média 10s de duração, porém
para registros mais longos com duração maior que 20s apresentou falhas que não prejudicaram o
cálculo após algumas tentativas. Conclusão: apesar das diiculdades, O EMG BioanalyzerBR
possibi-litou a realização das marcações canal por canal e quantas marcações fossem necessárias de forma simultânea,e desta forma a tabulação dos dados icou mais rápida e com margem de falhas humanas
reduzidas, porém com necessidade de aprimoramentos para a versão 2.0.
S: Eletromiograia de superfície da musculatura
supra-hióidea durante a deglutição de idosos sem doenças neurológicas e idosos com Parkinson. Revista CEFAC 2009; 11(2): 268-80.
22. Potulska A, Friedman A, Królicki L, Spychala
A. Swallowing disorders in Parkinson´s desease. Parkinsonism & Related Disorders 2003; 9: 349-53. 23. Vaiman M, Gabriel C, Eviatar E, Segal S. Surface electromyography of continuous drinking in healthy adults. The Laryngoscope 2005; 115: 68-73.
Report 2. Quantitative data: Amplitude measures
Otolaryngology. Head and Neck Surgery 2004; 135(5): 773-80.
19. Vaiman M, Eviatar E, Segal S. Surface electromyographic studies of swallowing in normal subjects: A review of 440 adults. Report 1.
Quantitative data: Timing measures Otolaryngology
– Head and Neck Surgery 2004; 131(4): 548-55. 20. De luca CJ. The Use of Surface Electromyography in Biomechanics. Journal of applied mechanics 1997; 13: 135-63.
RECEIVED IN: 03/29/2010 ACCEPTED IN: 05/16/2011
Mailing Address: Luciana Rodrigues Belo
Rua Abel de Sá Bezerra Cavalcanti, 161, apt. 601 Casa Amarela
Recife – Pernambuco