* Programa de Pós-Graduação Stricto-Senso em Educação Física. Univer-sidade Católica de Brasília-UCB, Brasília-DF, Brasil.
Received in 4/7/ 05. Final version received in 21/7/ 06. Approved in 25/7/ 06. Correspondence to: Dr. Herbert Gustavo Simões, QS07, LT1 s/n, sala 116, bloco G – 72030-170 – Águas Claras, DF, Brazil. E-mail: w olysson@pop. com.br / hsimoes@pos.ucb.br
Critical velocity as a noninvasive method to
estimate the lactate minimum velocity on cycling
*
Wolysson Carvalho Hiyane, Herbert Gustavo Simões and Carmen Sílvia Grubert Campbell
O
RIGINALA
RTICLEKeyw ords: Anaerobic threshold. Indirect methods. Predictive bouts. M aximal
lac-tate steady slac-tate. ENGLISH VERSION
ABSTRACT
The lactate minimum velocity (LM V) represents the equilibrium point betw een blood lactate (lac) production and removal. With the purpose of analyzing the validity of critical velocity (CV) as a non-invasive method to estimate the LM V on outdoor cycling, 15 cy-clists (67.9 ± 5.7 kg; 1.70 ± 0.1 m; 26.7 ± 4.2 years) performed all-out tests on distances of 2, 4 and 6 km on velodrome. The CV w as identified by distance-time model from combinations of 2 and 4
km (CV2/4), 2 and 6 km (CV2/6), 4 and 6 km (CV4/6) and 2, 4 and 6 km
(CV2/4/6). The LM V w as identified during 6 x 2 km incremental bouts after a lactic acidosis induced by the all-out 2 km. The low er lac during test identified the LM V visually (LM Vv) and by applying a polynomial function (LM Vp). No differences w ere observed
be-tw een LM Vv (33.3 ± 2.5 km .h-1) and LM Vp (33.1 ± 2.6 km .h-1).
Apart from CV4/6 (34.6 ± 3.5 km .h
-1), the values of CV
2/4 (38.0 ± 2.2
km .h-1), CV
2/6 (36.1 ± 2.4 km .h
-1) and CV
2/4/6 (36.1 ± 2.5 km .h -1)
differed from LM Vp and LM Vv (P < 0,001). The authors concluded that, besides being ~1 km /h above the LM V, the CV determined through predictive series of longer duration (4 and 6 km – approx-imately 6 and 10 min) did not differ statistically from LM V and pre-sented a high correlation and agreement to each other. How ever, it is necessary to investigate w hether the CV reflects the balance betw een lac production and removal during long-term exercise on outdoor cycling.
INTRODUCTION
Davis and Gass(1), observed during incremental test performed
after high intensity exercise that the blood lactate concentrations decreased in the first incremental loads until a minimum point and returned to increase in the subsequent loads. These authors con-cluded that the exercise intensity corresponding to the balance point betw een blood lactate production and removal could be iden-tified during incremental bouts performed after induction of meta-bolic acidosis. Later, this protocol w as improved and called
mini-mum lactate(2) (M L). M oreover, several subsequent studies(3-9) w ere
conducted in order to verify its validity.
Simões et al.(5), analyzing the relation betw een M L and other
protocols proposed for identification of the maximal lactate steady phase (M LSP) in runners, did not find statistically significant differ-ences betw een the minimum lactate velocity (VLM ) and the veloc-ities corresponding to the individual anaerobic threshold and to the steady concentration of 4 mM of blood lactate. These authors also observed that the M LV did not differ from the running velocity in w hich blood lactate steady phase w as observed during long dura-tion exercise.
M acIntosh et al.(4) verified in a study w ith 14 cyclists/triathletes
of both sexes, that the M L protocol w as valid for prediction of
physical exercise intensities corresponding to the M LSP. Bacon
and Kern(9) also evidenced that the M LSP and M LV intensities,
iden-tified during running tests in physically active individuals, w ere not different from each other.
Although it is an interesting method for identification of an exer-cise intensity w hich represents the M LSP, the determination of the M LV depends on costly equipment and evaluators skilled in blood collection and lactate dosing, w hich makes its w ide applica-tion not viable.
An alternative w ould be the use of indirect methods(10) for
iden-tification of velocities similar to the M LV and M LSP. Among these methods w e find the determination of the critical velocity (CV) CV has been suggested as the intensity of physical exercise w hich can be sustained for an extensive period of time w ithout
exhaus-tion(11). M oreover, its determination involves non-invasive and
in-expensive procedures w hich may be easily applied on field tests. The VC validity in estimating the M LSP is still very controversial.
Wakayoshi et al.(12) observed that the CV could identify the M LSP
in sw immers. In this study, the participants performed repeated series of 400 meters in velocities corresponding to 98, 100 and 102% of the CV, being 4 series at each intensity. It w as verified that in exercises performed at 100% of the CV the lactate concen-trations stabilized, w hile at 102% of the CV the concenconcen-trations increased betw een the first and fourth series. It w as concluded
hence, that the CV could represent the M LSP. Kokubun(13) evidenced
similar results in his study w ith 48 sw immers from both sexes. The study show ed that during 5 series of 400 meters w ith 30 sec-onds of pause no alterations in the lactate concentrations w ere observed w hen the series w ere performed at 100% of the CV. On the other hand, w hen these series w ere performed at intensities higher than the CV, accumulation of blood lactate w as observed.
Although some studies have established that the CV may esti-mate the M LSP in sw imming, studies performed w ith other exer-cise modalities show that the critical velocity-pow er overestimates the intensities corresponding to individual anaerobic threshold,
M LSP and minimum lactate(8,14). In a study performed w ith 20
run-ners, Simões et al.(5) observed that the CV (292,1 ± 17,5 m.min-1)
overestimated the M LV (281,0 ± 14,8 m.min-1). Similarly, Denadai,
Gomide and Greco(15) verified that the CV determined in running in
soccer players overestimated the M LSP.
As far as w e know, no study has compared the CV determined on outdoor cycling w ith other protocols of aerobic evaluation such as anaerobic threshold, M L and M LSP, w here the majority of the studies w ere performed in cycle ergometer w ith pow er measured
in Watts. M cLellan and Cheung(14) verified in 14 individuals that the
CP determined in cycle ergometer by the pow er- 1/time linear rela-tion overestimated in 13% the M LSP. How ever, the CV may also
suffer influence of the mathematical model applied(16-17) and the
as its comparison w ith other protocols w hich propose the identifi-cation of the M LSP, especially on outdoor cycling.
Considering that laboratory tests usually lose in specificity, w e propose in this study the utilization of tests w hich reach for the highest specificity in the sport, namely track tests w ith the utiliza-tion of the cyclist’s ow n bicycle. Therefore, the aim of the present study w as to compare the values of CV identified by different com-binations of predictive series on field tests performed on cycling as w ell as the CV values identified by different combinations of predictive series w ith velocities of minimum lactate determined by visual inspection and by the application of polynomial function.
M ETHODS
Fifteen cyclists w ith 6,3 ± 3,2 years of practice participated in the research, w hose characteristics are represented in table 1. The participants answ ered a questionnaire of anamnesis and signed a free and clarified consent form about the study’s procedures. Each participant w as instructed to remain hydrated as w ell as to have the last meal 3 hours prior to the tests sessions. Ingestion of alco-holic beverages and intense physical exercises w ere not allow ed during the 24 hours prior to the tests. The methods used in the present study w ere approved by the Ethics in Human Research Committee of the Catholic University of Brasília.
time linear model. Such model also allow s the identification of the anaerobic w ork capacity, despite not being object of this study as a parameter.
Identification of the equilibrium point betw een blood lac-tate production and removal
It consisted of the M L test application using a M acIntosh et al.(4)
modified protocol,being one 2 km all-out series used for blood
lactate increase, follow ed by 8 minutes of recovery w ith a blood
collection in the 7th minute. In the 8th minute an incremental bout
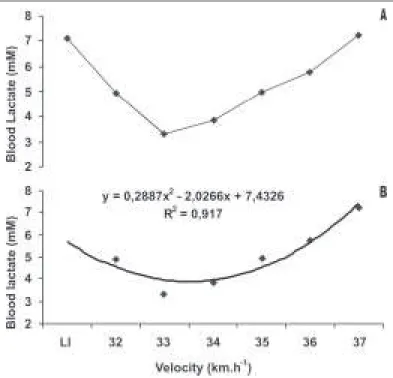
consisting of 6 series of 2 km in progressive intensities, w ith 1 minute pause for capillary blood collection w as applied. The inten-sity of the first series corresponded to 5 Km/h below the mean velocity obtained in 6 km bout previously performed, w ith increas-es of 1 km/h at each seriincreas-es of 2 km. The mean velocity of each series w as controlled by a cyclecomputer (ASSIZE, CYCLOCOM -PUTER) as w ell as by sound stimulus (w histle). The M LV identifica-tion w as visually inspected (M LVv, figure 2-A), as w ell as by poly-nomial function of second degree for mathematical adjustment of the blood lactate response (M LVp, figure 2-B).
Blood collections and analyses
After local asepsis, a small incision on the earlobe w as done
w ith disposable material for collection of 25 µL of capillary blood
TABLE 1
M ean ± standard-deviation results concerning age; w eight; height and time of practice in cycling of the individuals w ho participated in the study (n = 15)
Age (years) Weight (kg) Height (m) Cycling practice (years)
M ean 26,7 67,9 1,7 6,3
± SD 04,2 05,7 0,1 3,2
Performed tests
All tests w ere performed in a velodrome in of 400 meters in Brasília – DF, w ith the volunteers using their ow n bicycles. The procedures w ere alw ays conducted at the same time of the day and consisted of 3 tests w ith the purpose to measure performance in the 2, 4 and 6 km distances, besides an incremental bout after hyperlactatemia induction for identification of the M LV. All tests w ere performed w ithin a 2 w eeks period. The tests w ere random-ly applied, except for the 6 km performance, w hich w as the first one to be applied. Unfavorable climate conditions such as rain and gusty w inds w ere avoided. The mean velocity as w ell as the cor-rect measurement of the velodromein w ere taken by a cyclecom-puter (ASSIZE, CYCLOCOM PUTER).
All-out tests of 2, 4 and 6 km
After a 10-minute w arm-up pedaling in their ow n bicycles be-tw een 90 and 100 rpm, the volunteers completed 2, 4 and 6 km all-out tests, alw ays at different days and w ith an interval of at least 24 h. These tests w ere chosen as predictive series of CV since they w ere finished betw een approximately 1 to 10 minutes,
as proposed by Poole(18).
Determination of the critical velocity
The CV w as determined in all participants from the
distance-time linear model(12). Linear regression betw een the completed
dis-tance (km) and the time used in order to complete this disdis-tance (h) w as performed. The inclination of the distance-time regression line w as defined as critical velocity (CV) (figure 1).
Having the 2, 4 and 6 km predictive series performance as start-ing point, combinations for the determination of four indices of
different critical velocities w ere performed. The CV2/4 (2 and 4 Km
series), CV2/6 (2 and 6 Km series), CV4/6 (4 and 6 Km series) and CV2/
4/6 (2, 4 and 6 Km series) w ere determined through the
distance-Figure 1 – Exemplification of the determination of critical velocity (CV)
and anaerobic w ork capacity (WCan) through the distance-time linear model
Figure 2 – Exemplification of the M LV identified by visual inspection (M LVv
– A) and polynomial function (M LVp – B). LI – Blood lactate increase through
using heparinized and calibrated capillary tubes. The collections occurred in the intervals betw een exercise series during the
mini-mum lactate test and stored in Eppendorfs tubes containing 50 µL
of sodium fluorite 1% . During the collection procedures, all mate-rials w ere disposable in order to avoid any kind of contamination. Besides that, the first blood drop w as discarded in order to avoid blood and sw eat mixture. The samples w ere analyzed through elec-troenzymatic method, using a lactate analyzer (Yellow Springs in-struments 2.700 STAT).
Statistical analyses
The data w ere expressed in mean ± standard deviation (SD). The results of M LVv, M LVp and CV determined by different combi-nations of predictive series w ere compared using variance analy-sis for repeated measures and Tukey test as w ell as post hoc and the correlations betw een CV and M LV w ere determined using the Pearson correlation coefficient. The significance level accepted w as p < 0,05. M oreover, the agreement level betw een LM V and CV determined by different methods w as analyzed through the
Bland-Altman technique(19).
RESULTS
No statistically significant differences w ere verified betw een M LVp and M LVv (table 2) nor betw een their respective lactate con-centrations (table 3) (p > 0,05). The intensities (Km/h-1)
correspond-ing to CV2/4, CV2/6 and CV2/4/6 w ere statistically different from the M LV identified both visually and by polynomial function (p < 0,001).
How ever, the CV4/6 did not differ from the M LVp and M LVv(table
2).
The Pearson correlations betw een the minimum lactate veloci-ties (M LVp and M LVv) and the variables CV2/4, CV2/6, CV4/6, CV2/4/6 are presented in table 4.
TABLE 2
Results (km/ h-1) concerning the M LVv, M LVp, CV
2/ 4, CV2/ 6, CV4/ 6, CV2/ 4/ 6
M LVv M LVp CV2/ 4 CV2/ 6 CV4/ 6 CV2/ 4/ 6
(km/ h-1) (km/ h-1) (km/ h-1) (km/ h-1) (km/ h-1) (km/ h-1)
01 30,5 29,9 34,0 32,8 31,7 32,8
02 30,5 28,3 36,0 35,0 34,0 34,9
03 34,0 34,8 40,2 37,5 35,1 37,4
04 33,0 32,9 37,1 36,0 35,0 36,0
05 34,0 31,3 40,4 38,0 35,8 37,9
06 36,0 35,9 36,9 38,0 39,1 38,0
07 36,5 36,4 42,1 38,8 36,0 38,7
08 33,0 33,2 35,1 34,9 34,6 34,9
09 36,0 35,0 39,1 39,0 38,9 39,0
10 31,0 31,9 40,2 34,0 29,5 33,8
11 27,5 28,8 36,4 31,0 27,1 30,8
12 33,5 33,4 36,9 34,0 31,6 34,0
13 34,5 34,5 37,9 38,0 38,1 38,0
14 34,0 34,4 38,5 36,2 34,1 36,1
15 36,0 36,2 38,7 38,4 38,1 38,4
M ean 33,3 33,1 *38,0* *36,1* 34,6 *36,1*
± SD 02,5 02,6 02,2 02,4 03,5 02,5
* P < 0,001 in relation to M LVp and M LVv.
Relative intensities concerning the CV identified by different methods expressed in % of the M LVv and M LVp, are presented in table 3. The blood lactate concentrations [Lac] corresponding to the M LVv and M LVp are also represented in table 3.
TABLE 3
Relative indices (%) in w hich the CV w as identified and lactate concentration corresponding to M LVv and M LVp
CV2/ 4 CV2/ 6 CV4/ 6 CV2/ 4/ 6 [Lac] (mM )
M LVv 114,1 108,4 103,9 108,4 3,5
M LVp 114,8 109,1 104,5 109,1 3,1
TABLE 4
Pearson bi-varied correlation betw een CV and M LV values
M LVv CV2/ 6 CV2/ 4 CV4/ 6 CV2/ 4/ 6
M LVv – 0,52* 0,92* * 0,87* * 0,93* *
M LVp 0,91* * 0,51* 0,77* * 0,70* * 0,78* *
* P < 0,05 * * P < 0,01.
The application of the technique proposed by Bland-Altman show ed high level of agreement betw een M LV and CV determined by different methods (figure 3 A-E), w ith the mean of the differ-ences (and 95% of the reliability interval) of 2,8 (0,8 to 4,8); 4,6 (–
0,2 to 9,4) and 2,7 (0,7 to 4,7) km* h-1 respectively betw een M LV
and CV2/6, M LVv and CV2/4, and M LVv and CV2/4/6. How ever, the best agreement occurred betw een M LVv and M LVp –0,2 (–2,4 to
2) km* h-1, as w ell as betw een M LVp and CV
4/6 1,2 (–2,4 to 4,8)
km* h-1.
DISCUSSION
The present study investigated the effects of different combina-tions of predictive series in the identification of the CV on cycling as w ell as analyzed the CV validity on estimating the equilibrium point betw een blood lactate production and removal (identified by the M L test). The main results of the present study w ere that the majority of the CV indices identified w ith different combinations of predictive series overestimated the M LV identified both visually and by application of polynomial function. Nevertheless, it w as observed that the combination of longer predictive series (4 and 6 km) may produce CV values that do not differ from the M LV (table 2), w ith high correlation and agreement betw een these variables w hen Pearson correlation and Bland-Altman technique w ere ap-plied (table 4 and figure 3 A-E).
M oreover, the present study show ed that the minimum lactate velocities identified by visual inspection and by polynomial func-tion w ere not statistically different (table 2), and the blood lactate concentrations corresponding to the M LVv and M LVp w ere respec-tively of 3,5 ± 2,3 and 3,1 ± 2,1 (table 3).
Polynomial function is a new method used for the M LCV identi-fication from a response adjustment of the blood lactate during the test. The polynomial function of second order originates an equation w hich may be derived to mathematically identify the equi-librium point betw een blood lactate production and removal. Al-though differences betw een the M LVv and M LVp w ere not ob-served, the utilization of the M LVp should be stimulated since this new methodology avoids misinterpretation w hich may occur w hen only visual inspection is used. The Bland-Altman technique show ed that the mean of the residual scores betw een M LVv and M LVp w as close to zero (figure 3A) and that the M LV values either visual-ly determined or by povisual-lynomial adjustment w ere w ithin the agree-ment limits, suggesting that the M LVp is an interesting option. Besides that, further studies have been conducted in our laborato-ries in w hich a considerable decrease in the incremental bouts during the test for determination of the M LV has been possible through the application of polynomial function.
Although several studies have demonstrated that the M LV
rep-resents the intensity of M LSP(2,4,7,9), the determination of the M LV
Figure 3 – Result of the agreement analysis by Bland-Altman. The continuous lines show the mean of differences and the traced lines show 95% of the
reliability limit betw een the tw o variables.
A B
C
D
E
CV and M LV indices may be explained by the influence of the exer-cise time of the predictive series w hich originated the CV indices. The CV identification is dependent on the duration of the predic-tive series, being the CV indices inversely proportional to their du-ration, w hich w as confirmed in the present study. The CV identi-fied from the combination of the 4 and 6 km series produced indices w hich w ere close to each other and did not statistically differ from the M LV, suggesting that longer distances produce critical veloci-ties w hich w ould theoretically represent the equilibrium point be-tw een blood lactate production and removal. M oreover, the Bland-Altman technique show ed that the mean of the residual scores
betw een M LVv and CV4/6 w as close to zero suggesting that the
agreement level betw een M LVv and CV4/6 (longer series) is higher
than betw een M LVv and CV2/4/6, CV2/4 and CV4/6 (figure 3, B-E), w hose combinations of predictive series include the 2 km bout (shortest duration).
Bishop et al.(16) verified that the combination of loads that allow
exhaustion time betw een 68 and 193 seconds determines higher indices of critical pow er (201 W) if compared w ith the loads that allow exhaustion time betw een 193 and 485 seconds (164 W).
Jenkins et al.(20) verified that the critical pow er presented different
values w hen the 3 low est (268 W) and the 3 highest (321 W) loads w ere selected, the latter resulting in higher values of critical pow -er.
According to Poole(18), predictive bouts that are able to be
com-pleted betw een 1 and 10 minutes should be chosen in order to determine the critical pow er/critical velocity. In the present study these recommendations w ere follow ed; how ever, only w hen the 4 and 6 km bouts w ere used (w hich had duration betw een 6 and 10 minutes) it w as possible to identify CV indices w hich w ere sim-ilar to the M LV. Despite not being statistically different from the
M LV as w ell as the Bland and Altman technique has confirmed the
acceptable level of agreement betw een the variables, the CV4/6
corresponded approximately to 104% of the M LV. It w ould be nec-essary to perform rectangular tests in intensities below, above and at the CV, analyzing the blood lactate response in these intensities in order to really assert that the CV identifies an exercise intensity similar to the M LSP, w hich w as not done in the present study. Therefore, further studies should be conducted in order to affirm w hether the M LSP and CV intensities are really similar (and not different from each other) w hen predictive series w ith performance times higher than 6 minutes are applied, as in the present study.
It w ould be interesting to standardize a protocol of CV determi-nation w hich could estimate the M LSP. The results of the Bland and Altman technique application show ed agreement level accept-able betw een M LVv and the remaining studied parameters (figure
3). Nevertheless, the CV4/6 w as the only predictive bout w hich did
not differ in relation to the minimum lactate velocities (table 2) besides presenting the best agreement (figure 3A-E). Thus, the utilization of the CV by coaches and athletes should be cautiously conducted. Despite being a non-invasive method of easy applica-tion, low cost and suitability for evaluation of a large number of individuals, the selection of the predictive series should be careful in order to determine values of CV w hich are close to the intensity corresponding to the equilibrium point betw een lac production and removal, or M LSp.
CONCLUSION
M LV. Nevertheless, it is necessary to investigate w hether the CV represents a balance betw een lac production and removal during long duration exercises.
All the authors declared there is not any potential conflict of inter-ests regarding this article.
REFERENCES
1. Davis HA, Gass GC. Blood lactate concentrations during incremental w ork be-fore and after maximum exercise. Br J Sports M ed. 1979;13:165-9.
2. Tegtbur UWE, Busse M W, Braumann KM . Estimation of an individual equilibri-um betw een lactate production and catabolism during exercise. M ed Sci Sports Exerc. 1993;25:620-7.
3. Campbell CSG, Simões HG, Denadai BS. Influence of glucose and caffeine ad-ministration on identification of maximal lactate steady state. M ed Sci Sports Exerc. 1998;30:327.
4. M acIntosh BR, Esau S, Svedahl K. The lactate minimum test for cycling: estima-tion of the maximal lactate stady state. Can J Appl Physiol. 2002;27:232-49.
5. Simões HG, Campbell CSG, Baldissera V, Denadai BS, Kokubun E. Determina-ção do limiar anaeróbio por meio de dosagens glicêmicas e lactacidêmicas em testes de pista para corredores. Rev Paul Educ Fís. 1998;12:17-30.
6. Simões HG, Campbell CSG, Kokubun E, Denadai BS, Baldissera V. Blood glu-cose responses in humans mirror lactate responses for individual anaerobic threshold and for lactate minimum in track test. Eur J Appl Physiol. 1999;80:34-40.
7. Simões HG, Kushnick M R, Nakamura A, Katsanos CS, Baldissera V, M offatt RJ. Blood glucose threshold and the metabolic responses to incremental exercise
tests w ith and w ithout prior lactic acidosis induction. Eur J Appl Physiol. 2003; 89:603-11.
8. Simões HG, Denadai BS, Baldissera V, Campbell CSG. Relationships and signif-icance of lactate minimum, critical velocity, heart rate deflection and 3000 m track-tests for running. J Sports M ed Phy Fitn. In press, 2005.
9. Bacon L, Kern M . Evaluating a test protocol for predicting maximum lactate steady state. J Sports M ed Phys Fitness. 1999;39:300-8.
10. Denadai BS. Avaliação aeróbia: determinação indireta da resposta do lactato san-guíneo. Rio Claro: M otrix, 2000.
11. M onod H, Scherrer J. The w ork capacit y of a synergic m uscular group. Ergonomics. 1981;24:329-38.
12. Wakayoshi K, Yoshida T, Udo M , Kasai T, M oritani T, M utoh Y, et al. A simple method for determining critical speed as sw imming fatigue threshold in competi-tive sw imming. Int J Sports M ed. 1992;13:367-71.
13. Kokubun E. Velocidade crítica como estimador do limiar anaeróbio na natação. Rev Paul Educ Fís. 1996;10:5-20.
14. M cLellan TM , Cheung KSY. A comparative evaluation of the individual anaerobic threshold and the critical pow er. M ed Sci Sports Exerc. 1992;24:543-50.
15. Denadai BS, Gomide EB, Greco CC. The relationship betw een onset of blood lactate accumulation, critical velocity, and maximal lactate steady state in soccer players. J Strength Cond Res. 2005;19:364-8.
16. Bishop D, Jenkins DG, How ard A. The critical pow er is dependent on the dura-tion of the predictive exercise tests chosen. Int J Sports M ed. 1998;19:125-9.
17. Bull AJ, Housh TI, Johnson GO, Perry SR. Effect of mathematical modeling on the estimation of critical pow er. M ed Sci Sports Exerc. 2000;32:526-30. 18. Poole DC. Correspondence. M ed Sci Sports Exerc. 1986;18:703-4.
19. M artelli Filho JA, M altagliati LA, Trevisan F, Gil CTLA. Novo método estatístico para análise da reprodutibilidade. R Dental Press Ortodon Ortop Facial. 2005;10: 122-9.