Genetic programming approach on evaporation losses and its
effect on climate change for Vaipar Basin
K.S.Kasiviswanathan1,*, R.Soundhara Raja Pandian 2, S.Saravanan3, Avinash Agarwal 4
1
WRDM, IIT Roorkee, India
2
IC&SR, IIT Madras, India
3
Civil Engineering, NIT Trichy India
4
Surface water division, NIH Roorkee India
Abstract
Climate change is the major problem that every human being is facing over the world. The rise in fossil fuel usage increases the emission of `greenhouse' gases, particularly carbon dioxide continuously into the earth’s atmosphere. This causes a rise in the amount of heat from the sun withheld in the earth’s atmosphere that would normally radiated back into space. This increase in heat has led to the greenhouse effect, resulting in climate change and rise in temperature along with other climatological parameters directly affects evaporation losses. Accurate modelling and forecasting of these evaporation losses are important for preventing further effects due to climate change. Evaporation is purely non-linear and varying both spatially and temporally. This needs suitable data driven approach to model and should have the ability to take care of all these non-linear behaviour of the system. As such, though there are many empirical and analytical models suggested in the literature for the estimation of evaporation losses, such models should be used with care and caution. Further, difficulties arise in obtaining all the climatological data used in a given analytical or empirical model. Genetic programming (GP) is one such technique applied where the non-linearity exist. GP has the flexible mathematical structure which is capable of identifying the non-linear relationship between input and output data sets. Thus, it is easy to construct ‘local’ models for estimating evaporation losses. The performance of GP model is compared with Thornthwaite method, and results from the study indicate that the GP model performed better than the Thornthwaite method. Forecasting of meteorological parameters such as temperature, relative humidity and wind velocity has been performed using Markovian chain series analysis subsequently it is used to estimate the future evaporation losses using developed GP model. Finally the effect
of possible future climate change on evaporation losses in Pilavakkal reservoir scheme, India has been discussed.
Keywords: Climate change, genetic programming, green house effect.
1. Introduction
Climate change is a major issue in this century and it affects directly as well as indirectly the water resources. Increasing amount of CO2 emission into the atmosphere will increase the global temperature known as global warming [8]. Also it [8] suggests that the water resources system will negatively respond on water availability and water supply. The understanding of the impact of climate change on evaporation could be better explained by accurate modelling and forecasting of the variable.
Numerous researchers have attempted to estimate the evaporation values from climatic variables, and most of these methods require data that are not easily available. Important historical examples include: (a) empirical relationships between meteorological variables ([3], [17], and [19]) and (b) physically-based equations ([15], [16]). While the former methods estimate evaporation based on climate data, the latter methods link evaporation dynamics with the supply of energy and the aerodynamics transport characteristics of a natural surface. Simple methods that are reported (e.g. [14], [18], and [19]) try to fit a linear relationship between the variables. However, the evapotranspiration process is embedded with large variability in both spatial and temporal scales [10].
Black box models like Genetic Programming (GPs), artificial neural networks (ANNs) and fuzzy techniques have been proposed as efficient tools for modeling and their application in water resources problems are reported successfully ([1], [2], [4], [9], [10], [12], [13], [20], [23]). GP has the advantage of providing inherent functional input-output relationships as compared to traditional black box models, which can offer some possible interpretations to the underlying process.Genetic programming (GP) is chosen as the modelling tool owing to its ability to evolve mathematical models from historical data.
In this study, the major objective was to evaluate the potential of GPs for estimating evaporation for Kovilar Reservoir in the Vaipar basin of Tamilnadu, India and its results are compared with Thornthwaite method [21]. Forecasting of the meteorological parameter such as temperature, relative humidity and wind velocity is carried out using Markovian chain series analysis method. Using the forecasted series, the future evaporation loss is estimated with the help of developed GP model. Finally climate change effects were discussed with temperature and evaporation changes.
2. Study area and data used
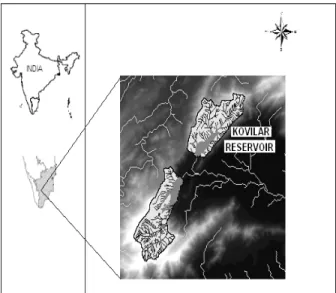
Pilavakkal reservoir system consists of Periyar and Kovilar reservoirs in Virudhunagar District of Tamilnadu State, India. For this study, Kovilar reservoir has been taken as a study area (Figure 1). It is situated within the geographical coordinates of (9o41’N, 77o23’E) and (9o38’N, 77o32E). Kovilar reservoir is constructed across the non-perennial Kovilar River, which carry only intermittent flash flows depending on the seasonal rainfall. The command area experiences a tropical climate throughout the year. A maximum mean monthly temperature of 38.34oC is observed during May, whereas a minimum mean monthly temperature of 20.04oC occurred in the month of January.
Mean annual rainfall of the dam site is 1187 mm against the state average of 945mm. However, the rainfall is highly erratic and is less than 75% of the mean in 20% of the years. Hence the area can be classified as drought prone according to the standards fixed by the Indian Meteorological Department.
Historical monthly average records of hydro meteorological variables such as temperature, wind speed, relative humidity, sunshine hour, precipitation and Evaporation have been data collected for the years 1992-2000 from Kavalur meteorological station, the nearest available meteorological station, about 20 km from the reservoir site. The data for the years 1992-1997 were used in model training and 1998-2000 data were used in model testing.
Fig. 1 The study area: Kovilar reservoir, Vaipar basin, India.
3. Materials and methods
3.1 Genetic Programming
probabilities of crossover and mutation are used in the simple genetic algorithm to effectively control the operators of crossover and mutation and they must range from 0 to 1. The final output of the model consists of independent variables and constants, and the functional set consists of basic mathematical operators {+, –, x, /, sin, cosh, log, power …} that may be used to form the model. The choices of operators depend upon the degree of complexity of the problem to be modelled.
The following parameters are considered while creating the dynamic models of Kovilar reservoir.
Et comp = f (Tt, RHt, Nht, Vt, Et obs) (1)
where,
Et comp= Computed Evaporation losses at time t (Mm 3
) Et obs = Observed Evaporation losses at time t (Mm3) Tt = Temperature at time t (ºC)
RHt = Relative Humidity at time t (%) Nht = Sunshine hour at time t (Hours/day)
Vt = Wind velocity at time t (Kmph)
The mathematical models evolved from GP are presented as
2
1 cos sin
0.107
t t t t t
t
E T RH V T
V −
=
−
∗ ∗
(2)
In equation (2), the temperature term explicitly appears. This is mainly because the evaporation losses depend on temperature. The prediction is found to be better in the zone of mean of the evaporation values i.e. about 0.1 Mm3.
3.2 Thornthwaite model
The Thornthwaite method [22] was used to estimate the potential evaporation of the basin. This method uses air temperature as an index of the energy available for evaporation, assuming that air temperature is correlated with the integrated effects of net radiation and other controls of evaporation, and that the available energy is shared in fixed proportion between heating the atmosphere and evaporation. There is no correction for different vegetation types. It merely requires inputs of mean monthly temperature, precipitation, latitude, and an estimate of soil storage capacity. Thus, the Potential Evaporation (PE)values are calculated based on observed temperature (and day-length) data and, when applied to typical, calibrated paired experimental watersheds where one is treated and the other is a control, may be correlated with and evaluated for any change in runoff quantity and
timing. Ultimately, Thornthwaite method is useful for description, classification, management, and research. The method’s biggest shortcoming is the minimum time division as month. That may produce a situation where end-of-the-month precipitation should not in fact appear as runoff until the following month, a delay that may be confusing in the computed water balance. However, the mean annual computations do wrap around: for example, mean annual January runoff, is based on mean annual December runoff.
The Thornthwaite's empirical equation is: 10
16
a
t PE
I =
(3)where,
PE =Potential evapotranspiration in centimeter per month. t = Mean monthly air temperature (ºC)
i = the monthly heat index and it is expressed as:
1.514
5 t i=
(4)I = Annual heat index and it is given by the equation: 12
1
j
I i
=
=
∑
(5)j = 1, 2, 3 ...12 is the number of the considered months.
7 3 5 2
6.7 10 7.7 10 0.018 49
a= ∗ − I − ∗ − I + I+ (6)
The computed monthly potential evaporation in Equation 3 is for a standard month with 360 hours of daylight. It must be corrected for the varying length of day with latitude using the appropriate correction factor. For the evaluation of the actual evaporation the Thornthwaite water balance model [6] was utilized. The required parameters to determine actual evaporation using this model are mean monthly precipitation mean monthly potential evaporation.
3.3 Markovian model
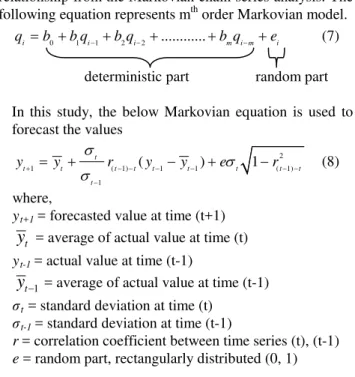
relationship from the Markovian chain series analysis. The following equation represents mth order Markovian model.
0 1 1 2 2 ...
i i i m i m i
q =b +b q− +b q− + +b q− +e (7)
In this study, the below Markovian equation is used to forecast the values
2
1 ( 1) 1 1 ( 1)
1
( ) 1
t
t t t t t t t t t
t
y y σ r y y eσ r
σ
+ − − − − − −
−
= + − + − (8)
where,
yt+1= forecasted value at time (t+1)
t
y
= average ofactual value at time (t) yt-1 = actual value at time (t-1)1
t
y
− = average ofactual value at time (t-1)σt= standard deviation at time (t)
σt-1= standard deviation at time (t-1)
r = correlation coefficient between time series (t), (t-1) e = random part, rectangularly distributed (0, 1)
4. Results and discussion
The coupled data driven-evaluation scheme (Genetic Process and Genetic Algorithm) for evaporation prediction in reservoir was developed and demonstrated. The variable Tt, RHt, Vt appears in equation 2. The above parameters in the equation shows, the evaporation in Kovilar reservoir is related with meteorological parameter temperature, wind velocity and relative humidity from the given input variables. The velocity term appears in the model shows that velocity of wind imparts main reason for evaporation. This is observed that the study area don’t have obstruction, hence free wind movement occurs. And relative humidity of an air-water system is dependent not only on the temperature but also on the absolute pressure of the system of interest. Similar findings were earlier reported by [11]. The term sunshine hour does not appear in the developed model. It is observed that this term indirectly appeared in the form of temperature. During the GP model development, the exponential term was included. But in final model instead of exponential term, the trigonometrical term arrived. This shows that there is a chance for the seepage along with evaporation.
Thornthwaite method shown lesser efficiency and correlation coefficient compare to GP model both in training and testing periods in table 1. This probably due to the Thornthwaite method considers only temperature and precipitation in the model. In GP model, evaporation process depend on many more meteorological parameters such as temperature, relative humidity, and wind velocity
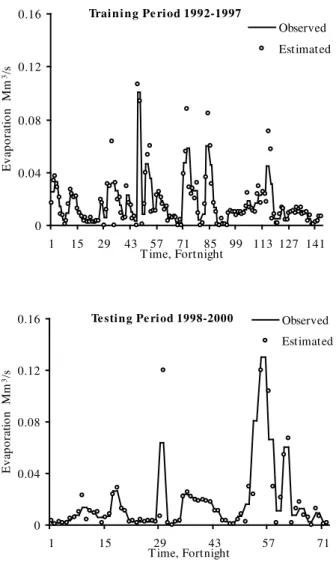
which are directly as well as indirectly affecting the process. At the same time as the GP model performs very well because the GP has the ability to learn the non-linearities. The fig 2 shows the observed and computed value of GP during training and testing period. It uses the appropriate functions that are having input-output relationship. Moreover, the optimization takes place both constant and variables which involves in the model generation.
Table 1: Performance evaluation of static GP and Thornthwaite model
Model
Model performance in different period Training
(1992-1997)
Testing (1998-2000) CC
(%)
CE (%)
CC (%)
CE (%)
GP 88.7 77.4 84.3 73.9
Thornthwaite 73.1 68.5 67.0 61.3
The developed GP evaporation model has been utilized for finding the possible future climate change in Pilavakkal reservoir. This needs three parameters (i.e. temperature, wind velocity and relative humidity) for the estimation of evaporation at a given time (t). Hence, the forecasting of these three parameters performed using Markovian chain series analysis for the next 50 years (2001-2050).
Markovian chain series analysis determines the relationship between dependent variables (temperature, wind velocity and relative humidity) and independent variable (time). The major advantage of using this method is taking the sessional variation of climatical parameters. It satisfies the statistical conditions by taking care of standard deviation and correlation between the data serious. The randomly generated part minimises the error in the system. Thus, it provides meaningful forecasted values. It is clearly presented in the table 2. It shows the values of temperature variation in the next 50 years. Mean annual temperature and evaporation values are calculated for the year 2000 from the observed data and it is reported as 29.08°C and 30.9 x10³ m3 respectively. It is fixed as a base period to calculate the increase in temperature and evaporation values in future. Based on this, the variation is presented in table 2. Due to the climate change effect, there is an increase in annual temperature 1.09°C in the year 2025 and 2.14°C in the year 2050 occurred in Kovilar reservoir.
Training Pe riod 1992-1997
0 0.04 0.08 0.12 0.16
1 15 29 43 57 71 85 99 113 127 141
T ime, Fortnight
E
va
por
a
ti
on M
m
3/s
Observed
Estimated
Te sting Pe riod 1998-2000
0 0.04 0.08 0.12 0.16
1 15 29 43 57 71
T ime, Fortnight
E
va
por
a
ti
on M
m
3/s
Observed
Estimated
Fig. 2 Observed and estimated evaporation by GP model for Kovilar reservoir.
Table 2: Forecasting of temperature using Markovian chain series
analysis
No Time series
Length of Record in years
Annual Mean Value in °C
Inc. in actual value
from base period
in °C
1 1992-2000 9 29.08 (2000)
---- 2 2001-2025 25 30.17
(2025)
1.09 3 2026-2050 25 31.22
(2050)
2.14
Table 3: Prediction of evaporation using Genetic Programming modeling approach
No Time series
Length of Record in year
Annual Mean Value in m3x103
Inc. in actual
value from base
period in m3x103
Inc. in %
1
1992-2000 9 30.90 (2000)
---- ----
2
2001-2025 25 34.30 (2025)
3.40 11
3
2026-2050 25 36.13 (2050)
5.23 17
*(Annual mean value at a particular time period)
Evaporation is directly proportional to temperature. From the obtained results, it is verified that mean annual evaporation loss increases upto 17% with 7.35% increase in temperature during they year 2050. Finally, it is observed that the approach adopted here is more rigorous in regional basis. It considers changes in temperature, and evaporation due to climate change scenario.
5. Conclusions
Two approaches (GP and Thornthwaite method) have been applied for Kovilar reservoir. From this study, GP has good potential for the non-linear effects by considering the parameters which having more influence to affect the evaporation process. GP model results are compared with Thornthwaite model. GP model gives satisfactorily better performance than Thornthwaite model. Thornthwaite model underestimates the evaporation this may be due to the empirical nature. These models are calibrated for a certain set of conditions and that it may not be applicable outside of this environment. These models, being developed with the local data alone, offers obvious advantages over the general evaporation models which are very generic. Thus, GP model provides the promising algorithm which can accurately estimate the local evaporation losses. Markovian chain series generates a reliable forecasted value which is used to calibrate the GP model. These models could be a better choice for climate change prediction in regional basis level. This can be coupled with General Circulation Models (GCMs) to predict the global climate change.
References
rainfall-runoff data”, Water resources management, Vol. 18, No. 3, 2004, pp. 285-300.
[2] V. Babovic, and M. Keijzer, “Rainfall runoff modeling based on genetic programming”, Nord Hydrol., Vol. 33, 2000, pp. 331–346.
[3] H. F. Blaney, and W. D. Criddle, “Determining water requirements in irrigated area from climatological irrigation data”, Soil Conservation Service Technical Paper no. 96., US Department of Agriculture, Washington DC, USA, 1950. [4] U. K. Chakraborty, and D. G. Dastidar, “Using Reliability
Analysis to Estimate the Number of Generations to Convergence in Genetic Algorithms”, Information Processing Letters, Vol. 46, 1992, pp.199-209.
[5] L. Davis, “Handbook of Genetic Algorithms”, Van Nostrand Reinhold, New York. 1991.
[6] T. Dunne, and L. B. Leopold, “Water in Environmental Planning”, W. H. Freeman, New York, 1978.
[7] D.E. Goldberg, Genetic algorithms. In: Search, “Optimization and Machine Learning”, Addison-Wesley, New York, 1989.
[8] IPCC, Climate Change 1995: The science of Climate Change. J. T. Houhgton, L. B. Meira Filho, B. A. Callander, N. Harris, A. Kattenberg, and K. Maskell, (eds.). Intergovernmental Panel on Climate Change, Cambridge University Press, Cambridge, 2001.
[9] A.W. Jayawardena, and D. A. K. Fernando, “Use of radial basis function type artificial neural networks for runoff simulation”, Computer-Aided Civil and Infrastructure Engineering, Vol. 13, No. 2, 1998, pp. 91-99.
[10] P. Kamban, A. Elshorbagy, and S. K. Carey, “Modelling the dynamics of the evapotranspiration process using genetic programming”, Hydrological Sciences, Vol. 52, No. 3, 2007.
[11] K. S. Kasiviswanathan, and K. G. Jeganathan, “Regional empirical models for predicting evaporation losses from reservoirs”, B.Tech thesis work, 2006.
[12] S. T. Khu, S. Y. Liong, V. Babovic, Madsen, and N. Muttil, “Genetic programming and its application in real-time runoff forecasting”, J Am Water Resour Assoc., Vol. 37, 2001, pp. 439–451.
[13] J. R. Koza, “Genetic programming: on the programming of computers by natural selection”, MIT Press, Cambridge, MA, 1992.
[14] V. Lakshminarayana, and S. P. Rajagopalan, “Optimal cropping pattern for basin India”, J. of Irrig. Drain. Division, ASCE 103, (IR1), 1977, pp. 53-71.
[15] J. L. Monteith, “Evaporation and environment in the state and movement of water in living organisms”, In: Proc. Society of Experimental Biology., Symposium no. 19, 1965, pp. 205–234, Cambridge University Press, Cambridge, UK.
[16] H. L. Penman, “Natural evaporation from open water, bare soil and grass”, Proc. Roy. Soc. London, Vol. 193, 1948, pp. 120–146.
[17] C. H. B. Priestley, and R. J. Taylor, “On the assessment of surface heat flux and evaporation using large scale parameters”, Mon. Weather Rev., Vol. 100, 1972, pp. 81– 92.
[18] H. Raman, S. Mohan, and N. C. V. Rangacharya, “Decision support for crop planning during droughts”, J. of Irrig. Drain. Eng., ASCE Vol. 118, No.2, 1992, pp. 229-241. [19] J. C. Stephens, and E. H. Stewart, “A comparison of
procedures for computing evaporation and evapotranspiration”, In: Publication 62, International Association of Scientific Hydrology, 1963, pp. 123–133, International Union of Geodesy and Geophysics, Berkeley, California, USA.
[20] G. Surabhi, and M. C. Deo, “Real-time wave forecasting using genetic programming”, Ocean Engineering, Vol. 35, 2008, pp. 1166– 1172.
[21] C. W. Thornthwaite, “An approach toward a rational classification of climate”, Geographical Review, Vol. 38, 1948, pp. 55-94.
[22] C. W. Thornthwaite, and J. R. Mather, “Instructions and Tables for Computing Potential Evapotranspiration and the Water Balance”, Publ. in Climatology, Vol. 10, No.3, 1957. [23] B. Zhang, and S. Govindaraju, “Prediction of watershed
runoff using Bayesian concepts and modular neural networks”, Water Resources Research, Vol. 36, No.3, 2000, 753-762.
*K.S. Kasiviswanathan has received his master degree in water resources development in IIT Roorkee and currently pursuing his PhD in IIT Madras. His research interest includes application of soft computing tools in water resources with uncertainty quantification.
R. Soundhara Raja Pandian has received his BE (ECE) in Anna University, Chennai, MBA (HR) in Madras University and currently pursuing ME in Embedded System Technologies. His core research area includes Parallel Computing and Cloud Computing in Education.
S. Saravanan obtained his doctorate in IIT Roorkee and currently working as an assistant professor in NIT Trichy. His research area includes watershed management with GIS applications. He has published several papers in reputed international journals and conferences.