Abstract—Due to the requirements of high-precise platform applications on semi-conductor and precise mechanical equipments, the developments in transmission ability of high-performance ball screw is now became important in manufacturing industry. However, the actual contact state on surface of ball screw is still hard to measure. In this paper, a two-ring tribology testing machine was used to simulate contact state of ball screw under heavy load and high sliding speed; and several coefficients, including friction coefficient, electric resistance value of oil film, temperature increasing of specimens, and variation of lubricant temperature under various normal loads, sliding speeds, and additive ratio of micro particles. The values of specific film thickness and contacting electric resistance indicated that the contact state of ball screw appeared boundary lubrication under high load and medium low rotation speed, and which Stribeck curve gradually moved down-left during operation. The results of experiment indicated that adding particle additive to the lubricant could effectively control the lubrication region of contact surface to reduce abrasion, temperature of surface and lubricant, roughness of friction surface, and also increase the content of oxygen on the film surface.
Index Terms—Ball screw, Friction, Lubrication regime, Stribeck curve, Wear
I. INTRODUCTION
The production technique of ball screw has almost developed completely in recent years, but the theory basis analysis, research of lubrication effect, and developments of high quality ball screw materials also need to promote. For these reasons, the analyses of ball screw’s contact and motion behavior are the important tasks for high-performance ball screw to become high-precise industries. Therefore, finding out the influences between each parameters and ball screw are very important for its design. Ro and Hubble [1] found that the friction on ball screw caused by elastic deformation, which lets sliding phenomenon occurred on the contact surfaces of ball-screw, and ball-nut. They also indicated that the friction and sliding phenomenon are the main reasons affecting the precision of ball screw position.
For improving the precision of ball screw, Yamamoto et al [2] reported that the model-based feedforward disturbance compensation for the ball screw-driven table system considered the inching motion. In the research, the nonlinear
Jeng-Haur Horng is with the National Formosa University of Department
of Power Mechanical Engineering, phone: 886-5-6315405~8; fax:
886-5-6315952; e-mail: [email protected].
Shin-Yuh Chern is with the National Formosa University of Department
of Power Mechanical Engineering, phone: 886-5-6315433; fax:
886-5-6312110; e-mail: [email protected].
Chin-Chung Wei is with the National Formosa University of Department
of Power Mechanical Engineering, phone: 886-5-6315414; fax:
886-5-6312110; e-mail: [email protected].
Yuh-Ping Chang is with the Kun Shan University of Department of Mechanical Engineering, phone: 886-6-2050361; fax: 886-6-2050509; e-mail: [email protected].
friction with elastic behaviors was precisely formulated as the mathematical disturbance model, and the model was applied for the feed-forward compensation. The experimental results were to verify the effectiveness of the proposed approach by the actual table drive system. Ueda et al. [3] investigated the frictional torque of preloaded ball screws with double nut operated under various oscillatory angles, and also compared the frictional torque of ball screw with ball separators and the ball screw without ball separators. Separators can reduce vibration of ball screw, and friction between balls.
Weule and Gollz [4] introduced that increasing preload on a ball screw would reduce the backlash between each element on ball screw and increase overall stiffness of ball screw effectively. However, increasing preload also would simultaneously increase friction loss and cause heat; and the increase of abrasion would simultaneously reduce the operating life of ball screw. Bhattacharyya et al. [5] indicated a theory for calculating stiffness of ball screw and confirmed with experiment results. They found that ball screw had three stiffness parameters, including loop number of ball, value of preload, and influence of friction.
Wei et al. [6] established a theory analysis of ball screw friction considered with and without lubricant. The results showed that the lubricant could reduce friction effectively, especially under higher rotational speed condition. Christian et al. [7] explored wear behavior and preload loss on ball screw machine by using lubricant additive, and the results indicated that using lubricant additive could reduce the wear behavior and preload loss more effective than without using lubricant additive. In recent years, it was found that adding particles in lubricant could reduce direct contact of micro prominent bodies on two contacting surfaces in relative motion, in order to reduce friction and protect the surfaces. Later Yan-li et al. [8] indicated that adding nano-particle of silica on wear surface would increase extreme pressure and anti-wear properties of lubricant substantially. Dong Ling et al [9] used Si-Sn composite nano additive as mineral oil additive and took experiments on four-ball friction / wear tester and link block friction / wear tester. The results of this experiment indicated that the Si-Sn composite nano additive would deposit on the friction surfaces, melt and spread on the contact areas under high temperature and high pressure conditions, and then form the surface film with low shear strength on contact surfaces which could reduce the adhesive wear of friction interface, and show the reducing friction, anti-wear, and self-repair properties well.
It is difficult to know the inside contact state in a ball screw system, because ball screw is closed machinery, the friction, wear, and lubricant state on the contact surfaces of ball-screw and ball-nut is thus hard to predict. Therefore, the analyses of contact and motion behaviors on each element inside ball screw are very important to develop transmission ability of high-performance ball screw in the development of
Experimental Simulation of Tribolgical Study for the
Mechanism in a High Speed-Heavy Load Ball Screw
recent precise technology industries.
With the rapid changes in technology, the requirement of ball screw is not only a transmission function for industry; it tends to the development of heavy load and high rotational speed. In this study, a two-ring tribology testing machine was used to simulate sliding state of ball screw under high load and high sliding speed and also analyzed and explored the variation of oil film electric resistance and lubrication region under the states of friction coefficient, material temperature increase, and lubricant temperature increase by using lubricant with additive.
II. EXPERIMENTATION A. Contact simulation apparatus
In this study, a two-ring tribology testing machine was used to simulate operation of ball screw. As Fig.1, this machine could use several kinds gear pair with different sliding-roll ratios to produce several motion of contact surface, and it can take immediately record of load, friction, and electric resistance value of oil film during all experimental process.
(a)
(b)
Fig1. The disc machine (a) and the configuration of the disc housing (b).
The upper and lower workpieces used in this experiment were design with geometric curvature of the ball screw. In this experiment, the known data were curvature radius of the balls and screw, and presetting diameter of workpieces, which the simulated ball curvature radius was 3.18mm and the screw curvature radiuses were 3.43 and 47.75mm. Then the simulated curvature radius of workpieces for a ball screw
was calculated by equation of composite curvature, and shown as
y x
y x
R R
R R R
(1) where Rx is composite curvature radius in the x direction of
ball and screw, and Ryis the composite curvature radius in the
y direction, then the R isfigured composite curvature radius which could design the curvature radius of simulated ball screw, and the driving wheel are R1x=80mm and R1y=∞, the
driven wheel are R2x=80mm and R2y=1.1mm. In this
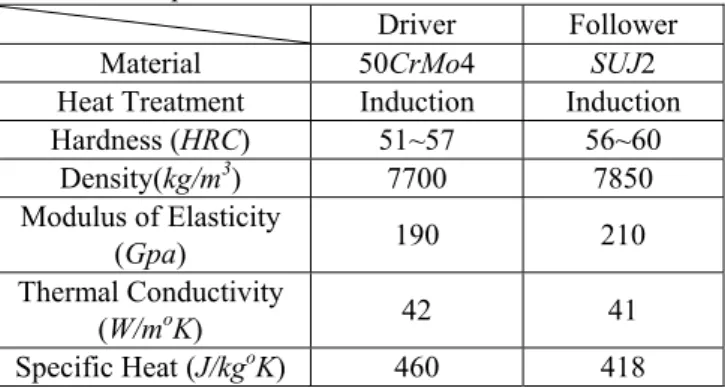
experiment, the simulated ball of driven piece and the simulated screw of drive piece were the materials which designed for simulating the mechanical and heat properties of screw as Table 1.
Table 1 Data of mechanical and thermal properties of workpieces
Driver Follower
Material 50CrMo4 SUJ2
Heat Treatment Induction Induction
Hardness (HRC) 51~57 56~60
Density(kg/m3) 7700 7850
Modulus of Elasticity
(Gpa) 190 210
Thermal Conductivity
(W/moK) 42 41
Specific Heat(J/kgoK) 460 418
B. Lubricant
The major content of lubricant in this experiment was paraffin base oil, and its properties were shown as Table 2. The contents of additive used in the experiment were MgO
and SiO2, and the total quantity of additive was 0.02 wt%
times than lubricant. It used oil bath in this experiment, and the oil surface was higher than the bottom of workpieces about 2 mm.
Table 2. Lubricant property
Item values Density (15.6℃, g/ml) 0.881
Viscosity (cSt)
67.1(40℃) 8.74(100℃) Viscosity index (VI) 102 Flash Temoerature(℃) 260
Thermal Conductivity
(W/moC) 0.145 Viscosity-Pressure
Coefficient (Gpa-1) 2.37 Motor
Gears
Samples Disc Housing
Thermocouple Lubricant
(130ml)
Disc Housing
Driver Disc
C. Experiment parameters
The gear ratio used in this paper was 20:60; the rotation speeds were 700, 400, and 100rpm individually, and the sliding speed and roll speed between surfaces were shown in Table 3. In this experiment, the loads were 50N, 150N, and 300N with the relative average Hertz Pressure were 1.56Gpa, 2.25Gpa, and 2.84Gpa individually.
Table3.Gear ratio and Speed Main shaft rotation
speed(rpm)
Sliding speed(m/s)
Roll speed(m/s)
700 1.95 0.98
400 1.12 1.41
100 0.28 2.65
D. Specific film thickness
The oil film formula used in this paper was the oil film formula of point contact, by Hamrock and Dowson [13] Specific Film Thickness
k
m e
R E
F E
R E U
H 0.68
073 . 0 49
. 0 68 . 0
0 1
' ' ' '
' 63 .
3
(2)
In this formula, U is sliding speed (m/s) between contact surfaces, ηo is atmospheric pressure viscosity (Ns/m2), E′ is
composite modulus of Young, R′ is composite curvature
radius (m), β is viscosity-pressure coefficient of lubricant (m2/N), F is load(N), e is exponential function, and k is elliptical parameter(m). The specific film thickness of root mean square (RMS) roughness in each workpieces could be figured out by the oil film thickness formula, Hm/σ , which was figured out by various preload and sliding speed.
III. RESULTSANDDISCUSSION
In order to know lubrication properties under various operation conditions, this paper adopted three kinds of experiment parameter to explore contact electric resistance and friction coefficient during experimental process. Contact electric resistance, friction coefficient, temperature of lubricant and workpiece operating under normal load 300N and sliding speed 0.28m/s. The situation simulates a ball screw system, which contact pressure reaching 2.84 Gpa and low sliding speed on ball-screw contact surface. The figure indicates that the contact electric resistances were all about 0.07kΩ during 200 min, means it was exactly the boundary
lubrication which between contact surfaces. Table 4 shows that the specific film thickness deduced from the final measured lubricant temperature at 25℃ were 1.24 and 1.11; it verified that the motion pair exactly operated under boundary lubrication. The oil temperature only increased from 25℃ to 27.5℃because the operating condition was low sliding speed and the friction heat was not too high; and the temperature of workpieces only rised to 34 ℃ because the heat lost in atmosphere when it transmitted from contact areas of workpieces to lubricant. The friction coefficient started from about 0.13 because of the boundary lubrication, but it gradually decreased to about 0.105 because of the element of initial run-in period.
If the sliding speed was rised from 0.28m/s to1.12m/s, and the load also increased from 300N to 150N as shown in Fig. 2(b), it can be found by comparing with specific film thickness that the initial specific film thickness (h/δ)=3.36 (>3.0) was close to the fluid film lubrication, so the starting contacting heat resistance was beyond 10KΩ (illustrated by
dotted line when it was beyond 10KΩ). However, the oil
temperature increased with motion pair and decreased the viscosity of lubricant, and the film became thin to cause the decrease of contact electric resistance when the oil temperature reached about 39℃ (after about 140 min) From Formula (2) it can be figured out that the specific film thickness (h/δ)=1.96 (3.0>1.96>1.5)was mixed lubrication, so the contact electric resistance finally declined to 1.5KΩ
and became stable. Due to the increase of speed caused the increase of friction heat, made the oil temperature increase to 37℃, and workpieces increase to 39℃. The friction coefficient as Fig. 2(a) declined from 0.105 to 0.085 because the boundary lubrication declined to mixed lubrication.
As Fig.2(c) shows that when the sliding speed increased to 1.95m/s (high-speed ball screw), its contact electric resistance was all lower than 10KΩ before 90 min, because
its initial specific film thickness was (h/δ)=5.33 (Table 4(a)), and the contact electric resistance started to decline when the temperature reached 46℃. However, when the experiment temperature was stable after it reached 200 min (about 50 ℃), its contact electric resistance was still about 5 to 6 KΩ.
Therefore, it indicated this operation was fluid film lubrication region. The comparison figure of Fig. 2(b) and Fig. 2(c) indicates that the oil thickness was still beyond 1.12m/s. In Fig 2(c), the sliding speed was 1.95m/s higher than 1.12m/s in Fig 2(b), so the level of temperature increase was also the same case. The most noteworthy thing was that the initial specific film thickness already reached about 5.33, so the initial friction coefficient was 0.07; but the specific film thickness increased to less than 1.97 as temperature increased, so the friction coefficient would gradually increase. This situation was different from Fig 2(a) that start with boundary friction and the friction coefficient decreased gradually.
Table4(a) Oil film thickness and specific film thickness with load and speed under 25℃.
Load Sliding Speed
(m/s) Hm( m)
Specific film thickness 300N
(2.84Gpa)
1.95 1.12 4.67
1.12 0.77 3.19
0.28 0.30 1.24
150N
(2.25Gpa)
1.95 1.18 4.91
1.12 0.81 3.36
0.28 0.31 1.31
50N
(1.56Gpa)
1.95 1.28 5.33
1.12 0.87 3.64
Table4(b) Oil film thickness and specific film thickness with load and speed under 200 min testing.
Load Sliding Speed
(m/s) Hm( m)
Specific Film Thickness 300N
(2.84Gpa)
1.95 0.70 2.72
1.12 0.48 1.99
0.28 0.27 1.11
150N
(2.25Gpa)
1.95 0.88 3.66
1.12 0.64 2.68
0.28 0.28 1.23
50N
(1.56Gpa)
1.95 1.13 4.34
1.12 0.77 2.98
0.28 0.30 1.33
Summery, it indicates that the operation conditions of the above experiment included boundary lubrication, mixed lubrication, and fluid film lubrication. The experiment of lubrication region can be shown in Fig.3, it shows experimental results of friction coefficient, speed, viscosity, and load variation to draw Stribeck chart.
0 20 40 60 80 100 120 140 160 180 200
Test Time (minutes) 20 25 30 35 40 45 50 55 60 65 T em p er at u re ( )
F=300N, Sliding velocity:0.28m/s Temperature of Oil Temperature of Workpiece Friction Coefficient Contact Resistance 0.02 0.04 0.06 0.08 0.10 0.12 0.14 0.16 0.18 0.20 F ric ti o n C o ef fi ci en t 0 1 2 3 4 5 6 7 8 9 10 C o n tact R esi st an ce ( k ) oC
Fig 2(a). contact electric resistance, friction coefficient, lubricant temperature and workpiece temperature under conditions of 300N and 0.28m/s
0 20 40 60 80 100 120 140 160 180 200
Test Time (minutes) 20 25 30 35 40 45 50 55 60 65 Te m p er at ur e ( )
F=150N, Sliding velocity:1.12m/s Temperature of Oil Temperature of Workpiece Friction Coefficient Contact Resistance 0.02 0.04 0.06 0.08 0.10 0.12 0.14 0.16 0.18 0.20 F ri ct io n C o ef fi ci en t 0 1 2 3 4 5 6 7 8 9 10 C o n ta ct R esi st an ce (k ) oC
Fig 2(b). contact electric resistance, friction coefficient, lubricant temperature and workpiece temperature under conditions of 150N and 1.12m/s
0 20 40 60 80 100 120 140 160 180 200
Test Time (minutes) 20 25 30 35 40 45 50 55 60 65 Temperat u
re ( )
F=150N, Sliding velocity:1.95m/s Temperature of Oil Temperature of Workpiece Friction Coefficient Contact Resistance 0.02 0.04 0.06 0.08 0.10 0.12 0.14 0.16 0.18 0.20 F ri c ti o n C o ef fi ci en t 0 1 2 3 4 5 6 7 8 9 10 Contact Resi stance (k ) oC Fig 2(c). contact electric resistance, friction coefficient,
lubricant temperature and workpiece temperature under conditions of 150N and 1.95m/s
This chart was convenient to realize the lubrication region under different experiment parameters. Comparing with initial specific thickness and Stribeck chart, it can be known that under the operation conditions of screw, the fluid film lubrication would appear when the specific film thickness (h/σ) was >4; the boundary lubrication would appear when the specific film thickness (h/σ) was <1.5; and the mixed lubrication would appear when the specific film thickness was 4 < (h/σ) <1.5. The Stribeck chart moves down-left as time varied, because the lubrication lets the friction coefficient decreased and causes the down moving; and also made temperature increased and viscosity thus decreased.
0 3E-011 6E-011 9E-011 1.2E-010 1.5E-010 1.8E-010
(Viscosity) (Velocity) / Load 0.02 0.04 0.06 0.08 0.10 0.12 0.14 F ric tion Coe ff icie n t
Friction Coefficient ( Initial ) Friction Coefficient ( 10 min ) Friction Coefficient ( 200 min ) Specific Film Thickness ( Initial ) Specific Film Thickness ( 200min)
0 1 2 3 4 5 6 7 Spec if ec Film Thic k ne ss
Fig. 4(a) and Fig. 4(b) are temperature comparison charts of workpiece and lubricant which used pure lubricant with 2 wt% particle additive (Mg6Si4O10(OH)8) under 150N
and 300N load. It can be known that the temperature increasing trend of lubricant and workpieces were the same after using additive, and the temperature would increase significantly as the sliding speed increase. Comparing the lubricants with additive and without additive, it can be found that the temperature of lubricant with additive and workpieces were much lower than without additive.
0.28m/s 1.12m/s 1.95m/s
25 30 35 40 45 50 55 60 65
Te
m
p
e
ra
tu
re
(
)
150N
Temperature of Workpiece (Liquid oil) Temperature of Workpiece (Liquid oil+Particle) Temperature of oil
Temperature of Liquid oil+Particle
oC
Fig 4(a). Temperature of comparison for the different
lubricant under 150N
0.28m/s 1.12m/s 1.95m/s
25 30 35 40 45 50 55 60 65
Te
mp
e
rat
u
re
(
)
300N
Temperature of Workpiece (Liquid oil) Temperature of Workpiece(Liquid oil+Particle) Temperature of oil
Temperature of Liquid oil+Particle
oC
Fig 4(b). Temperature comparison for different lubricants under 300N .
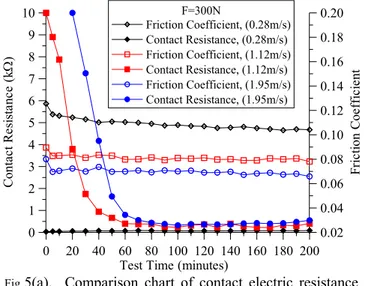
Fig. 5(a) is the variation chart of friction coefficient and contact electric resistance under various sliding speeds and high load (2.84Gpa). It shows that the friction coefficient increased and the contact electric resistance decreased with the sliding speed. Because the boundary lubrication occurred at contact areas become significantly as the sliding speed decreased. When the sliding speed set as 1.12m/s and 1.95m/s and began with fluid film lubrication, the electric resistance became much larger than without lubricant, because the higher sliding speeds made thicker lubrication film. However, the temperature also gradually increased with rising operation speed, and the thermal due to the increased friction cause the decrease of lubricant viscosity, thinner oil film, and lower contact electric resistance. If the lubricant in
Fig. 5(a) was added to the particles, but other condition were unchanged, the variation chart of friction coefficient and contact electric resistance under various speed can be shown as Fig.5 (b). The variation trends of Fig. 5(a) and Fig. 5(b) are the same. The electric resistance would decrease and the friction coefficient would increase as the speed decrease, but from the comparison of Fig. 5(a) and Fig. 5(b), it can be found that the variation of friction coefficient on interface after adding particles was not significant, but the contact electric resistance was much bigger than Fig. 5(a) which without adding particles. This was because the temperature of lubricant and workpieces after adding particles as Fig. 5(b) would decrease; the level of film thickness would become higher to cause the contact electric resistance become higher. Fig.6(a) was the total wear volume when using different lubricants under different sliding speed for 200 min testing. The film of pure lubricant would become thinner under low speed, so the total sliding distance was much shorter and still had more wear volume even operating for 200 min. Although the wear volume would increase as the speed decrease, it still had the ability to reduce the wear volume under different sliding speed after adding particles into lubricant, especially under low speed. If the applied normal load increased to 300N, the effect of reducing wear volume would become much more significant as Fig. 6(b) with the particles in lubricant. The results of Fig. 6(a) and Fig. 6(b) indicate that the lubricant particles under operating conditions of this experiment can reduce wear volume, and have better wear protecting effect under heavy load and low rotation speed. The experiment results shows that adding this kind additive into lubricant could effectively let wear volume reduced, and increase positioning precision and using life of ball screw. Using scanning electron microscope to measure the surface of wear area, and comparing the roughness of surfaces on the wear areas after testing with additives and without additives, it can be found as Fig. 8 that the roughness of surface would decline significantly after using additives.
0 20 40 60 80 100 120 140 160 180 200 Test Time (minutes)
F=300N
Friction Coefficient, (0.28m/s) Contact Resistance, (0.28m/s) Friction Coefficient, (1.12m/s) Contact Resistance, (1.12m/s) Friction Coefficient, (1.95m/s) Contact Resistance, (1.95m/s)
0.02 0.04 0.06 0.08 0.10 0.12 0.14 0.16 0.18 0.20
F
ric
ti
o
n
C
o
effi
ci
en
t
0 1 2 3 4 5 6 7 8 9 10
C
o
n
ta
ct
R
es
is
tan
ce
(k
)
Fig 5(a). Comparison chart of contact electric resistance
0 20 40 60 80 100 120 140 160 180 200 Test Time (minutes)
F=300N, Liqulid oil+Partile Friction Coefficient, (0.28m/s) Contact Resistance, (0.28m/s) Friction Coefficient, (1.12m/s) Contact Resistance, (1.12m/s) Friction Coefficient, (1.95m/s) Contact Resistance, (1.95m/s)
0.02 0.04 0.06 0.08 0.10 0.12 0.14 0.16 0.18 0.20
F
ric
ti
o
n
C
o
ef
fi
ci
en
t
0 1 2 3 4 5 6 7 8 9 10
Contact
Res
ist
ance (k
)
Fig 5(b). Comparison chart of contact electric resistance and friction coefficient under 300N, 1.95、1.12, 0.28m/s sliding speed, and additive 0.02 wt%
IV. CONCLUSION
The variations of load, rotation speed, lubricant temperature, and contact electric resistance all had relationships under the different lubricant regions. The testing condition of this study were in several lubrication regions, including boundary, mixed, and fluid film lubrication, it can thus be realized from this simulated experiment that the variation of contact property to a ball screw system under different lubricant region. Several conclusions made as:
1. In the Stribeck figure, it can be seen that the curve of contact surface between ball and screw would gradually move down-left during the operation.
Fig 6(a). Wear loss by using and without using additive at
different sliding speed under 150N.
Fig 6(b). Wear loss by using and without using additive at different sliding speed under 300N.
(a)
(b)
Fig 7. Surface topography of SEM carried out under 150N
load, 700rpm rotation speed(a) without additive, and (b) with partile additive.
2. If in the boundary lubrication, the friction coefficient would reduce by started wear; if in fluid film lubrication, the friction coefficient would increase with increasing the workpiece temperature. If in mixed lubrication, the friction coefficient did not varied significantly with operating conditions.
Un-wear area:Ra=0.16um
Wear area: Rq=0.14um
Wear area: Rq=0.12um
3. Although using particles additives in boundary lubricant and mixed lubricant regions, experiments shown that additives did not affect significantly to friction. But they can decrease the workpieces temperature and reduce the wear volume to increase the using life for a ball screw.
REFERENCES
[1] P.I. Ro, and P.I. Hubbel, "Model Reference Adaptive Control of Dual-mode Micro/macro Dynamics of Ball Screws for Nano-meter Motion," ASME Journal of Dynamic Systems, Measurement and Control, Vol. 115, No.1, 1993, pp. 103-108.
[2] M. Yamamoto, M. Iwasaki, K. Ito, and N. Matsui, "Disturbance Compensation in Inching Motion of Ball Screw-Driven Table System," Proceedings of 10th International Workshop on Advanced Motion Control, 2008, pp.224-228
[3] M. Ueda , H. Shimoda, and N. Hiraga, "Frictional Characteristics of Ball Screws under Oscillating Operation," KYOTO World Tribology Congress, 2009, p.492.
[4] H. Weule, and H.U. Golz, "Preload-control in Ball Screw – A New Approach for Machine Tool Building, " Annals of the CIRP, Vol. 40, 1991, pp. 383-386.
[5] A. Bhattacharyya, A.B Chatterjee, and G.L Manwani, "Rigidity Analysis of Re-circulating Ball Screw Nut Assembly with a Semi-circular Thread Form, " Annals of the CIRP, Vol. 19, No.1, 1971, pp.87-93.
[6] Chin-Chung, Wei., Jen-Fin, Lin., and Jeng-Haur, Horng., "Analysis of a Ball Screw with a Preload and Lubrication, "SCI Tribology International, Impresse, 2009.
[7] B. Christian, W. Stephan, and Y. Türker, "Influences of oil additives on the wear behavior of ball screws, "Production Engineering, Vol.3, NO.3, 2009, pp.323-327.
[8] L. Yan-li, L. Fang, and Z. Xiao-song, "Research on Preparation and Tribological Properties of Nano-SiO2 Modified with Polymer, "
Journal of Hunan Institute of Engineering, Vol. 19, No.1, 2009, pp.34-38.