ISSN online: 1807-1775
DOI: 10.4301/S1807-17752014000100005
_____________________________________________________________________________________ Manuscript first received/Recebido em: 14/09/2012 Manuscript accepted/Aprovado em: 05/02/2014 Address for correspondence / Endereço para correspondência
Frederico Wergne de Castro Araújo Filho. Integrated Center of Manufacture and Technology – National Service of Industrial Learning – DR. Frederico has an MSc from Senai Cimatec. His research interests are Automating Manufacturing Systems and RFID. Adress: Av. Orlando Gomes 1845 – Piatã, Salvador, Bahia - Brazil, 41650-050. Phone: 71.3462-9500/ Fax: 71.3462-9599 E-mail: [email protected]
X. L. Travassos . Federal University of Santa Catarina (UFSC). He finished his PhD at the L’Ecole Centrale de Lyon
(France). His research interests are Numerical Modeling and Industrial Engineering. Adress: Rua Presidente Prudente de Moraes, 406, Santo Antônio, 89218-000 - Joinville, SC - Brasil. Phone: 47.3461-5900 E-mail:
Paulo S. Figueiredo. Integrated Center of Manufacture and Technology – National Service of Industrial Learning –
DR. Paulo has a Doctoral Degree from Boston University and does research in Operations Management. His research interests include System Dynamics modeling and Product Pipeline Management. Adress: Av. Orlando Gomes 1845 – Piatã, Salvador, Bahia - Brazil, 41650-050. Phone: 71.3462-9500/ Fax: 71.3462-9599 E-mail:
USE OF THE RFID TECHNOLOGY TO OVERCOME
INEFFICIENCIES IN THE PRODUCTION PROCESS: AN
ANALYSIS OF A MICROCOMPUTER COMPANY IN ILHÉUS
–
BAHIA
Frederico Wergne de Castro Araújo Filho X. L. Travassos
Paulo S. Figueiredo
Integrated Center of Manufacture and Technology – National Service of Industrial Learning – DR, Salvador, Bahia - Brazil
_______________________________________________________________________
ABSTRACT
This paper presents a methodology for the integration of RFID technology into microcomputer assembly companies. Such a technology enables inventory control, tracking of parts/products and customer satisfaction. The methodology was developed to identify and evaluate the production process in an assembly company and to apply the process FMEA to evaluate potential faults and propose improvement actions for the use of RFID technology. The methodology was validated in a company from the Pólo de Informática de Ilhéus/BA. In this study, the viability of RFID technology for inventory control and traceability of the product was confirmed. Among the benefits obtained were the reduction of one of the workers from the inventory team, reduction in the costs of substituting a component, and reduction in lead-time.
Keywords: RFID; Process FMEA; Site Survey; Process Automation; Inventory Management
1. INTRODUCTION
of RFID is that a radio frequency reader can read as many as 200 tags in a second without the line-of-sight requirement. Near-real-time tracking and tracing capabilities, together with item-level identification through EPC (electronic product code) standard, would allow a host of new improvements in inventory management (Whang, 2010). Among these improvements is increased efficiency by making products available at the right time and in the right place, with a lower operational cost. As a result, numerous manufacturing plants are adopting RFID technology for product tracking purposes, especially within sectors that move multiple parts through their facilities each day (Chow et al. 2006, Kach and Borzabad 2011). According to Stambaugh and Carpenter (2009), RFID systems are rapidly replacing Universal Product Codes (barcodes in many applications). According to Soares et al. (2008), inventories are the sectors that can potentially benefit the most from RFID technology. The benefits with its implementation go far beyond the mere change of the technology of automation of data capture. Its main objective is to increase the integration of the entire logistics chain, providing tools that enable tracking and control of the products that circulate in the chain (Fosso Wamba and Chatfield, 2009).
This case study initiates in 2008, motivated by research done in many microcomputer assembly companies of the Pólo de Informática de Ilhéus/BA. This group of companies is comprised of 20 assemblers of microcomputers. The raw materials are practically all imported from Asian suppliers (China, South Korea and Thailand, among others) and the companies supply the Brazilian market, specially the north and northeast regions of the country.
The difficulties faced by these companies in managing their inventories of raw materials and finished products, even using barcodes for quick identification during production, were the motivational factor behind this study. These difficulties motivated the development of the methodology of integration presented here.
The most relevant difficulties found in companies of the region are described below:
Sales of products that did not have all the necessary components as ordered
by the client. In such cases, the company frequently substituted the missing component(s) for a component of higher value. This might create a discrepancy between the inventory control system (database) and the actual inventory. RFID may help, in this case, by identifying and tracking all items contained in a product.
Traceability of components during the phases of assembly – when one component was damaged and was substituted for another one The control of this activity is performed, in most companies, by inspection, i.e. by manually filling a spreadsheet at the end of the working hours, and then inputting the information into the inventory control system (database). Such method was performed in the company being studied.
Problems while reading the barcodes during the phases of data insertion into
the ERP (Enterprise Resource Planning) system of the companies. In case there were many metal pieces, the RFID reading was performed with redundancy by means of a portal and a manual reader;
Manual control of the raw materials inventory.
modernize the company with an up-to-date solution. It is noteworthy that no other company in the region possesses this technology. The actual Internal Rate of Return (IRR) of the project was calculated by Araújo Filho et al. (2013) and its value is 15%.
RFID technology presents some advantages when compared to the barcode technology, previously used in the company. The method used to read the RFID tags enables them to be read at great speed compared to the barcode. The reading of an RFID tag does not depend on the line-of-sight requirement, and it can be reutilized or operated in hazardous environments or environments contaminated by dirt. The reutilization process is simple. It is just necessary to remove the used tags from the items and reattach them to new items.
This paper outlines the activities that were undertaken by a Brazilian microcomputer assembly company while implementing RFID technology. We explore the steps taken by the firm and outline where the company met its expectations or not. The microcomputer industry relies heavily on logistical techniques and inventory management, moving many parts throughout their system, received from multiple suppliers. As such, we believe our analysis can be useful for other firms hoping to use RFID technology to reduce their systematic inefficiencies. The cost of the tag is a problem to be faced, but it is not insurmountable. Tag prices tend to reduce over time and tags can be reutilized.
The innovative side of this research is the creation of a methodology for the integration of the RFID technology into the productive system of a company, to enable the adoption of such technology in companies that aim to increase and improve inventory control and product traceability. It is important to point out that this methodology aims to reduce potential impacts on the structure of the company, in order to facilitate integration. To our knowledge, this is the first methodology that integrates Failure Mode and Effect Analysis (FMEA) into the RFID adoption process. FMEA is used to identify the process failures, which might compromise the integration of the new system with the previous system.
Other benefits inherent to the utilization of this technology were observed: reduction in lead-time, reduction of failures in the process and reduction of defects (since it became possible to identify and trace problems before the product was sent to customers). Such benefits were enabled due to the real time control, the capacity to read many tags at the same time, and the suppression of the manual reading of barcodes.
Furthermore, all the logistic chain to which the company belongs receives benefits, as demonstrated by Fosso Wamba and Chatfield (2009), because with real time inventory control, company suppliers will be able to monitor their inventory and fulfill their clients’ needs more precisely.
Therefore, the fundamental question for this study is “will implementing an
RFID-based system reduce inefficiencies in the production process of the company in
question?”
2. RFID TECHNOLOGY
works on the same basic principle. A signal is sent to a tag, which is activated and reflects back the signal (passive system) or transmits its own signal (active system).
According to Pinheiro (2006), the considerable advances of RFID technology are undeniable, however many challenges remain in order to enable its widespread use. These challenges can be perceived by the analysis of applications for the RFID gadgets. For some applications, the technology is reasonably consolidated, while for others there is still a need of new gadgets, security protocols and reductions in the price of tags.
In this section, a literature review is presented, with a list of advantages and disadvantages of RFID technology. Such factors were taken into consideration when the company decided to implement RFID technology.
Advantages of the use of RFID technology
In a multitude of industrial contexts, implementing RFID technology has shown to improve operations, supply chain and logistical systems by reducing forecasting errors and increasing delivery times (Dutta et al. 2007, Kach and Borzabad 2011). The use of RFID technology seems particularly useful within fast moving consumer goods markets, since it allows for real-time visibility of the supply chain (Bottani et al. 2010). Higher material transparency within organizational systems allows for more accurate forecasting, effectively reducing any inefficiencies that may exist within the supply chain (Delen et al. 2007, Kach and Borzabad 2011).
RFID can also be beneficial in managing supply chains. Relying on an increasingly large number of suppliers can make the information flow across all parties difficult. RFID tags and the technology behind them allow for rapid automated item identification without the need of a physical operator, increasing inventory allocation efficiencies. Through the provision of real-time data, RFID technology helps in systematically reducing information gaps across the supply chain. It prevents items from being lost, since they are tracked continuously as they move through the chain, and enables inventory control, since the company knows exactly what is contained in its inventory, in real time (Attaran 2007; Gaukler et al. 2007, Kach and Borzabad 2011).
Disadvantages of the use of RFID technology
RFID technology does not guarantee improved processes across all functions of the supply chain (Wu et al. 2006). Just like any technology, RFID has downsides and risks (Kharif 2005; Taghaboni-Dutta and Velthouse 2006). To begin with, there are costs and capital requirements for implementing the physical technology and software needed for RFID (Ustundag and Tanyas 2009). Justifying the startup costs may be a prohibitive barrier for implementing RFID technology (Kach and Borzabad 2011). Second, there are cases that suggest how RFID may not be so effective and other cases where the implementation of the system was not successful (Kharif 2005). Additionally, lack of timing and technology coordination between suppliers when implementing RFID practices can create problems across the supply streams (Whang 2010). When to implement RFID technology is an important question facing many practitioners and researchers alike (Kach and Borzabad 2011).
presented and explained below. FMEA was one of the first systematic techniques for failure analysis. It was developed by reliability engineers in the 1950s to study problems that might arise from malfunctions of military systems. An FMEA is often the first step of a system reliability study. It involves reviewing as many components, assemblies, and subsystems as possible to identify failure modes, and their causes and effects (Santos and Cabral, 2008).
3. PROCESS FMEA
Among the many tools used for fault analysis (Ishikawa diagram, Fault Tree Analysis, Pareto Chart, 5 Whys, Quality Control story, among others), FMEA was the most adequate for the company, because the use of this methodology shows the process systematically, aggregates more information in the descriptions of the process and identifies causes of faults in the process of microcomputer assembly (Santos and Cabral, 2008). Failure Mode and Effects Analysis (FMEA) was one of the first systematic techniques for failure analysis. It was developed by reliability engineers in the 1950s to study problems that might arise from malfunctions of military systems. An FMEA is often the first step of a system reliability study. It involves reviewing as many components, assemblies, and subsystems as possible to identify failure modes, and their causes and effects. For each component, the failure modes and their resulting effects on the rest of the system are recorded in a specific FMEA worksheet. There are numerous variations of such worksheets. An FMEA is mainly a qualitative analysis
According to Stamatis (2003), the factors, severity, occurrence and detection are calculated by experts according to the scale of values, which in most cases is set from 1 to 10, based on criteria of evaluation defined in common agreement by the team. The RPN (Risk Priority Number) is a measure of risk of a fault in a certain step of the process, and should be used to classify faults and prioritize the actions. Actions are recommended with priority given to those faults that achieved the highest RPN.
Using this concept, a methodology was developed to integrate RFID technology into the supply chain of the microcomputer assembly company, which will be presented below. This methodology has not been tested before. This was the first attempt to
systematize it. The methodology can be applied to the other companies in the Pólo de
Informática de Ilhéus, since no other company possessed RFID technology at the time the study was done. In the global market, there are still many microcomputer companies that still have not made use of RFID technology. These companies could benefit from its many advantages, as listed in section 5.
4. METHODOLOGY
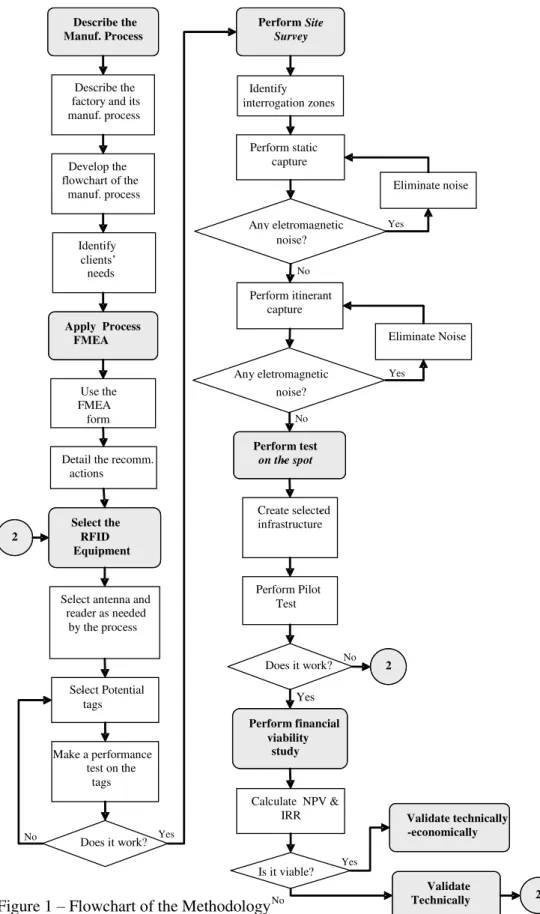
Figure 1 presents the flowchart of the methodology that was developed, detailing each step of the technical viability analysis. It reports the procedures that guided the case study in the company (which will be named XYZ for confidentiality purposes). This company was chosen because it had all the limitations and characteristics of other companies of the region, as mentioned previously.
Internal Rate of Return (IRR) was 15%, ensuring a large NPV (Net Present Value) for the firm (Araújo Filho et al., 2013). For other papers focusing on economic feasibility, check Balocco et al.(2011) and Jones et al. (2007). The problem of the tag price was minimized by choosing an economically feasible tag and by reutilizing the tags as much as possible.
Figure 1 – Flowchart of the Methodology
Describe the
Manuf. Process
Describe the factory and its manuf. process
Develop the flowchart of the
manuf. process
Identify
clients’
needs
Apply Process FMEA
Use the FMEA
form
Detail the recomm. actions
Select the RFID Equipment
Select antenna and reader as needed
by the process
-Select Potential tags
Make a performance test on the
tags
2
Does it work?
Perform Site Survey
Identify interrogation zones
Perform static capture
Perform itinerant capture Any eletromagnetic
noise?
Perform test
-on the spot
Create selected -infrastructure
Perform Pilot Test
Perform financial viability
study
Calculate NPV & IRR
Is it viable?
Validate technically -economically
Validate Technically 2
2
Does it work?
Eliminate noise
Eliminate Noise
No
Yes
No Yes
Yes No No
Yes No
Yes
4.1. Description and evaluation of the process
In this section, a description of the factory of company XYZ will be presented, together with a description of the microcomputer assembly process from the receipt of raw materials to the checkout of finished products.
4.1.1. Description of the Factory
The computer factory was built in 2008 in the Pólo industrial de Informática in Ilhéus/BA, with the objective of producing desktop computers and laptops to fulfill the needs of the north and northeast regions of Brazil.
The company has a flexible assembly line, which manufactures 5 desktop models and 1 laptop model. The monthly production of the factory is approximately 12 thousand machines. The factory has a total area of 1134 m2, with a production area of 895 m2. Around 200,000 machines will be traced and tracked. For details on costs, please refer to Araujo Filho et al. (2013). We assumed that all the equipment would be tagged.
4.1.2. Description of the Process of Receiving Supplies
The process of receiving supplies is initiated with the arrival of the product in the inventory sector. A worker checks the data on the invoice and the data in the request for parts. After the checking of documents, a physical checking of the products is performed, as well as a checking of the packaging and possible damages caused by transportation. When the new process is initiated, the components will receive an RFID tag when they are first inspected.
All the checking data are registered in the stamp of inspection and acceptance. In case there is no problem with the material, either physical or documental, it is taken into the inventory. If there is a problem, a communication to the Board of Directors of the company is performed, which in turn will decide if the goods will be given back to the supplier or if they will be accepted into the inventory.
After the goods are put into the inventory, barcodes are generated and printed for the components. Just after the printing of barcodes, they are attached to the components and read by an optical reader, so that the information enters the Integrated Enterprise Control System (IECS). Finally, the components are stored in the inventory.
4.1.3. Description of the Process of Computer Assembly
The process of computer assembly is initiated with the generation of a sales order (SO) by the ERP system of the sales team located in the southeast of the country. The inventory manager generates the Production Order (PO) in an ERP system different from the one used by the sales team. Therefore, the factory is obliged to feed the system manually because there is no integration between databases. This was changed radically with the new process. Once the RFID began to be used, the factory fed the system automatically by using new software that was integrated with the existing system.
In case a few items are not in the inventory, they are substituted for equivalent or superior items. In this phase, the barcodes for the power supply unit and for the lot of products (serial number) are generated. The RFID tags will help in this phase because it will be possible to know exactly what is in stock.
The cases and power supply units are taken to the Case Preparation sector (which also attaches the power supply unit). Parallel to this activity, the other parts are
checked by the “KIT preparation team”. In this stage, the motherboard, processor,
cooler and memory are attached. The inspection process uses software to determine the condition of the parts.
After the case is prepared with the power source, the stages of assembly are performed:
1st Post: Attach HD, DVD and serial number to the case and attach barcode
(BC) of the power supply unit.
2nd Post: Attach front part of the case.
3rd Post: Connect frontal cables (LEDs, USB, POWER and RESET) on the
motherboard.
4th Post: Attach KIT to the case and connect power source cable to the motherboard, HD and DVD.
5th Post: Tie the power cables with clamps.
6th Post: Attach SATA cable to HD and DVD.
7th Post: Fasten sides of the case.
8th Post: Insert Configuration Label on the side of the case, connect the power cable to outlet and perform a pre-test and setup of the machine (motherboard, processor, memory, DVD, frontal USB). In case the machine is approved, it is made available on the rack for run in. If it is reproved, it is taken to be repaired.
Once the new process is implemented, RFID tags will be attached individually to groups of similar components, as described in section 4.3.3. The tags did perform well with parts made of metal.
After the approval in the assembly line, the machines are made available to run. In this stage, the Operational System (OS) is installed and a fatigue test is performed.
The next step is the final test for the machine. In this test, both hardware and software are tested. In the end of this step the machine is packaged together with a keyboard, loudspeakers, a mouse, manuals, CD of drivers and the label with its serial number is attached to the box. The machine is then put on the pallet.
The pallets are stored in the inventory. When an invoice is generated, the inventory team ties (via barcode [BC] reader) the serial number of the machine to the invoice using the software system provided. As mentioned previously, once the new process begins, RFID tags will be attached to groups of similar components during the initial inspection. The results of the use of RFID tags are discussed in the final section.
4.1.4. Description of the process of Generating an Invoice for a Sales Request
4.2. Applying FMEA to the manufacturing Process of the Company
The FMEA form, used for the analysis of the manufacturing process of the company, was developed by a team of four experts (Microelectronics Lab of the Manufacture and Technology Integrated Center - CIMATEC). The most important results of this work were the possibility of evidencing the potential fault modes, their causes and the alternatives to prevent the occurrence of faults. The FMEA form is an established methodology with proven results (Santos and Cabral, 2008; Stamatis, 2003) . The methodology is applied by filling the FMEA form and analyzing it. In order to fill the FMEA form, the team followed the steps explained in section 3.
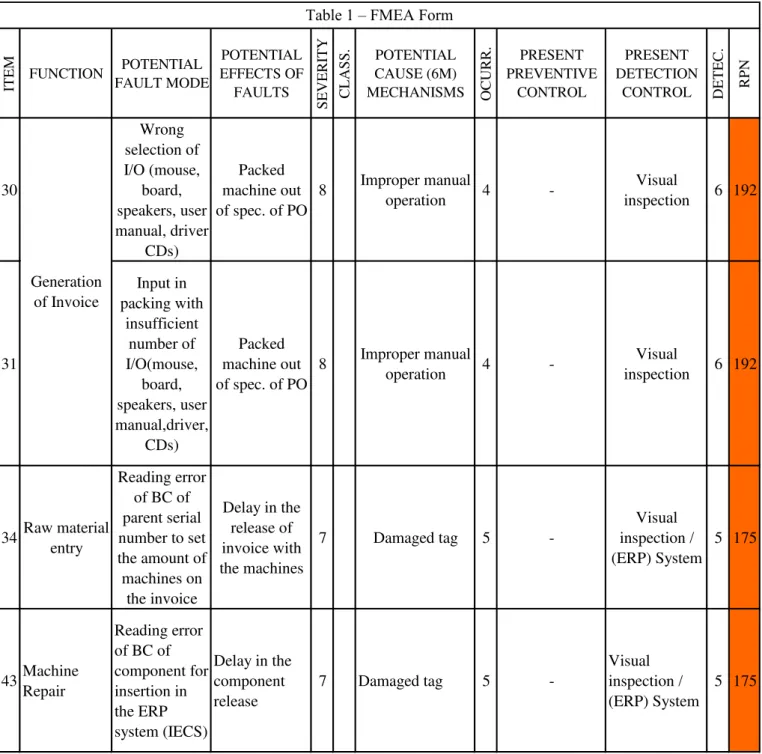
The improvement actions were focused on the types of operations in which the Risk Priority Number (RPN) was above 125. On the FMEA form, 50 types of operations were identified. Seven of these operations (1, 11, 28, 30, 31, 34 and 43) were the ones with the highest RPN, according to Table 1 below:
ITE M FUNCTION POTENTIAL FAULT MODE POTENTIAL EFFECTS OF FAULTS SE V ER ITY C LA SS . POTENTIAL CAUSE (6M) MECHANISMS OCURR. PRESENT PREVENTIVE CONTROL PRESENT DETECTION
CONTROL DET
EC . R PN 1 Production Order Generation Unavailable Component in stock Replacement by component with equivalence higher or lower than SO
5 Raw material control in stock 8
Anual inventory
(Manual / BC) ERP (IECS) 4 160
11 KIT Preparation (motherboard , processor, cooler and RAM Memory) Reading error in barcodes (BCs) of components
Delay in the KIT release to
the assembly line
7 Damaged tag 5
-Visual Inspection Visual / (ERP)
System
5 175
28 Packing
Wrong input of BC tag of the parent serial number
on the package
Inconsistent data in the ERP system
(Finished product)
7 Improper manual
operation 4
-Visual
inspection 5 140
ITE M FUNCTION POTENTIAL FAULT MODE POTENTIAL EFFECTS OF FAULTS SE V ER ITY C LA SS . POTENTIAL CAUSE (6M) MECHANISMS OCURR. PRESENT PREVENTIVE CONTROL PRESENT DETECTION
CONTROL DET
EC . R PN 30 Wrong selection of I/O (mouse, board, speakers, user manual, driver CDs) Packed machine out of spec. of PO
8 Improper manual
operation 4
-Visual
inspection 6 192
31 Input in packing with insufficient number of I/O(mouse, board, speakers, user manual,driver, CDs) Packed machine out of spec. of PO
8 Improper manual
operation 4
-Visual
inspection 6 192
34 Raw material entry
Reading error of BC of parent serial number to set the amount of machines on
the invoice
Delay in the release of invoice with the machines
7 Damaged tag 5
-Visual inspection / (ERP) System 5 175 43 Machine Repair Reading error of BC of component for insertion in the ERP system (IECS)
Delay in the component release
7 Damaged tag 5
-Visual inspection / (ERP) System 5 175 Generation of Invoice
Table 1 – FMEA Form
The recommended actions in the FMEA Process are listed below:
1. Real Time Inventory: There were faults due to unavailability of components
in the inventory, caused by imprecise control of raw materials. It was found that 30% of the Production Orders were generated by substituting components for others with higher or lower value or grade. It was also found that the inventory of parts and finished products was performed once a year, and demanded 3 days to be executed. This happened because some steps of the inventory checking were performed manually and the results were compared with the values found in the ERP system. Therefore, real time inventory is recommended for the company.
machine. Because of that, the recommended action is substituting the barcodes (BCs) for RFID tags, because the RFID tag is more resistant to dirt, impact and mechanical friction than the BC label. It is impossible to guarantee that all the tags were adequately read by the equipment, but the error rate of the RFID readers is extremely small according to specifications (less than 1%).
3. Identification of Parts with RFID Tags: Faults were detected in the selection of I/O products (mouse, keyboard, loudspeakers, and also user manual and CDs of drivers) and in the insertion of these parts in the packaging due to wrong manual operation. Therefore, the recommended action is to identify the I/O products with RFID tags and to group them with a RFID tag with the parent serial number of the packaging of the product, via ERP system. Even though the RFID tag may be expensive in relation to the cost of the items, they can be used many times (recycled), so their cost is reduced. The human cost for the process of attaching the tags to the body of the components was not calculated. For a more detailed analysis of the procedures, check Araujo Filho, Travassos and Figueiredo (2013).
4.3. Measurements and tests
In this section, we will explain the steps of the technical viability analysis. The first subsection presents the selection of the RFID equipment. The second subsection presents the analysis performed in the environment to detect electromagnetic noise (site survey), at the points where the RFID equipment were to be installed.
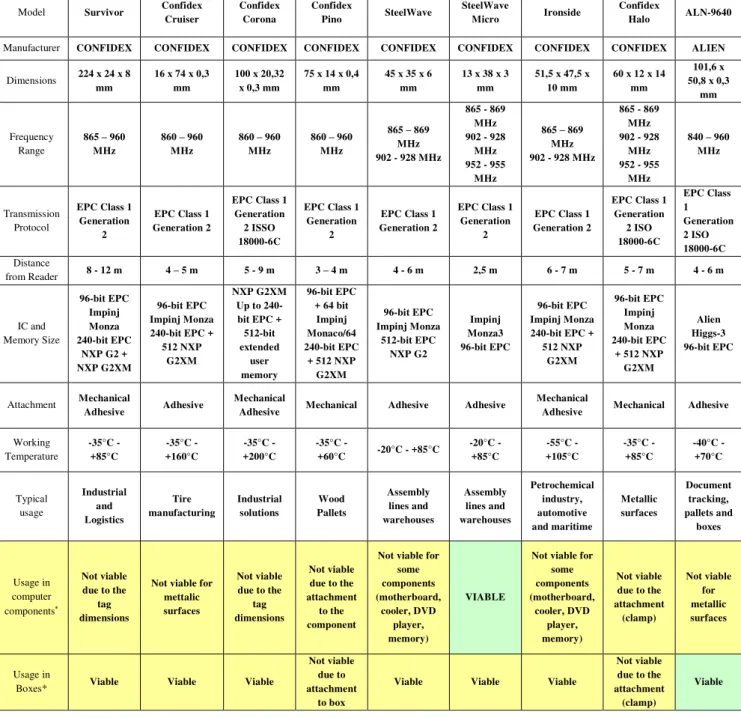
4.3.1. Selection of the Most Adequate RFID Equipment
Table 2: Choice of RFID Tags
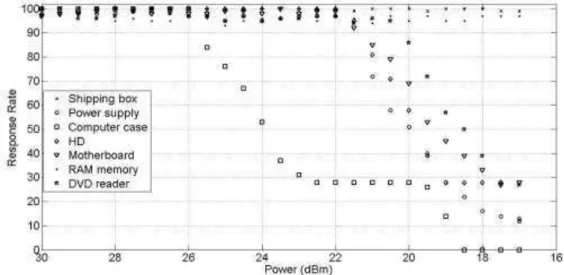
Performance tests were done in a sequence. Deavours et al. (2005) recommend a performance test of an RFID tag in order to evaluate the potential success of the RFID system under study. The test consists in adjusting the power of the reader to the maximum position, and making 100 reading attempts with the tag from a fixed distance. In order to simulate other distances, the power of the reader should be attenuated by 0.5dBm for every 100 reading attempts. The rate of response is the number of successful readings divided by the reading trials.
After the pre-selection of tags, such performance tests were done with the SteelWave Micro tag for the components (motherboard, HD, DVD, RAM memory, power supply unit and case) and with the ALN-9640 tag for the packaging box. All these tests were performed in the microelectronics lab. We must admit that results may vary,
Model Survivor Confidex Cruiser
Confidex Corona
Confidex
Pino SteelWave
SteelWave
Micro Ironside
Confidex
Halo ALN-9640
Manufacturer CONFIDEX CONFIDEX CONFIDEX CONFIDEX CONFIDEX CONFIDEX CONFIDEX CONFIDEX ALIEN
Dimensions 224 x 24 x 8 mm
16 x 74 x 0,3 mm
100 x 20,32 x 0,3 mm
75 x 14 x 0,4 mm
45 x 35 x 6 mm
13 x 38 x 3 mm
51,5 x 47,5 x 10 mm
60 x 12 x 14 mm
101,6 x 50,8 x 0,3
mm
Frequency Range
865 – 960 MHz
860 – 960 MHz
860 – 960 MHz
860 – 960 MHz
865 – 869 MHz 902 - 928 MHz
865 - 869 MHz 902 - 928
MHz 952 - 955
MHz
865 – 869 MHz 902 - 928 MHz
865 - 869 MHz 902 - 928
MHz 952 - 955
MHz
840 – 960 MHz
Transmission Protocol
EPC Class 1 Generation
2
EPC Class 1 Generation 2
EPC Class 1 Generation 2 ISSO 18000-6C
EPC Class 1 Generation
2
EPC Class 1 Generation 2
EPC Class 1 Generation
2
EPC Class 1 Generation 2
EPC Class 1 Generation 2 ISO 18000-6C EPC Class 1 Generation 2 ISO 18000-6C Distance
from Reader 8 - 12 m 4 – 5 m 5 - 9 m 3 – 4 m 4 - 6 m 2,5 m 6 - 7 m 5 - 7 m 4 - 6 m
IC and Memory Size 96-bit EPC Impinj Monza 240-bit EPC
NXP G2 + NXP G2XM
96-bit EPC Impinj Monza 240-bit EPC + 512 NXP
G2XM
NXP G2XM Up to 240-bit EPC + 512-bit extended
user memory
96-bit EPC + 64 bit
Impinj Monaco/64 240-bit EPC
+ 512 NXP G2XM 96-bit EPC Impinj Monza 512-bit EPC NXP G2 Impinj Monza3 96-bit EPC 96-bit EPC Impinj Monza 240-bit EPC + 512 NXP G2XM 96-bit EPC Impinj Monza 240-bit EPC
+ 512 NXP G2XM
Alien Higgs-3 96-bit EPC
Attachment Mechanical
Adhesive Adhesive
Mechanical
Adhesive Mechanical Adhesive Adhesive
Mechanical
Adhesive Mechanical Adhesive
Working Temperature -35°C - +85°C -35°C - +160°C -35°C - +200°C -35°C -
+60°C -20°C - +85°C
-20°C - +85°C -55°C - +105°C -35°C - +85°C -40°C - +70°C Typical usage Industrial and Logistics Tire manufacturing Industrial solutions Wood Pallets Assembly lines and warehouses Assembly lines and warehouses Petrochemical industry, automotive and maritime Metallic surfaces Document tracking, pallets and boxes Usage in computer components Not viable due to the
tag dimensions
Not viable for mettalic surfaces
Not viable due to the
tag dimensions
Not viable due to the attachment
to the component
Not viable for some components (motherboard, cooler, DVD player, memory) VIABLE
Not viable for some components (motherboard, cooler, DVD player, memory) Not viable due to the attachment (clamp) Not viable for metallic surfaces Usage in
Boxes* Viable Viable Viable
Not viable due to attachment
to box
Viable Viable Viable
Not viable due to the attachment
(clamp)
since the manufacturing environment is slightly different from the microelectronics lab (we tried to mimic the conditions as much as possible). We believe that our choice of tag was the best considering the availability in the market. The tag can be affixed to all parts including the RAM memory.
The fixed distance used for the tests was approximately 70cm +/- 2cm. To ensure more reliability from results, 4 experiments were run for each tag, totaling 10,800 reading attempts. Readings were successful with metal parts and with the closed computer case.
Figure 2 presents the tests performed on the machine’s components
(motherboard, HD, DVD reader, RAM memory, power supply unit, case and packaging box).
Figure 2 –Performance test on the machine’s components
4.3.2. Site Survey
According to Sweeney II (2005), in order to perform a site survey it is necessary to follow these steps:
1. Define the reading places (or areas of inquiry) where the RFID system
will be installed. These locations vary from store to store and require a power outlet and Ethernet connectivity for readers (unless you have players with wireless connectivity). Commonly, the RFID interrogation zones are placed on doors, assembly lines and racks of inventory;
2. Carry out site survey in local reading respecting all the business process
cycle (24h or 48h). It is usually held on days of normal operation of the company, respecting all hours of operation.
3. Perform the static capture. To perform the static capture, you must configure the equipment as follows:
a. Place the half-wave antenna (attached directly to the tripod) so that the center of the antenna is in the center of the target area;
c. Connect the laptop to the spectrum analyzer, using an RS-232 connector or Ethernet. If you use a laptop to record data, you must configure the virtual display to record the information every time and save it on your hard disk. Or else, you should shoot/capture the monitor spectrum analyzer every two hours during the normal cycle of operation
d. Set the spectrum analyzer for the operating frequency to be used with the RFID system;
4. Perform Itinerant Capture. To perform the itinerant capture, you must configure the equipment as follows:
a. Set the spectrum analyzer exactly the same way as configured in static capturing, except for the voltage source and the antenna that should be mobile;
b. b. If any source of interference is found, its exact location must be identified.
5. Map the areas of interrogation in the project, locating sources of
interference.
4.3.2.1. Site Survey at XYZ
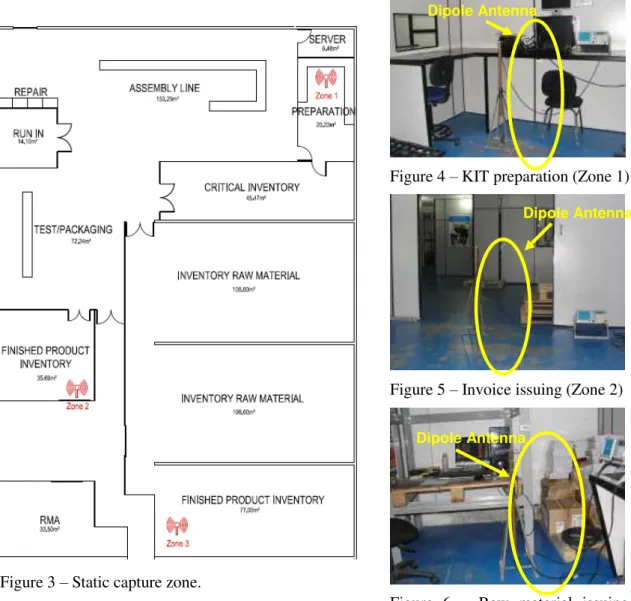
The site survey was performed in the areas of interrogation, according to Figure 3, on the places where the KIT preparation (Figure 4), generation of invoice (Figure 5) and entry of raw materials occur (Figure 6). For the static capture, images from the spectrum analyzer were recorded every 2 hours in each place, with a cycle of 24 hours (beginning at 08:00 until 08:00 of the next day). However, the last record of each place corresponded to the period between 18:00 of the last day until 8:00 of the following day, because the company did not have any activity after regular working hours. This was performed inside the company.
Figure 3 – Static capture zone.
Figure 4 – KIT preparation (Zone 1)
Figure 5 – Invoice issuing (Zone 2)
Figure 6 – Raw material issuing (Zone 3)
4.3.3. Tests in the Product
After the site survey tests, in-place tests were performed. The stages of these tests include:
Input of Components: Through data integration with ERP, the system prompts the user to issue tags for the volumes that comprise a given set / batch of components. Through the information contained in the invoice launched in the ERP system, data will be associated for later traceability. At this point, the components will be credited into the system, releasing them for use if necessary.
Inventory: After proper labeling of RFID tags in the volumes of components, these will be stored as usual.
Handling: With the aid of a RFID Data Collector integrated with the ERP system, the operator will locate the Production Order that lists which components and which amounts must be separated and sent to the production line. At this time, the separate components are read by the RFID Collector and receive the status of Booked, which means that these components can be used at any time.
Dipole Antenna
Dipole Antenna
Production: Through the integration with the ERP system and upon information contained in the Production Order, RFID tags are printed with the necessary information and the Finished Product lot number in question. RFID tags are linked to the Production Order, whose number is also associated with the handling of components, ensuring the association of Finished Goods and Components.
Appointment of Production: All finished products, properly accommodated in a standardized way on a pallet, will go through an RFID portal. At this point, the confirmation of the RFID reading of the finished product will change the status of components used from Debited to Reserved, generating the debt of the component in the inventory system, while a credit of finished product will be held in it.
5. RESULTS
After the in-place test was performed, the FMEA form was used once again to evaluate the efficiency of the RFID system. The RPN results for the items that were changed are shown below (Table 3):
I T EM RECOMMENDED ACTIONS
RESPONSABILITY FOR THE RECOMMENDED
ACTIONS & FOR THE DEADLINES
ACTION TAKEN S E V E R I D . O C O R R . D E T E C . R P N CIMATEC/XYX Company jan/11 CIMATEC jan/11 CIMATEC/XYX Company jan/11 CIMATEC/XYX Company jan/11 CIMATEC/ Empresa jan/11 CIMATEC jan/11 CIMATEC jan/11 1 Perform real-time inventory (RFID tags in the Inventory
Validation tests performed
5 5 2 50
11 Replace CBs tags
for RFID tags
Validation
tests 7 5 1 35
56
30
Identify the I / O devices with RFID tags and group them
Validation tests performed
8 3 2 48
28 Replace CBs tags
for RFID tags
Validation tests performed 8 4 2 Validation tests performed 7 48
34 Replace CBs tags
for RFID tags
Validation
tests 7 5 1 35
31
Identify the I / O devices with RFID tags and group them
5 1 35
Table 3 - FMEA Form
43 Replace CBs tags
for RFID tags
Validation
tests 7
3 2
Table 3 – FMEA Form
Reduction of one worker in the inventory team due to the substitution of manual reading of barcodes for RFID technology. RFID technology was so efficient in relation to the previous technology (barcode) that the time required to read a pallet in the process of generating an invoice was reduced from ninety seconds to seven seconds on average. These time savings are equivalent to the work of one employee (Araujo Filho, Travassos and Figueiredo, 2013).
Reduction in the practice of substituting a component for another of higher grade/cost, due to the real time inventory control. This can be measured because the company knows the amount of parts that were substituted in the past.
There were, however, difficulties and challenges in the implementation of the new technology. The different areas of production were arranged in a way that made difficult the installation of the RFID portal, the training of workers demanded a lot of attention and care, and the integration of the RFID system with the ERP system demanded a lot of time.
6. CONCLUSIONS
In this paper, it was evidenced that the methodology for implementation of RFID technology on microcomputer assembly companies was viable. Araujo Filho, Travassos and Figueiredo (2013) determined an internal rate of return of 15%.
It was also observed that the utilization of the FMEA tool for identification and elimination of causes of failure modes in the production process was efficient (Araujo Filho, Travassos and Figueiredo, 2013). The tool details the process systematically and adds more information to the process descriptions. It also identifies the causes of failures in the production process. The difference between the process before and after the FMEA tool being implemented is that the most important failure modes are taken care of, with preventive measures being taken in order to avoid the failures.
Another important point were the technical evaluations performed for tag selection, choice of RFID equipment, analysis of the environment and for detecting electromagnetic noises present in the factory. Such evaluations helped to ensure the technical efficacy of the chosen technology, during in-site tests. A good RFID reading was obtained at all points where data was collected. The technology was so efficient compared with the previous technology (barcodes) that the time required to read a pallet in the process of generating an invoice was reduced from ninety seconds to seven seconds on average.
It is important to point out that there are other significant gains inherent to the use of RFID technology, which are, however, difficult to measure (Araujo Filho, Travassos and Figueiredo, 2013). Such gains are shared by the entire commodity chain, because with real time inventory control the suppliers of this company will be able to monitor the flow of parts and ensure that their customer (the company) will have its needs fulfilled. This real time monitoring between supplier and company is replicated in the remaining links of the chain, which ensures better service quality to the end consumer, and reduction of logistical and operational costs. In such a condition, the component can be tracked from the first supplier to the end consumer (Fosso Wamba and Chatfield, 2009).
for performance improvements. Additionally, there is a need to conduct more in-depth research into the isolated impact of RFID technology in comparison to the change in management and process redesign that it generates.
One key limitation of this research is the case study approach based on a single case. This paper, however, provides direction for practitioners on how to assess RFID’s potential impact in the microcomputer assembly process, from the receiving of supplies to the delivery of final products. This research contributes to our understanding of
RFID’s potential in intra-organizational supply chain management processes. Hopefully, the experience and lessons learned from this case study can be shared with the readers, and they will be beneficial to those organizations that are contemplating the implementation of RFID systems.
REFERENCES
Araújo Filho, F.W., Travassos, X.L., Figueiredo, P.S. (2013): “Uma Análise De
Viabilidade Econômica De Um Sistema RFID Na Cadeia De Suprimentos De
Fabricação De Microcomputadores: Há Algum Lucro?” Gestão da Produção, Operações e Sistemas (Forthcoming)
Attaran, M. (2007): “RFID: An Enabler of Supply Chain Operations”, Supply Chain Management-an International Journal, (12:4), pp. 249-257.
Balocco, R., Miragliotta, G., Perego, A., and Tumino, A. (2011): “RFID adoption in the FMCG supply chain: an interpretative framework”. Supply Chain Management: an International Journal, 16(5), p.299-315.
Bottani, E., R. Montanari and A. Volpi (2010): “The Impact of RFID and Epc Network
on the Bullwhip Effect in the Italian Fmcg Supply Chain”, International Journal of Production Economics, (124:2), pp. 426-432.
Chow, H.K.H., K.L. Choy, W.B. Lee and K.C. Lau (2006): “Design of a RFID
Case-Based Resource Management System for Warehouse Operations”, Expert Systems with Applications, (30:4), pp. 561-576.
Delen, D., B.C. Hardgrave and R. Sharda (2007): “RFID for Better Supply-Chain Management through Enhanced Information Visibility”, Production and Operations Management, (16:5), pp. 613-624.
Dutta, A., H.L. Lee and S.J. Whang (2007): “RFID and Operations Management:
Technology, Value, and Incentives”, Production and Operations Management, (16:5), pp. 646-655.
Deavours, D.D.; Ramakrishnan, K. M.; Syed, A. (2005): “RFID Performance Tag
Analysis”. Technical Report ITTC-FY2006-TR-40980-01, Available at:
< http://ittc.ku.edu/publications/documents/deavours2006_ITTC-FY2006-TR-40980-01.pdf>
Gaukler, G.M., R.W. Seifert and W.H. Hausman (2007): “Item-Level RFID in the Retail
Supply Chain”, Production and Operations Management, (16:1), pp. 65-76.
Gaukler, G.M., O. Ozer, W. Hausman (2004). RFID and product progress information: Improved Dynamic ordering policies. Working paper, Stanford University, Stanford, CA.
Heinrich, C. (2005): RFID and Beyond. Wiley Publishing, Indianapolis.
Hunt, V.D., Puglia, A. and Puglia, M. (2007): “RFID: A Guide to Radio Frequency Identification”. John Wiley & Sons, Hoboken, N.J.
Jones, E.C., Riley,M.W., Franca, R., Reigle, S. (2007): “Case Study: The Engineering
Economics of RFID in Specialized Manufacturing. The Engineering Economist. 52: 285-303.
Kach, A. and Borzabad, A.F. (2011): “Use of RFID Technology to Overcome
Inefficiencies in the Supply Chain: An Analysis of Renault's Operations in Iran”.
International Journal of Management, 28: 365-378.
Kharif, O. (2005): “For Many Retailers, RFID Lacks Roi,” Business Week.
Pinheiro, J. M. S. (2006): “Identificação por Radiofreqüência: Aplicações e
Vulnerabilidades da Tecnologia RFID”.Caderno UniFOA, Volta Redonda, ano 1, n. 2.
Available at: <http://www.unifoa.edu.br/cadernos/edicao/02/18.pdf>.
Rausand M., Hoylan A. (2004): “System Reliability Theory, Models, Statistical Methods, and Applications”. Wiley Series in probability and statistics - second edition page 88.
Santos, F.R.S., Cabral, S. (2008): “FMEA and PMBOK Applied To Project Risk
Management”, Journal of Information Systems and Technology Management, vol.5, No.2, pp. 347-364.
Soares, R. S. (2008): “O impacto da tecnologia de etiqueta inteligente (RFID) na performance de cadeias de suprimentos – Um estudo no Brasil”. Revista Jovens
Pesquisadores, Ano V, No.9, Available at:
<http://www.mackenzie.br/dhtm/seer/index.php/jovenspesquisadores/article/viewFile/8 20/344>.
Stamatis, D.H. (2003) Failure Mode and Effect Analysis: FMEA from Theory to Execution. 2nd Ed. ASQ Quality Press, Milwaukee, 2003.
Stambaugh, C.T. and F.W. Carpenter (2009): “Wireless innovation in inventory
monitoring and accounting”. Strategic Finance Vol. 91(6), pp. 35-40.
Sweeney II, P. J. (2005): RFID for Dummies. Ed. Wiley Publishing Inc., Indianapolis, Indiana, 409 p.
Taghaboni-Dutta, F. and B. Velthouse (2006): “RFID Technology is Revolutionary:
Who Should Be Involved in This Game of Tag?”, Academy of Management Perspectives, (20:4), pp. 65-78.
Ustundag, A. and M. Tanyas (2009): “The Impacts of Radio Frequency Identification
(RFID) Technology on Supply Chain Costs”, Transportation Research Part E-Logistics
and Transportation Review, (45:1), pp. 29-38.
Whang, S. (2010): Timing of RFID Adoption in a Supply Chain. Management Science,
Wu, N.C., M.A. Nystrom, T.R. Lin and H.C. Yu (2006). “Challenges to Global RFID