Printed in Brazil - ©2007 Sociedade Brasileira de Química 0103 - 5053 $6.00+0.00
A
r
ti
c
le
*e-mail: [email protected]
Flow Injection Turbidimetric Determination of Acetylcysteine in Pharmaceutical
Formulations Using Silver Nitrate as Precipitant Reagent
Willian T. Suarez, Heberth J. Vieira and Orlando Fatibello-Filho*
Departamento de Química, Universidade Federal de São Carlos,CP 676, 13560-970São Carlos-SP, Brazil
Um procedimento de análise por injeção em fluxo turbidimétrico simples, exato e preciso é descrito para determinação de acetilcisteína em formulações farmacêuticas. O procedimento é baseado na precipitação da acetilcisteína com solução de nitrato de prata em meio ácido e o sal insolúvel produzido foi monitorado em 410 nm. A curva analítica para a acetilcisteína foi linear no intervalo de concentração de 1,0 × 10⁻⁴ a 1,0 × 10⁻³ mol L-1 com um limite de detecção de 5,0 × 10⁻⁵ mol L-1. A freqüência de amostragem foi de 60 h-1 e os desvios padrões relativos (RSD)
foram menores do que 2,0 % para soluções de acetilcisteína de 1,0 × 10⁻⁴ e 5,0
× 10-4 mol L-1
(n=10). A recuperação deste analito em quatro amostras variou de 97,6 a 103%. O test-t pareado mostrou que os resultados obtidos para acetilcisteína em produtos farmacêuticos usando o procedimento em fluxo proposto e o método oficial, foram concordantes em um nível de confiança de 95%.
A simple, accurate and precise flow-injection turbidimetric procedure is reported for the determination of acetylcysteine in pharmaceutical formulations. The procedure is based on the precipitation of acetylcysteine with silver nitrate solution in acid medium and the insoluble salt produced was monitored at 410 nm. The analytical curve for acetylcysteine was linear in the concentration range from 1.0 × 10⁻⁴ to 1.0
× 10-3 mol L-1 with a detection limit of 5.0
× 10-5 mol
L-1. The sampling rate was 60 h-1 and the relative standard deviations (RSDs) were less than
2.0% for 1.0 × 10⁻⁴ and 5.0 × 10⁻⁴ mol L-1 acetylcysteine solutions (n=10). The recovery of this
analyte in four samples ranged from 97.6 to 103 %. A paired t-test showed that all results obtained for acetylcysteine in pharmaceutical products using the proposed flow-injection procedure and the official procedure agreed at the 95% confidence level.
Keywords: flow injection, turbidimetry, acetylcysteine, pharmaceuticals, silver nitrate
Introduction
Acetylcysteine (NAC) is used as a mucolytic agent in chronic respiratory illnesses as well an antidote in paracetamol overdoses in the first twelve hours after the ingestion of drug.1 More recently, animal and human studies of NAC have shown it to be a powerful antioxidant and a potential therapeutic agent in the treatment of cancer, heart disease, HIV infection, heavy metal toxicity, and other diseases characterized by free radical and oxidant damage.2
Among methods used for the determination of acetylcysteine in pharmaceuticals, spectrophotometric procedures3-5 are the most often used. These procedures are based on antioxidant characteristic of NAC and uses an oxidant as reagent as iron,6-8 bromine,9 cerium(IV)10 or
reaction of derivatisation with ortho-phthalaldehyde and isoleucine.11,12 HPLC,13 potentiometry14 and voltammetry methods15,16 have also been used for the determination of NAC. Chemiluminescence procedure has showed high sensitive in NAC determination.17 Some procedures have been described with production of a derivative which can be measured fluorimetrically.18,19 The Brazilian Pharmaco-poeia20 describes a titrimetric procedure for NAC in pharmaceutical formulations, but this procedure is very slow and laborious, and thus less applicable to large-scale analysis. A titrimetric procedure was proposed by Viñas
et al.21 based on the inhibitory effect of NAC on the silver catalyzed phloxin-persulphate reaction.
pharma-et al.
ceutical quality control laboratories due to their simplicity, high sampling rate and the value in reducing reagent consumption when compared with batch procedures.22,23 Bergamin-Filho et al.24 were the first to employ the injector-commutator and merging zones in which both sample and reagent are introduced into inert carrier streams with synchronized merging. In this configuration, high sampling rate and good accuracy was achieved with low sample and reagent consumption.
In the present work, a simple, accurate and precise flow-injection turbidimetric procedure is reported for the determination of the acetylcysteine in phar-maceutical formulations. The proposed flow injection turbidimetric procedure with symmetric merging zones is based on the reaction between acetylcysteine and Ag(I) to form a precipitate in suspension that is determined turbidimetrically at 410 nm.
Experimental
Reagents and solutions
All reagents were of analytical grade and all solutions were prepared with deionized water from a Millipore (Bedford, MA, USA) Milli-Q system model UV plus ultra-low organics water.
A 5.0 × 10⁻³ mol L-1 acetylcysteine stock solution was prepared by dissolving 0.0408g of acetylcysteine (Sigma) in 5.0 × 10⁻² mol L-1 HNO3 solution and the volume was made up to 50 mL in a calibrated flask using the same solution. Reference solutions containing from 1.0 × 10⁻⁴ to 1.0 × 10⁻³ mol L-1 of acetylcysteine were prepared by dilution of appropriate volumes of stock solution with 5.0 × 10⁻² mol L-1 HNO3 solution in a calibrated flask.
A 2.0 × 10⁻² mol L-1 silver nitrate stock solution was prepared by dissolving 0.3396 g of this reagent (Aldrich) in 5.0 × 10⁻² mol L-1 HNO3 solution and the volume was made up to 100 mL in a calibrated flask using the same acid solution.
Sample preparation
The determination of acetylcysteine of Brazilian commercial sachets using the proposed flow injection procedure was performed. Ten sachets of each formulation were weighted, powdered and a known accurate amount in the range from 16.32 to 163.2 mg was dissolved with 5.0 × 10⁻² mol L-1 HNO3 solution, transferred to a 50 mL calibrated flask and the volume was made up to this volume with the same acid solution. Additional dilutions when necessary were made using HNO3 solution in 50
mL calibrated flasks. These sample solutions were inserted directly into the flow injection system with the aid of an injector-commutator. The content of acetylcysteine in these samples was determined by interpolation in the calibration curve obtained with several reference solutions in the concentration range from 1.0 × 10⁻⁴ to 1.0 × 10⁻³ mol L-1.
Apparatus
A Femto (São Paulo, Brazil) model 432 spectro-photometer equipped with a glass flow-cell (optical path of 1.0 cm) was used for the turbidity measure at 410 nm and peak heights were recorded on a Cole Parmer (Chicago, IL, USA) model 1202-0000 two-channel strip-charter recorder. A model 7628-50 twelve-channel Ismatec (Zurich, Switzerland) peristaltic pump supplied with Tygon® pump tubing was used for the propulsion of the solutions. Polyethylene tubing (0.8 mm i.d.) was used to assemble the manifold. Sample and reagent solutions were inserted in the flow system with the aid of a laboratory-built three-piece manual injector-commutator made of Perspex®, containing two fixed bars and a sliding central bar.25
Comparative method
As a comparative method it was used the potentiometric procedure described in the Brazilian Pharmacopoeia.19 In this procedure, the sample solution was potentiometrically titrated with a 0.10 mol L-1 mercury nitrate (II) solution, using a gold electrode wire as indicator and saturated calomel reference electrode (SCE) at 25 °C.
Flow diagram
The flow-injection system with symmetric merging zones procedure proposed in this article is based on the precipitation of acetylcysteine with silver nitrate solution in acid medium (pH 1.3) and the insoluble salt produced (equation 1) was monitored at 410 nm.
Ag+(aq)+ RSH HO
2
RSAg
(aq)+ H O3
+
(aq) (aq) (1)
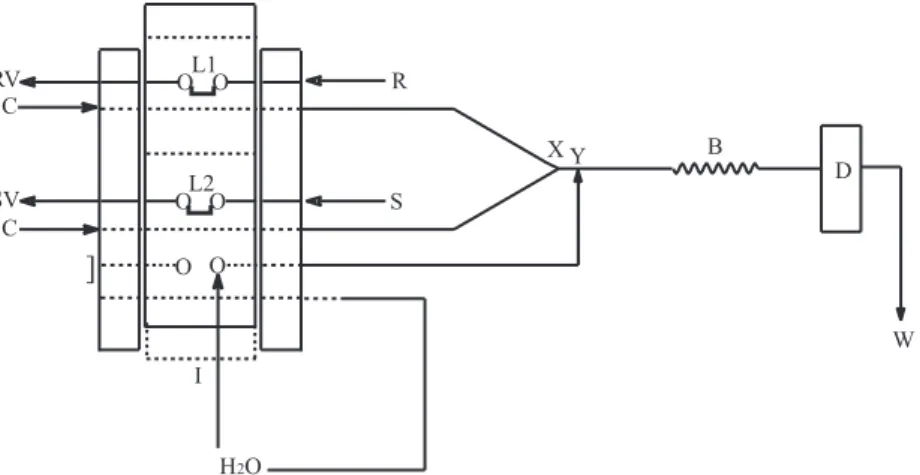
injector-commutator to injection position, the selected volumes of reagent and sample (or reference solution) were injected simultaneously as individual zones into the 5.0 × 10⁻² mol L-1 HNO3 carrier streams (C; 1.7 mL min-1) merging at point X. The precipitate formed in the reactor coil B (100 cm × 0.8 mm i.d.) was transported to the flow-cell (D) and was monitored at 410 nm. When the manual injector was in the sampling position, an intermittent flow of deionized water at a flow rate of 6.3 mL min-1 has been pumped into the system by the confluence point Y to wash the polyethylene tubing and the flow cell.
Results and Discussion
Reaction conditions and flow-injection parameters
The merging zones configuration was chosen because very small volumes of reagent (silver nitrate) is consumed in each injection and provides good repeatability and high baseline stability.26
In turbidimetry, the transmittance of light through a suspension of precipitate is measured. Thus, initially an UV-Visible absorption spectrum of the precipitate, R-S-Ag(s) formed in the reaction of acetylcysteine and Ag(I) in acid medium was obtained off-line (not shown). The maximum analytical signal (turbidity) was attained in the wavelength range from 400 to 430 nm. Therefore, a wavelength of 410 nm was selected for this work.
Several parameters had to be optimized in order to achieve the optimal conditions to promote the reaction between acetylcysteine and Ag(I) in acid medium. Chemical and flow-injection parameters were optimized by univariate method in order to achieve a compromise between the peak height, sample throughput,
reprodu-cibility and stability of baseline. These studies were carried out using a standard solution containing 5.0 × 10⁻⁴ mol L-1 (81.6 mg L-1) of acetylcysteine.
The effect of the HNO3 concentration used as carrier was investigated in the concentration range from 1.0 × 10⁻² to 0.4 mol L-1. The analytical signal increased with the HNO3 concentration up to 5.0 × 10⁻² mol L-1 above which it remained constant. A 5.0 × 10⁻² mol L-1 HNO3 solution was selected in all further experiments.
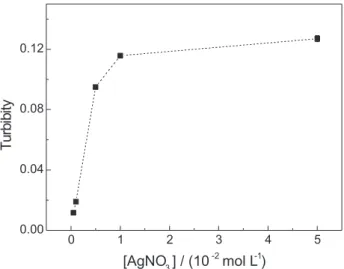
The influence of the silver nitrate concentration on the analytical signal in the concentration range from 5.0 × 10⁻⁴ to 5.0 × 10⁻² mol L-1 for 5.0 × 10⁻⁴ mol L-1 acetylcysteine reference solution was shown in Figure 2. It was observed that the peaks height increased with the silver nitrate concentration up to 1.0 × 10⁻² mol mL-1, maintained practically constant up to 5.0 × 10⁻² mol L-1 concentration. Therefore, a 2.0 × 10⁻² mol mL-1 silver nitrate solution was chosen for further experiments to avoid rapid dilution of this reagent after each measurement cycle.
The effect of the sample and reagent volumes injected was studied by varying the volumes of L1 and L2 loops between 100-500 µL. The turbidity increased with greater volumes up to 250 µL for sample and up to 250 µL for reagent, above which the turbidity remained practically constant. Sample and reagent volumes of 250 µL and 250 µL were chosen as a good compromise between analytical signal and sampling rate.
The flow rate was optimized in the range from 0.5 to 6.3 mL min-1, in each channel. It was found that the best analytical signal was reached using a carrier flow of 1.7 mL min-1. When a higher flow rate of carrier stream was employed, the turbidity signal decreased probably due to a shorter residence time. Thus, a 1.7 mL min-1 flow
Figure 1. Flow-injection manifold for determination of acetylcysteine. The peristaltic pump is not shown, and the broken lines in the bars of the manual
injector (I) show the sample position. C: solution carrier of HNO3 (5.0 × 10⁻² mol mL-1; 1.7 mL min-1); S: sample or reference solution; SV: sample vessel;
R: reagent solution (2.0 × 10⁻² mol mL-1 AgNO
3); RV: reagent vessel; L1: reagent loop (250 µL); L2: sample loop (250 µL); X: confluence point; Y: entrance
of deionized water flowing intermittently at 6.3 mL min-1; B: reactor coil (100 cm); D: detector at 410 nm and W: waste. The length between the
injector-commutator and confluence X was 5 cm.
O O
O O
O O
D
W
X Y B
R C
C
L1
L2
H2O
]
I
S RV
et al.
rate in each channel was established to further experiments.
The effect of the reactor coil length (B) was investigated in the range from 25 to 150 cm at constant flow rate. In this study, acetylcysteine reference solution in the concentration 5.0 × 10⁻⁴ mol L-1 was used. The peak heights increased with the increases of the reaction coil up to 100 cm, above which a slight decrease was observed probably due to the dispersion of the sample zone. A 100 cm reaction coil was chosen in all further experiments
Effect of colloid protectors
Colloid protectors have been used in previous flow injection turbidimetric procedures27 as stabilizers of suspensions and to avoid adherence of the precipitate in the inner walls of the tubes and/or coils. The effect of colloid protectors poly(ethyleneglycol), poly (vinylalcohol), Triton (X-100) and agar-agar on the sensitivity and washing-time was studied in three different concentrations (0.010, 0.025 and 0.050%, m/v) of each compound added to all solutions (HNO3 carrier,sample and reagent). A slight increase (ca. 3%) of analytical signal was obtained with poly(vinylalcohol) solution. On the other hand, the analytical signal do not changed with the use of other colloid protectors. As the increase of the analytical signal was very small by using poly (vinylalcohol) solution, to avoid adherence of precipitate in the inner walls of the tubes, coil and/or cell, an intermittent flow of deionized water at a flow rate of 6.3 mL min-1 has been pumped into the system by the confluence point Y to wash the polyethylene tubing and the flow cell (see Figure 1). Before the insertion of sample solution and the analytical signal have been recorded, the
injector is commuted to sampling position. Then, a flow of washing solution merge in the confluence point Y providing a flow-rate much higher than the carrier stream whereby the baseline is attained much more quickly, avoiding the impregnation of colloidal particles in the flow cell.
Selectivity and recovery studies
The selectivity of proposed flow injection procedure was evaluated studying the potential interference of excipients, which are commonly used in pharmaceutical preparations such as saccharine, sucrose, sodium dihydrogenphosphate, EDTA, NaHSO3, benzalkonium chloride and sodium benzoate. In this study, three solutions of known concentrations (1.0 × 10⁻⁵, 1.0 × 10⁻⁴ and 1.0 × 10⁻³ mol L-1) of these substances containing 1.0 × 10⁻⁴ mol mL-1 acetylcysteine reference solution were injected in the flow system and the analytical signal obtained was compared with the solution containing only acetylcysteine at same concentration. No interferences were observed by saccharine, sucrose, phosphate and EDTA at same concentration of acetylcysteine but some interference (ca.
8-12 %) was observed in higher concentrations. Saccharin and benzoate react with Ag(I) to produce silver insoluble salts. However, in the studied conditions of the proposed method (pH = 1.3) significant fractions of saccharinate (pKa = 1.6) and benzoate (pKa = 4.2) are present in the corresponding protonated form, thus as expect those excipient do not cause any interference. A strongly interference was observed by benzalkonium chloride in all concentrations tested, since the chloride ion react strongly with Ag(I). Nasal liquid products can not be analyzed with the proposed method, due to the high concentration (ca. 0.28 mg mL-1) of benzalkonium chloride.
The recovery results obtained varied between 97.6 to 103%, show no significant matrix effect of the sample. The analyses of commercial samples were performed using a calibration curve.
Calibration graph and applications
The proposed flow injection system under the optimized conditions was applied to determine acetyl-cysteine in commercial formulations. The results of the analysis of acetylcysteine in commercial formulations are presented in Table 1. As it can be seen, good agreement between the result obtained in the determination of acetylcysteine by the proposed flow injection procedure and the titrimetric method described in the Brazilian
Figure 2. Effect of silver nitrate concentration on acetylcysteine
deter-mination.
0 1 2 3 4 5
0.00 0.04 0.08 0.12
T
u
rb
ib
ity
Pharmacopoeia20 were found (t-test). In addition, it also agreed with those declared on the labels confirming the accuracy of the flow injection turbidimetric method. The calibration curve for acetylcysteine was linear in the concentration range from 1.0 × 10⁻⁴ to 1.0 × 10⁻³ mol L-1 (T = –0.025 + 480.10 × [NAC]; r=0.9993, where T is the Turbidity (T = –log Transmittance) and [NAC] is acetylcysteine concentration in mol L-1.
The detection limit of 5 × 10⁻⁵ mol L-1 (three times blank standard deviation/slope of analytical curve) and sampling rate of 60 determinations per hour were obtained. As can be seen in the Table 2, analytical features compare favorably with those flow injection procedures described in the literature. Linear range was also comparable to the described flow procedures in the Table 2. The spectro-photometric flow procedure described by Sanchez-Pedreño et al.5 have large linear range when compared with proposed procedure, but that employs an expensive reagent, palladium dichloride as standard solution.
Conclusions
The proposed flow-injection merging zones procedure developed in this work allows the determination of acetylcysteine in two pharmaceuticals products with consumption of 0.84 mg of silver nitrate as precipitant reagent by determination. The intermittent flow of deionized water allowed the on line cleaning of the system. The proposed method is accurate, precise and cheap when compared with enzymatic procedures,3,4 spectro-photometric procedures6,8,11 and other flow spectro-photometric procedures with comparable analytical
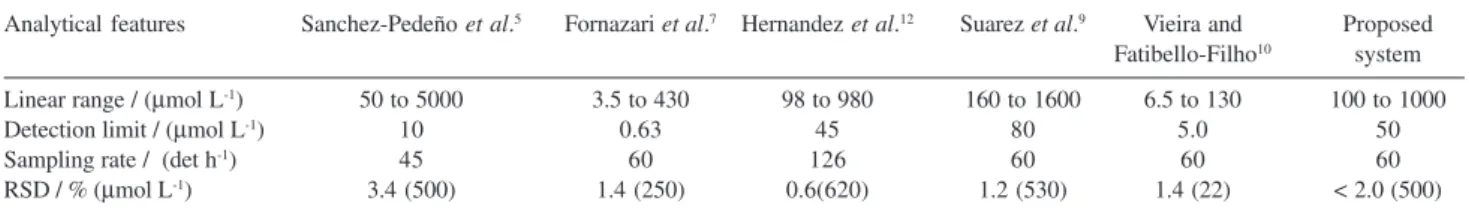
Table 2. Analytical features of flow procedures for acetylcysteine determination
Analytical features Sanchez-Pedeño et al.5 Fornazari et al.7 Hernandez et al.12 Suarez et al.9 Vieira and Proposed
Fatibello-Filho10 system
Linear range / (µmol L-1) 50 to 5000 3.5 to 430 98 to 980 160 to 1600 6.5 to 130 100 to 1000
Detection limit / (µmol L-1) 10 0.63 45 80 5.0 50
Sampling rate / (det h-1) 45 60 126 60 60 60
RSD / % (µmol L-1) 3.4 (500) 1.4 (250) 0.6(620) 1.2 (530) 1.4 (22) < 2.0 (500)
Table 1. Determination of acetylcysteine in commercial formulations by using flow-injection turbidimetric and Official Method20
Samples Acetylcysteine / (mg g-1) Relative error / %
Labelled Official Method Flow Procedure Er1 Er2
A 40 39 ± 1 39.2 ± 0.3 –2.0 00.5
B 40 39 ± 1 38.2 ± 0.1 –4.5 –2.0
C 20 19.7 ± 0.2 19.7 ± 0.2 –1.5 00.0
D 20 20.1 ± 0.1 20.2 ± 0.2 00.5 00.5
n=3, mean ± standard deviation, 95% confidence level. Er1 = relative error flow procedure vs. labelled value and Er2 = relative error flow procedure versus official method. The analyzed samples contained some inactive ingredients: food yellow 3, sucrose, orange flavoring, sodium bicarbonate, anhydrous citric acid, aspartame, flavoring, sodium saccharin, fructose, orange essence, talc and colloidal silicon dioxide.
frequency,7,9,10 as can be seen in the Table 2. The proposed flow procedure have smaller limit of detection when compared with spectrophotometric procedure.9
Acknowledgments
The scholarship granted to W.T.S and H.J.V. from CNPq and CAPES respectively, are gratefully acknowledged.
References
1. Degroote, J.; Vansteenbergen, W.; Acta Gastro-ent. Belg.1995,
58, 326.
2. Holdiness, M. R.; Clin. Pharmacokinet.1991, 20, 123. 3. Garcia-Molina, F.; Penalver, M. J.; Rodriguez-Lopez, J. N.;
Garcia-Canovas, F.; Tudela, J.; J. Agric. Food Chem. 2005, 53, 6183.
4. Ogwu, V.; Cohen, G.; Free Radical Biol. Med.1998, 25, 362. 5. Sanchez-Pedreño, C.; Albero, M. I.; Garcia, M. S.; Rodenas,
V.; Analyst1992, 117, 925.
6. Abu Eid, M.; Mikrochim. Acta1998, 129, 91.
7. Fornazari, A.; Suarez, W. T.; Vieira, H. J.; Fatibello-Filho, O.;
Acta. Chim. Slov. 2005, 52, 164.
8. Raggi, M. A.; Cavrini, V.; Dipietra, A. M.; J. Pharm. Sci.1982, 71, 1384.
9. Suarez, W. T.; Vieira, H. J.; Fatibello-Filho, O.; J. Pharm.
Biomed. Anal.2005, 37, 771.
10. Vieira, H. J.; Fatibello-Filho, O.; Quim. Nova2005, 28, 797. 11. Alvarez-Coque, M. C. G.; Hernandez, M. J. M.; Camanas, R.
M. V.; Fernandez, C. M.; Analyst1989, 114, 975.
et al.
13. USP, United States Pharmacopeial XXII; U.S Pharmacopeial Convention: Rockville, MD, 1990.
14. Kolar, M.; Dobcnik, D.; Pharmazie2003, 58, 25.
15. do Carmo, D. R.; da Silva, R. M.; Stradiotto, N. R.; J. Braz.
Chem. Soc.2003, 14, 616.
16. Suarez, W. T.; Marcolino, L. H.; Fatibello-Filho, O.; Microchem.
J.2006, 82, 163.
17. Du, H. X.; Li, Y. H.; Lu, J. R.; Anal. Chim. Acta2001, 448, 79. 18. Vannecke, C.; Van Gyseghem, E.; Bloomfield, M. S.; Coomber, T.; Vander Heyden, Y.; Massart, D. L.; Anal. Chim. Acta2001,
446, 413.
19. Al-Ghannam, S. M.; El-Brashy, A. M.; Al-Farhan, B. S.;
Farmaco2002, 57, 625.
20.Farmacopéia Brasileira; Organização Andrei Editora: São Paulo, 1977.
21. Vinãs, P.; Córdoba, M. H.; Sánchez-Pedreño, C.; Analyst1990,
115, 757.
22. Martínez-Calatayud, J.; Flow Injection Analysis of Pharmaceuticals - Automation in Laboratory, 1st ed.; Taylor &
Francis Inc., 1996.
23. Rocha, F. R. P.; Nóbrega, J. A.; Fatibello-Filho, O.; Green Chem. 2001, 3, 216.
24. Bergamin-Filho, H.; Zagatto, E. A. G.; Krug, F. J.; Reis, B. F.;
Anal. Chim. Acta1978, 101, 17.
25. Reis, B. F.; Bergamin-Filho, H.; Quim. Nova1993, 16, 570. 26. Reis, B. F.; Giné, M. F.; Kronka, E. A. M.; Quim. Nova1989,
12, 82.
27. Ruzicka, J.; Hansen, E. H.; Flow Injection Analysis, John Wiley & Sons: New York, 1988.
Received: November 1, 2006
Web Release Date: August 20, 2007