Article
0103 - 5053 $6.00+0.00*e-mail: [email protected]
Stripping Voltammetric Methods for Determination of the Antiparasitic Drug
Nitazoxanide in Bulk Form, Pharmaceutical Formulation and Human Serum
Hanaa S. El-Desoky,* Mohamed M. Ghoneim and Mohamed M. Abdel-Galeil
Analytical and Electrochemistry Research Unit, Chemistry Department, Faculty of Science, Tanta University, 31527 Tanta, Egypt
Voltamogramas cíclicos de nitazoxanida medidos no eletrodo de gota de mercúrio no tampão universal Britton-Robinson com valores de pH de 2 a 11 contendo 20% (v/v) de etanol exibiram um único pico catódico irreversível de 4-elétrons, correspondendo à redução de seu grupo NO2 para
hidroxilamina. Observou-se que a nitazoxanida adsorve na superfície do eletrodo de mercúrio numa monocamada com cobertura supericial de 3,16 × 10⁻¹⁰ mol cm-2 na qual cada molécula adsorvida
ocupa uma área de 0.525 nm2. Baseado no seu comportamento de adsorção na superfície do
eletrodo de mercúrio, métodos voltamétricos validados ‘stripping’ catódico adsortivo com varredura linear (VL), pulso diferencial (PD) e onda quadrada (OQ) foram descritos para determinação de nitazoxanida no seio da solução. Limites de deteção de 1,5×10⁻¹⁰, 2,4×10⁻¹⁰ e 3,0×10⁻¹¹ mol L-1 e
limites de quantiicação de nitazoxanida de 5,0×10⁻¹⁰, 8,0×10⁻¹⁰ e 1,0×10⁻¹⁰ mol L-1 no seio da solução
foram obtidos a partir dos métodos VVL, VPD e VOQ descritos acima, respectivamente. Os métodos descritos foram aplicados com sucesso para a determinação de nitazoxanida em sua formulação farmacêutica (pó de Cryptonaz) e em serum humano sem a necessidade de pré-tratramento da amostra, etapas de extração ou a formação de cromógenos coloridos antes da análise. Além disto, determinou-se nitazoxanida com sucesso e sem interferência de produtos de degradação induzidos por ácido ou base, indicando a estabilidade e poder dos métodos voltamétricos descritos.
Cyclic voltammograms of nitazoxanide recorded at the hanging mercury drop electrode in the Britton-Robinson universal buffer of pH values 2 to 11 containing 20% (v/v) ethanol exhibited a single 4-electron irreversible cathodic peak corresponding to the reduction of its NO2 groupto the hydroxylamine stage. Nitazoxanide was found to adsorb onto surface of the mercury electrode in a monolayer surface coverage of 3.16×10⁻¹⁰ mol cm-2 in which each adsorbed molecule occupies an
area of 0.525 nm2. Based on its adsorption behavior onto the mercury electrode surface, validated
linear sweep (LS), differential pulse (DP) and square wave (SW) adsorptive cathodic stripping voltammetric methods were described for determination of bulk nitazoxanide. Limits of detection of 1.5×10⁻¹⁰, 2.4×10⁻¹⁰ and 3.0×10⁻¹¹ mol L-1 and limits of quantiication of 5.0×10⁻¹⁰, 8.0×10⁻¹⁰ and
1.0×10⁻¹⁰ mol L-1 nitazoxanide in the bulk form were achieved by means of the described LS, DP and
SW adsorptive cathodic stripping voltammetric methods, respectively. The described methods were successfully applied for determination of nitazoxanide in its pharmaceutical formulation (Cryptonaz powder) and in spiked human serum without the necessity for sample pretreatment, time consuming extraction steps or formation of colored chromogens prior to the analysis. Besides, nitazoxanide was successfully determined without interference from its acid or base-induced degradation products indicating the stability-indicating power of the described voltammetric methods.
Keywords: nitazoxanide, cryptonaz powder, human serum, degradation, determination, stripping voltammetry
Introduction
Nitazoxanide [2-(5-nitro-1,3-thiazol-2-ylcarbamoyl) phenyl acetate] (Scheme A) has a broad-spectrum
activity against numerous intestinal protozoa, helminths and anaerobic bacteria. Nitazoxanide is prescribed for
treatment of diseases caused by Giardia intestinalis and
Cryptosporidium in immune-compromised patients, including those with AIDS or HIV infection. The drug represents a significant advance in the treatment of
No oficial method for determination of nitazoxanide in pharmaceutical formulation and/or biological luids is available yet in British or US pharmacopoeia.
Chromatographic4-10 and spectrophotometric11-13 analytical
methods have been reported for determination of nitazoxanide in the bulk form as well as in pharmaceutical
formulations. The reported chromatographic methods4-10
necessitate sample pretreatment and time-consuming extraction steps prior to analysis of the drug. Moreover, these methods require expensive equipment and considerable skills are necessary to operate them successfully. On the
other hand, the reported spectrophotometric methods11-13
require time-consuming reduction and oxidation steps for formation of colored chromogens prior to the analysis. A simple and sensitive procedure is desired for determination of nitazoxanide and testing content uniformity of its dosage form. Stripping voltammetry is an extremely sensitive electrochemical technique that utilizes a non-electrolytic preconcentration (accumulation) step for trace determination of a wide range of drugs in different matrices. Preconcentration (accumulation) of the analyte can be viewed as an effective extraction step in which its species are accumulated onto surface of the working electrode to a much higher level than they exist in sample solution. The combination of a preconcentration step with the advanced voltammetric measurement generates the extremely favorable signal-to-background ratio that characterizes
stripping voltammetric analysis.14
To date no electroanalytical method has been reported in the literature for determination of nitazoxanide. So, the present work aimed to describe validated simple, fast and precise stability indicating adsorptive cathodic stripping voltammetric methods for trace determination of nitazoxanide in the bulk form, pharmaceutical formulation and in human serum without sample pretreatment, extraction or formation of colored chromogens prior to the analysis.
Experimental
Materials and solutions
(a) Nitazoxanide was kindly provided by Alkan Pharma
for Copadpharma (Cairo, Egypt) and was used without
further purification. The pharmaceutical formulation “Cryptonaz powder” (Alkan Pharma for Copadpharma,
Cairo, Egypt) claimed to contain 80 mg nitazoxanide
per 1.0 g powder (which is used as an oral suspension of
100 mg powder per 5 mL) was purchased from the local
market. A human serum sample was kindly provided by Tanta University Hospital (Tanta, Egypt), iltered through
a 0.45 µm milli-pore ilter (Gelman, Germany) then kept
frozen until use.
(b) A stock standard solution of bulk nitazoxanide
(1×10⁻³ mol L-1) was prepared in ethanol (Merck, Darmstadt,
Germany) then stored at 4 oC until assay. Working solutions
(1×10⁻⁷ to 1×10⁻⁴ mol L-1) bulk nitazoxanide were prepared
daily by appropriate dilution of the standard solution of bulk nitazoxanide with ethanol just before use.
(c) For preparation of Cryptonaz solution, an amount of
Cryptonaz powder equivalent to 1×10⁻³ mol L-1 nitazoxanide
was accurately transferred into a 100 mL calibrated lask containing 70 mL ethanol. The contents of the flask were sonicated for about 10 min and then illed up with ethanol. Afterwards, the solution was iltered through a 0.45 μm Milli-pore ilter (Gelman, Germany). Desired concentrations of nitazoxanide were obtained by accurate dilution of the prepared solution with ethanol. A digital micro-pipetter (Volac, John Poulten Ltd., Essex, UK) was used for transferring the solutions during measurements.
(d) Human serum samples (1.0 mL each) were fortiied
with various concentrations of nitazoxanide (1×10⁻⁷ to
1×10⁻⁴ mol L-1) in 3.0 mL volume polypropylene
micro-centrifuge tubes then each was mixed with a 1.0 mL volume ethanol to denature and precipitate proteins. After vortexing each tube for one minute the precipitated proteins were separated out by centrifugation (using an Eppendorf AG centrifuge 5417C, Hamburg, Germany) for 4 min at 14000 rpm. The clear supernatant layer in each tube was iltrated through a 0.45 μm milli-pore ilter (Gelman, Germany) to produce protein-free human serum
solutions spiked with various concentrations (1×10⁻⁴ to
1×10⁻⁷ mol L-1) of nitazoxanide.
(e) A series of Britton-Robinson (B-R) universal buffer of pH values 2 to 11 was prepared and used as a supporting electrolyte. All the chemicals were of analytical grade and were used without further puriication.
Induced degradation studies
(a) 10.0 mL of ethanolic solution of nitazoxanide
(2×10⁻⁴ mol L-1) were mixed with 10 mL of 4.0 mol L-1
HCl solution. The solution was then reluxed in a two-necked round-bottomed dark lask for 120 min. At adequate time intervals a certain volume of the treated solution
was withdrawn with micropipette to a 10.0 mL volume calibrated lask, immediately cooled in ice path to quench the acid hydrolysis reaction, and then illed up with a B-R universal buffer of pH 4 to give a inal concentration of
1×10⁻⁷ mol L-1 (pH 4 was chosen for assay of the drug
and was adjusted to the required optimum pH with NaOH solution). Concentration of the undegraded standard nitazoxanide after different time intervals of acid-induced degradation was determined by means of the described SW-AdCS voltammetric method.
(b) On the other hand, 10.0 mL of ethanolic solution
of nitazoxanide (2×10⁻⁴ mol L-1) was mixed with 10 mL
of 1.0 mol L-1 NaOH solution at room temperature. At
adequate time intervals a certain volume of the treated solution was withdrawn, introduced into a 10.0 mL volume calibrated lask, then diluted to volume with a B-R universal
buffer of pH 4 to give a inal concentration of 1×10⁻⁷ mol L-1
(pH of the solution was adjusted to the required optimum pH with HCl solution).
Instrumentations
(a) Voltammetric measurements were carried out using computer-controlled Potentiostat / Galvanostat Models 263A and 273A-PAR (Princeton Applied Research, Oak Ridge, TN, USA) with the software 270/250-PAR. Electrode assemblies (303A-PAR) each incorporated with a three-electrode micro-electrolysis cell comprising of a hanging
mercury drop electrode (HMDE) of an area of 0.026 cm2,
an Ag/AgCl/KCls reference electrode and a platinum wire as
a counter electrode were used in the measurements. (b) A potentiostat / galvanostat (Model 173-PAR) incorporated with a digital coulometer (179-PAR) was used for controlled potential electrolysis. A micro-cell incorporated with a platinum wire sealed through the cell bottom for contact with a mercury pool cathode, a saturated calomel electrode as a reference electrode and a platinum gauze as a counter electrode was used. The potential selected was adjusted to be equal to the half peak potential (Ep/2)
of cyclic voltammogram of the reactant plus −0.1 V. The
total charge (Q) passed during the exhaustive electrolysis of nitazoxanide in B-R universal buffers of various pH values (4, 7 and 9) was obtained by integrating the current
electronically. Using Faraday’s equation: N = Q/nF(where
Nis the number of moles of substance being electrolyzed)
the total number of electrons (n) transferred per reactant
molecule at the different pH values was estimated and was found to be four. These results indicated the reduction of the
NO2 group of nitazoxanide molecule at various pH values
to the hydroxylamine stage via the consumption of four electrons.
(c) Electronic absorption spectra of nitazoxanide was recorded at room temperature within the wavelength range 200 to 600 nm using a Shimadzu UV-visible double-beam spectrophotometer Model 160A (Kyoto, Japan) with 1 cm matched quartz cell.
(d) A Mettler balance (Toledo-AB104, Greifensee, Switzerland) was used for weighing the solid materials used in the present study. A pH-meter (Crison, Barcelona, Spain) was used for measuring the pH values of the investigated solutions. The de-ionized water used in this work was obtained by a Purite-Still Plus de-ionizer connected to an AquaMatic double-distillation water system (Hamilton Laboratory Glass Ltd., Kent, UK).
General Analytical Procedure
10.0 mL of the B-R universal buffer of pH 4 containing the appropriate concentration of the analyte (bulk nitazoxanide, Cryptonaz powder or spiked human serum) were transferred into the micro-electrolysis cell and then deoxygenated with pure nitrogen gas before measurements while a stream of nitrogen gas was kept over surface of the solution in the electrolysis cell during the measurements. Preconcentration of the analyte onto surface of the HMDE was carried out by adsorptive accumulation at –0.05 V
(vs. Ag/AgCl/KCls) for 120 s while stirring the solution
at 400 rpm. After elapsed the accumulation time, the stirrer was stopped and a 5 s rest period was allowed for the solution to become quiescent. Voltammograms were recorded by scanning the potential towards the negative direction using differential pulse, linear sweep or square wave potential-waveform. Quantiication of nitazoxanide was performed by means of both calibration curve and standard addition methods.
Results and Discussion
Cyclic voltammetric studies
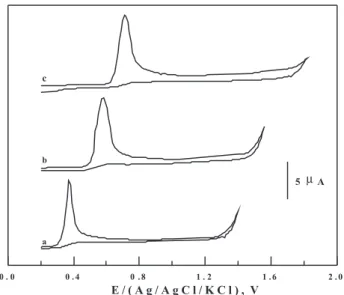
Cyclic voltammograms of 1×10⁻⁴ mol L-1 nitazoxanide
recorded at the HMDE in the B-R universal buffer of various pH values (2 to 11) containing 20% (v/v) ethanol displayed a well-deined single 4-electron irreversible cathodic peak,
Figure 1, which was attributed to reduction of its NO2
group to the hydroxylamine stage15-17 as conirmed from
controlled-potential coulometry measurements. The peak
potential (Ep) shifted to more negative values upon the
increase of pH of the medium indicating the involvement of protons in the electrode reaction and that the proton-transfer
reaction precedes the electron transfer.18 A linear relationship
the regression equation: Ep (V) = 0.068 pH + 0.104, (r = 0.997 and n = 7) was obtained. Its slope value equals
68 mV = {(59/α). (m/na)}, where naand m are the numbers
of electrons and protons involved in the rate determining
step, respectively, and α is the symmetry transfer
coeficient. It is well know that two electrons (na = 2) and
one proton (m = 1) are involved in the rate-determining
step of the electro-reduction process of NO2 group,19i.e.,
the ratio (m/na) = 1/2. Accordingly, α-value of 0.43 was
estimated from slope value (68 mV / pH) of the (Ep) vs.
(pH) plot, indicating the irreversible nature of the electrode
process of nitazoxanide at the mercury electrode.18
On the other hand, the peak potential (Ep) shifted to
more negative values with the increase of scan rate v (25 to
300 mV s-1) indicating the irreversible nature of the electrode
reaction.20,21 Linear relationships of peak potential (E
p) vs.
logarithm of scan rate (v) at different pH values (pH 2 to 11)
following the regression equation Ep(V)= (0.068 - 0.074)
log ν + (0.32 - 0.76), (r = 0.999 ± 0.002 and n = 5) were
obtained. According to Nicholson and Greef, 20,21 values
ofαna of 0.80 to 0.87 andα of 0.40 to 0.44 (for na = 2) were
estimated conirming again the totally irreversible nature of the electrode process of nitazoxanide at the HMDE.
The sharp cathodic peak of nitazoxanide obtained in the B-R universal buffer suggests its strong adsorption onto surface of the mercury electrode. Furthermore, adsorption of nitazoxanide onto the mercury surface was identiied
by recording cyclic voltammograms of 5×10⁻⁷ mol L-1
nitazoxanide at a scan rate of 100 mV s-1 in the B-R
universal buffer of pH 4 following its preconcentration onto the HMDE by adsorptive accumulation under open circuit conditions (Figure 2, scan a) then at an accumulation
potential (Eacc) of –0.05 V (vs. Ag/AgCl/KCls) for 30 s
(Figure 2, 1st cycle band 2nd cycle c). The more enhanced
peak current magnitude of nitazoxanide following its
preconcentration onto the HMDE (Figure 2, 1st cycle
b) indicated its adsorption onto the mercury electrode surface. Moreover, the logarithm of the peak current (ip) vs. logarithm of scan rates (ν) (100 to 500 mV s-1)
was a linear relationship following the regression equation:
log ip = 0.94 logν – 1.33 (r = 0.999 and n = 5). The slope
value of 0.94 is very close to the expected theoretical value
of 1.0 for an ideal reaction of surface species.22
The electrode surface coverage of nitazoxanide Γo
(mol cm-2) in a B-R universal buffer of pH 4 was calculated
using the relation: Γo = Q/nFA, where Q is the charge in
μC related to the surface area under the cyclic voltammeric peak, n is the total number of electrons consumed in the reduction process (n = 4), F is the Faraday constant and A
is the surface area of the working electrode (0.026 cm2).
On dividing the amount of charge (Q) consumed by the surface process, 3.17 μC, by the conversion factor nFA
(10034.65 × 106 μC), a monolayer surface coverage
of 3.16×10⁻¹⁰ mol cm-2 was obtained. Each adsorbed
nitazoxanide molecule thus occupied an area of 0.525 nm2.
Stripping voltammetric studies
Stripping voltammetric methods were optimized for trace determination of nitazoxanide applying linear sweep, differential pulse and square wave potential-waveforms. Stripping voltammograms of bulk nitazoxanide in the B-R
Figure 1. Cyclic volammograms of 1×10⁻⁴ mol L-1 nitazoxanide at the
HMDE in B-R universal buffers of pH values: 4 (a), 7 (b) and 9 (c) at a scan rate of 300 mV s-1.
Figure 2. Cyclic voltammograms of 5×10⁻⁷ mol L-1 nitazoxanide in the
B-R universal buffer of pH 4 at a scan rate of 100 mV s-1: following its
preconcentration onto the HMDE by adsorptive accumulation at open circuit conditions (a) then at –0.05 V for 30 s {1st cycle (b) and 2nd cycle
universal buffer (pH 2 to 11) recorded by linear sweep, differential pulse, or square wave voltammetry following its preconcentration onto the HMDE by adsorptive accumulation for 30 s exhibited a well-deined single irreversible cathodic peak with a better enhanced peak current magnitude at pH 4. Therefore, a B-R universal buffer of pH 4 was chosen as a supporting electrolyte in the rest of study.
Linear sweep stripping voltammetry method
The optimum operational conditions for determination of bulk nitazoxanide applying linear sweep adsorptive cathodic stripping voltammetry (LS-AdCSV) at the HMDE in the B-R universal buffer of pH 4 were identiied. This was carried out by studying the effect of each of scan
rate ν (20 to 100 mV s-1) and preconcentration potential
Eacc. (+0.05 to −0.1 V) on the peak current magnitude of
1×10⁻⁷ mol L-1 bulk nitazoxanide. A better enhanced peak
current magnitude was achieved at optimum operational
conditions of scan rate v = 100 mV s-1, andE
acc = −0.05 V
(vs. Ag/AgCl/KCls), Figure 3. On the other side, effect of
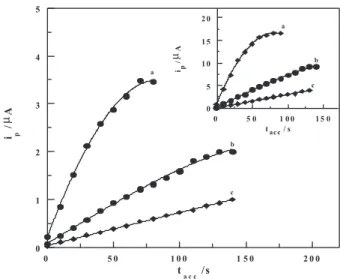
preconcentration time (tacc.) at –0.05 V on the LS-AdCSV
peak current magnitude of various concentrations of bulk
nitazoxanide (5×10⁻⁷, 1×10⁻⁷ and 5×10⁻⁸ mol L-1) under the
optimized operational conditions was evaluated. For 5×10⁻⁷
and 1×10⁻⁷ mol L-1 bulk nitazoxanide, theresponse was
linear up to 60 and 120 s, respectively, and then leveled off (Figure 4). This behavior may be attributed to the complete coverage of the mercury electrode surface with
the analyte species. While for 5×10⁻⁸ mol L-1 nitazoxanide,
as the preconcentration time was increased, linearity was
prevailed over the tested time. This means that the lower the concentration of the analyte, the longer of the accumulation
time is.Therefore,tacc≤ 120 was chosen in the rest of this
study depending on the sensitivity needed.
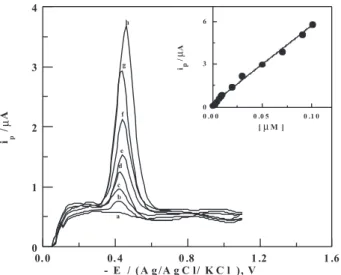
LS-AdCS voltammograms of various concentrations of nitazoxanide were recorded under the optimized operational conditions and a linear variation of the peak
current (ip) with concentration (C) of bulk nitazoxanide
was obtained within the concentration range of 5×10⁻¹⁰ to
2×10⁻⁷ mol L-1 bulk nitazoxanide following the regression
equation: ip (μA) = 57.5 C (μmol L–1) + 0.085 (r = 0.996
and n = 17). A limit of detection (LOD) of 1.5×10⁻¹⁰ mol L-1
and a limit of quantitation (LOQ) of 5×10⁻¹⁰ mol L-1
bulk nitazoxanide were estimated using the expression:
k.S.D./ b,23 where k = 3 and 10 in case of LOD and LOQ,
respectively. SD is the standard deviation of the intercept of calibration curves (or the blank) and b is the slope of the calibration curve.
Differential pulse stripping voltammetry method
The optimum operational conditions of pulse-height, scan rate and preconcentration parameters for determination of bulk nitazoxanide applying differential pulse adsorptive cathodic stripping voltammetry (DP-AdCSV) at the HMDE were identiied. This was carried out by recording
voltammograms of 5×10⁻⁷ mol L-1 bulk nitazoxanide in the
B-R universal buffer of pH 4 under each of the following conditions: scan rate ν (2 to 20 mV s-1), pulse height a
(5 to 50 mV), preconcentration potential Eacc (+0.05 to
–0.1 V), and preconcentration time tacc (0 to 120 s) for
Figure 3. Plot of LS-AdCS voltammetry peak current (ip)vs.
preconcentration potential(Eacc.)of 1×10⁻⁷ mol L-1 bulk nitazoxanide
following its preconcentration onto the HMDE for 30 s in the B-R universal buffer of pH 4 at a scan rate of 100 mV s-1.Inset: The same study using
SW-AdCSV; f = 80 Hz, a = 25 mV and ∆Es = 10 mV.
Figure 4. Plots of LS-AdCS voltammetrypeak current (ip) vs.
preconcentration time (tacc.) of (a) 5×10⁻⁷ (b) 1×10⁻⁷ and(c) 5×10⁻⁸ mol L-1
bulk nitazoxanide following preconcentration onto the HMDE at –0.05 Vin the B-R universal buffer of pH 4 at a scan rate of 100 mV s-1 Inset:
various concentrations of bulk nitazoxanide (5×10⁻⁷, 1×10⁻⁷
and 5×10⁻⁸ mol L-1). The results revealed that the optimal
operational conditions which generated a well-shaped and a better enhanced current magnitude were found to be:
ν = 10 mV s-1, a = 25 mV,E
acc = –0.05 V (vs. Ag/AgCl/KCls),
and tacc ≤ 120 (depending on the sensitivity needed).
DP-AdCS voltammograms of various concentrations of nitazoxanide were recorded under the optimal operational
conditions and a linear variation of the peak current (ip)
with concentration (C) of bulk nitazoxanide was obtained
within the concentration range of 8×10⁻¹⁰ to 1×10⁻⁷ mol L–1
following the regression equation: ip (μA) = 46.6 C (μM) +
0.3 (r = 0.995 and n = 14). A LOD of 2.4×10⁻¹⁰ mol L-1 and
a LOQ of 8×10⁻¹⁰ mol L-1 bulk nitazoxanide were achieved23
applying the described DP-AdCSV method.
Square wave stripping voltammetry method
Optimum operational conditions of both precon-centration and pulse-parameters for determination of bulk nitazoxanide applying square wave adsorptive cathodic stripping voltammetry (SW-AdCSV) were identiied. This was curried out by studying the effect of changing of each
of preconcentration potential Eacc (0 to –0.2 V),
pulse-height a (5 to 50 mV), frequency f (10 to 120 Hz) and scan
increment ∆Es (2 to 12 mV) on peak current magnitude
of 1×10⁻⁷ mol L-1 bulk nitazoxanide in the B-R universal
buffer of pH 4. The results revealed that the optimal operational conditions which generated a better enhanced
current magnitude were: Eacc = –0.05 V (vs. Ag/AgCl/KCls)
(Figure 3, Inset), a = 25 mV, f = 80 Hz and ∆Es = 10 mV.
On the other side, effect of preconcentration time (tacc.)
at –0.05 V on the SW-AdCS votammetric peak current magnitude of various concentrations of bulk nitazoxanide (5×10⁻⁷, 1×10⁻⁷ and 5×10⁻⁸ mol L-1) under the optimized
operational conditions was evaluated (Figure 4, Inset) and
tacc≤ 120 s was chosen depending on the sensitivity needed.
SW-AdCS voltammograms of various concentrations of nitazoxanide were recorded under the optimal operational
conditions and a linear variation of the peak current (ip)
with concentration (C) of bulk nitazoxanide was obtained
within the concentration range of 1×10⁻¹⁰ to 2×10⁻⁷ mol L-1
following the regression equation: ip (μA) = 76.36 C (μM) +
0.176 (r = 0.998 and n = 16). A LOD of 3×10-11 mol L–1 and
a LOQ of 1×10⁻¹⁰ mol L-1 bulk nitazoxanide were achieved23
applying the described SW-AdCSV method.
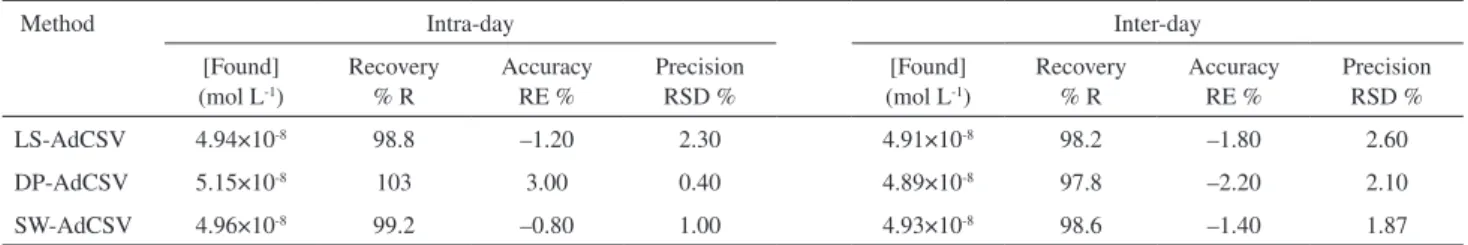
Methods validation
Reproducibility, accuracy and precision24 of results
applying the described stripping voltammetric methods were examined by performing four replicate analysis of standard solutions of bulk nitazoxanide over one day (intra-day assay) and for three successive days (inter-day assay), then calculating the mean percentage recovery (%R) for the found concentrations as a percent of the nominal concentrations in the standard solutions. Accuracy was expressed as relative error (RE%) while precision was assessed from the relative standard deviation in percentage (RSD%) of the mean recovery. The obtained results (Table 1) conirmed the reliability of the described stripping voltammetric methods for assay of nitazoxanide.
Effects of variation of some of the neck operational conditions such as pH (3.5 to 4.5), preconcentration potential (–0.05 to –0.1 V) and preconcentration time (115 to 125 s) on the peak current magnitude of nitazoxanide were also studied by means of the described stripping voltammetric methods. As shown in Table 2, as an
example, the mean percentage recoveries of 5×10⁻⁸ mol L-1
nitazoxanide based on four replicate measurements were insignificantly affected with variation of some of the neck operational conditions. Consequently the described stripping voltammetric methods are reliable for the assay
of nitazoxanide and could be considered robust.24
The inter-laboratory precision24 of determination of
5×10⁻⁸ mol L-1 bulk nitazoxanide was examined by the
described stripping voltammetric methods using two different Models of PAR- Potentiostats 263A (Lab. 1) and 273-PAR (Lab. 2). The obtained results (e.g. Table 2) were found reproducible, since there was no signiicant difference in the mean percentage recoveries or the relative standard deviations. Thus the described stripping
Table 1. Analytical precision and accuracy of determination of 5×10⁻⁸ mol L-1 bulk nitazoxanide by the described voltammetric methods in the B-R buffer
of pH 4 (number of replicated measurements = 4)
Method Intra-day Inter-day
[Found] (mol L-1)
Recovery % R
Accuracy RE %
Precision RSD %
[Found] (mol L-1)
Recovery % R
Accuracy RE %
Precision RSD %
LS-AdCSV 4.94×10⁻⁸ 98.8 –1.20 2.30 4.91×10⁻⁸ 98.2 –1.80 2.60
DP-AdCSV 5.15×10⁻⁸ 103 3.00 0.40 4.89×10⁻⁸ 97.8 –2.20 2.10
voltammetric methods are reliable for assay of nitazoxanide
and could be considered rugged.24
Selectivity24 can be described as the capability of the
method to accurately measure the response of the analyzed compound with no interferences originating from sample
matrix. Here the selectivity24 of the described stripping
voltammetric methods was tested by analysis of different standard solutions of bulk nitazoxanide in the absence and the presence of the common excipients such as lactose, starch, gelatin, talc and magnesium trisilicate. Statistically, insigniicant differences between mean recoveries in the
absence of excipients (99.56 ± 0.88, 98.16 ± 1.24, and 99.62
± 0.94) and in their presence (98 ± 0.38, 101 ± 1.16, and
99.3 ± 0.84) for analysis of 1×10⁻⁸ mol L-1 bulk nitazoxanide
were obtained by mean of the described LS-AdCSV, DP-AdCSV and SW-DP-AdCSV methods, respectively.
Stability indicating property
According to the International Conference on
Harmonization (ICH) guidelines25 it was thought necessary
to study stability of the described stripping voltammetric method for determination of nitazoxanide in the presence of its degradation products. This was carried out by recording
SW-AdCS voltammograms of 1×10⁻⁷ mol L-1 nitazoxanide
solution after subjected to induced degradation with
2.0 mol L-1 HCl (as described in the experimental section)
under the optimum operational conditions. The recorded voltammograms exhibited a signiicant decay of the peak current of nitazoxanide with time until it disappeared completely, while no any other voltammetric peak appeared (Figure 5, curves b-f). This behavior indicated
the complete degradation of nitazoxanide in acid medium and that the degradation product is electro-inactive under the experimental conditions. On the other side,
SW-AdCS voltammograms of a solution of 5×10⁻⁸ mol L-1
bulk nitazoxanide, in the absence and the presence of
an acid-induced degraded solution of 1×10⁻⁷ mol L-1
nitazoxanide were recorded under the optimum operational conditions. Results of analysis revealed that there is no signiicant interference from the degradation products since insigniicance difference was observed in the mean percentage recoveries and relative standard deviations in the absence (99.94 ± 0.68) and the presence (98.0 ± 1.57) of the degradation product.
Degradation rate constant and half-life were computed from slope of the ln (Co/Ct) vs. time (t) plot (Co is the initial
concentration of the nitazoxanide and Ct its concentration
during the acid-induced degradation reaction for the time
interval t). Decay of concentration (Ct) of nitazoxanide
during acid-induced degradation reaction with time (t) is exponential and the linear-it relationship between ln
(Co/Ct) and time (t) up to 120 min (Figure 5, inset) indicating
that the acid induced degradation of nitazoxanide follows pseudo irst-order kinetics. The apparent degradation rate
constant (k) and half-life (t1/2) were estimated and found to
be 2.1×10⁻² min-1 and 33.9 min, respectively.
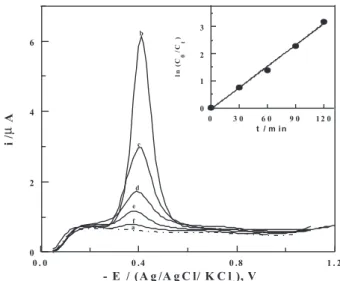
Moreover, stripping voltammetric determination of nitazoxanide in the presence of its base-induced degradation products (as described in the experimental section) was carried out under the optimum operational conditions.
SW-AdCS voltammogram of 1×10⁻⁷ mol L-1 nitazoxanide
solution subjected to base-induced degradation with
Table 2. Validation studies for the direct determination of 5×10⁻⁸ mol L-1
bulk nitazoxanide by means of the described SW-AdCS voltammetric method (number of replicated measurements = 4)
Variables Operational
Conditions
%R ± RSD
pH of the medium 3.5
4.0 4.5
Eacc = –0.05 V tacc = 120 s
97.9 ± 0.11 99.8 ± 0.20 98.2 ± 0.33
Preconcentration potential (Eacc)
–0.05 –0.10
pH = 4 tacc = 120 s
99.8 ± 0.20 97.8 ± 0.25
Preconcentration time (tacc)
115 120 125
pH = 4 Eacc = –0.05 V
97.8 ± 0.25 99.8 ± 0.20 98.2 ± 0.85
Inter-laboratory precision Lab (1)
Lab (2)
pH = 4 Eacc= –0.05 V
tacc= 120 s
99.8 ± 0.20 97.5 ± 0.87
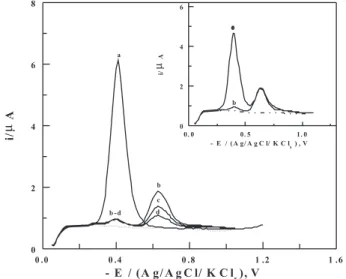
Figure 5. SW-AdCS voltammograms of 1×10⁻⁷ mol L-1 nitazoxanide
solution in the B-R universal buffer of pH 4: Background (a), before treatment with HCl (b), then after induced degradation with 2.0 mol L-1
HCl for different time intervals t (min): 30 (c), 60 (d), 90 (e), and 120 (f); {f = 80 Hz; a = 25 mV and ∆Es = 10 mV}. Inset: plot of ln (Co/Ct)
0.5 mol L-1 NaOH at room temperature exhibited very
fast decay of the cathodic peak current of nitazoxanide
(Ep = –0.4 V) for 5 min of treatment, with the appearance of a
new cathodic peak at more negative potential, Ep = –0.62 V,
(Figure 6, curve b), compared with that of the untreated nitazoxanide solution (Figure 6, curve a). This behavior indicated the extensive base-induced degradation of nitazoxanide with the formation of an electroactive product
(Ep = –0.62 V). However, the peak current magnitude of
the new peak (2nd peak) decreased with progressing time
of degradation (Figure 6, curves b-d) which may be due to further hydrolysis of the degradation product to an electro-inactive one. As shown in inset of Figure 6, the height of
the cathodic peak (1st peak) of 1×10⁻⁷ mol L-1 nitazoxanide
solution which was subjected to base-induced degradation for 5 min (curve b) was increased upon the addition of a
standard solution of 5×10⁻⁸ mol L-1 bulk nitazoxanide (curve
e) while that of the 2nd peak is not. This behavior indicated
that the latter is due to reduction of the degradation product. A mean percentage recovery of the added nitazoxanide was found to be 101.05 ± 1.42 indicating the successful assay of nitazoxanide without interference from its base-induced degradation product. Therefore, the described methods can be consider speciic and could be used successfully as stability-indicating methods for assay of nitazoxanide. However, fast degradation of nitazoxanide with NaOH does not allow the study of kinetics of its degradation reaction. A suggested acid and base-induced degradation reaction of nitazoxanide is shown in Scheme B.
AM1 semi-empirical molecular orbital energy calculations of the bond orders throughout the nitazoxanide molecule revealed that the weakest bond orders within nitazoxanide molecule (I) are the C–O bond of the acetate
group (0.9616) and the C5−NO2 bond (0.9066) of thiazol
ring. Based on these data, the acid-induced degradation of nitazoxanide may be attributed to hydrolysis of the ester
group of phenyl ring26-28 and cleavage of nitro group of
Figure 6. SW-AdCS voltammograms of 1×10⁻⁷ mol L-1 nitazoxanide in
the B-R universal buffer of pH 4: before treatment with NaOH (a), then during induced degradation with 0.5 mol L-1 NaOH for different time
intervals t (min): 5 (b), 15 (c), and 25 (d). Inset: after induced degradation with 0.5 mol L-1 NaOH for 5 min (b) and the same solution after addition
of 5x10⁻⁸ mol L-1 bulk nitazoxanide (e) Dotted line represents background;
f = 80 Hz; a= 25 mV and∆Es= 10 mV.
thiazol ring leading to formation of the electro-inactive product (III). This is consistent with the decay of the mean cathodic peak of nitazoxanide without the appearance of any additional cathodic peak (Figure 5). While, the base-induced degradation of nitazoxanide may lead first to formation of the electro-active yellow anionic intermediate
(II) by deprotonation of the 2-amino group of thiazol ring29
and hydrolysis of the ester group of the phenyl ring26-28
then losing the nitro group of the thiazol ring30 to form the
protonated neutral colorless electro-inactive product (III) due
to loss of resonance in the thiazole ring.29,31 This is consistent
with the practically disappearance of main cathodic peak of
nitazoxanide and appearance of a new peak,Ep = –0.62 V,
(Figure 6, curves b-d) corresponding to reduction of the nitro group of the anionic intermediate product (II) at more negative potential compared to that of standard nitazoxanide (due to the condensed electron density on thiazole ring due
to resonance).29,31 Moreover, decay of 2nd peak current of the
degraded product (II) with progressing time of degradation reaction conirms further hydrolysis of product (II) to the electro-inactive product (III). The negative azo-test for degraded nitazoxanide solution indicated that molecules of the degradation product are free from free primary amino groups which mean that cleavage of amide bond or reduction
of NO2 to amine stage are not involved in the hydrolysis
process of nitazoxanide. Besides, UV-visible absorption
spectrum of 2x10⁻⁵ mol L-1 nitazoxanide (I) recorded in the
B-R universal buffer of pH 7 exhibited an absorbance band
at 420 nm29 (Figure 7) which decays over the time of acid
or base induced degradation reaction due to the loss of NO2
group with the appearance of a new absorbance band at
ca. 288 nm which may be due to the formation of
de-nitro-derivative (III).29-31
Applications
Assay of nitazoxanide in “Cryptonaz powder”
The described stripping voltammetric methods (LS-AdCSV, DP-AdCSV and SW-AdCSV) were
successfully applied to determination of nitazoxanide in its pharmaceutical formulation (Cryptonaz powder) without the necessity for samples pretreatment, time-consuming extraction steps or formation of colored chromogens prior to the analysis. The results indicated insigniicant differences between the taken and found concentrations and consequently between mean percentage recoveries based on four replicate measurements (Table 3). The satisfactory results obtained by means of the described stripping voltammetric methods using both the calibration
curve and standard addition methods (Table 3) were
statistically compared with those obtained by a reported
RP-LC method.8 The calculated F-values did not exceed
the theoretical ones (Table 3), which means that there is no signiicant difference between the described stripping
voltammetric and the reported RP-LC8 methods with
respect to reproducibility.32 Also, no signiicant differences
were noticed between the described and reported methods
regarding the accuracy and precision as revealed by t-test.32
Figure 7. UV-visible electronic absorption spectra of 2.0×10⁻⁵ mol L-1
nitazoxanide in the B-R universal buffer of pH 7 containing 20% (v/v) acetonitrile: before treatment with NaOH (a), then during induced degradation with 0.5 mol L-1 NaOH for different time intervals t (min):
5 (b) and 25 (c).
Table 3. Assay of nitazoxanide in its formulation (Cryptonaz powder) by means of the described stripping voltammetric and a reported reverse phase liquid chromatography (RP-LC)8 methods
Described method ( % R ± RSD) F-value and t-test
(A) (B) (A) (B)
LS-AdCSV 98.63 ±2.33 99.7 ± 1.65 1.67 and 2.40 1.19 and 1.95
DP-AdCSV 99.0 ± 2.52 99.0 ± 1.48 1.96 and 1.59 1.48 and 2.73
SW-AdCSV 99.58 ± 1.23 99.74 ± 1.50 2.15 and 1.24 1.14 and 0.44
RP-LC8 100.4 ± 1.80
Assay of nitazoxanide in spiked human serum
Nitazoxanide spiked in human serum was successfully analyzed by the described voltammetric methods (LS-AdCSV, DP-AdCSV and SW-AdCSV) without the necessity for extraction of the drug prior to the analysis. Representative SW-AdCS voltammograms of nitazoxanide spiked in human serum recorded under the optimum operational conditions of the described stripping voltammetric methods are shown in Figure 8. As shown in Figure 8 (curve a), no interfering peaks were observed in the blank human serum within the studied potential range.
Linear variations of the peak current (ip) with concentration
of nitazoxanide spiked in human serum were obtained
within the concentration ranges of 3×10⁻⁹ to2×10-7 mol L-1
(LS-AdCSV), 5×10⁻⁹ to 1×10⁻⁷ mol L-1 (DP-AdCSV)
and 1×10⁻⁹to 1×10⁻⁷ mol L-1 (SW-AdCSV) following the
regression equations: ( ip (μA) = 45.14 C (μmol L-1) + 0.31;
r = 0.985 and n = 12 ), (ip (μA) = 41.80 C (μmol L-1) + 0.466;
r = 0.990 and n = 11 ), and (ip (μA) = 55.5 C (μmol L-1) +
0.169; r = 0.999 and n = 12), respectively. Detection limits
of 9x10⁻¹⁰, 1.5×10⁻⁹ and 3×10⁻¹⁰ mol L-1 and quantitation
limits of 3×10⁻⁹, 5×10⁻⁹ and 1×10⁻⁹ mol L-1 nitazoxanide
were achieved by the described LS-AdCSV, DP-AdCSV and SW-AdCSV methods, respectively. Mean percentage recoveries and relative standard deviations of 98.2 ± 0.55 (LS-ADCSV), 97.8 ± 0.45 (DP-AdCSV) and 98.5 ± 0.3 (SW-AdCSV) were achieved based on four replicate
measurements of 5×10⁻⁸ mol L-1 nitazoxanide spiked in
human serum. These results conirmed the reliability of the described stripping voltammetric methods for assay of nitazoxanide in human serum.
Conclusions
The electro-reduction of nitazoxanide at the HMDE in buffered solution was studied and discussed. Based on the adsorption behavior of nitazoxanide onto the mercury electrode surface, simple and highly sensitive linear sweep, differential pulse and square wave adsorptive cathodic stripping voltammetric methods were developed for determination of nitazoxanide in bulk form, formulation “Cryptonaz powder” and in spiked human serum without
the necessity for extraction4-10 or formation of colored
chromogens11-13 prior to analysis. Nitazoxanide was also
analyzed successfully without interferences from excipients or from its acid or base-induced degradation products. The achieved limits of quantitation (LOQ) by means of the described stripping voltammetric methods are low as well as they offer good possibilities for determination of drug in low-dosage pharmaceutical preparations and in real plasma samples. The described methods could be recommended for use in quality control and clinical laboratories.
Acknowledgements
M.M. Ghoneim expresses his gratitude to the Alexander von Humboldt Foundation (Bonn, Germany) for donating the Electrochemical Analyzer (263A-PAR) and the personal computer used in the present study.
References
1. Sweetman, S. C.; Martindale The Complete Drug Reference,
33rd ed., London: The Pharmaceutical Press, 2002.
2. O’Neil, M. J.; The Merck Index, 13th ed., Merck & Co., Inc.:
Whitehouse Station: New Jersey, 2001.
3. Stockis, A.; Deroubaix, X.; Lins, R.; Jeanbaptiste, B.; Calderon, P.; Rossignol, J. F.; Int. J. Clin. Pharmacol. Ther. 1996, 34, 349. 4. Rane,V. P.; Sangshetti, J. N.; Patil, K. R.; Yeole, R. D.; Shinde,
D. B.; Chromatographia 2008, 67,455.
5. Jadhav, A. S.; Pathare, D. B.; Shingare,M. S.; Chromatographia 2007, 66, 595.
6. Lin, X.-L.; Liang, G.-D.; Xia, Z.-N.; Chin. J. Pharm. Anal. 2004, 24, 247.
7. Gopu, C. L.; Thomas, S.; Paradkar, A. R.; Mahadik, K. R.;
J. Sci. Ind. Res.2007, 66, 141.
8. Malesuik, M. D.; Cardoso, S. G.; Steppe, M.; Chromatographia 2008, 67, 131.
9. Kalta, R. R.; Sharma, R.; Chaturvedi, S. C.; Indian J. Pharm. Sci. 2008, 70, 491.
10. Sakamoto, T.; Hiyama, Y.; Pharmazie2008, 63, 503. 11. Lakshminarayana, K. V.; Manohara, Y. N.; Gurupadayya, B.
M.; Indian J. Pharm. Sci. 2007, 69, 147. Figure 8. SW-AdCS voltammograms ofvarious concentrations of
nitazoxanide spiked in human serum: (a) Background, (b) 1×10⁻⁹, (c)
3×10⁻⁹, (d) 7×10⁻⁹, (e) 1×10⁻⁸, (f) 2×10⁻⁸, (g) 3×10⁻⁸ and (h) 5×10⁻⁸ mol L-1
12. Kapse, G. K.; Prabhakar, G.; Appala, R. S.; Indian J. Pharm. Sci. 2007, 68, 403 .
13. Narayana, K. V. L.; Manohara, Y. N.; Asian J. Chem. 2007, 19, 2527.
14. Wang, J.; Analytical Electrochemistry, 2nd ed., Wiley-VCH:
New York, 2000.
15. Jain, R.; Dwivedi, A.; Mishra, R.; J. Hazard. Mater.2009, 169, 667.
16. Zuman, P.; Collect. Czech. Chem. Commun.1993, 58, 41. 17. Melo, A. M. Dos S.; Valentim, I. B.; Goulart, M. O. F.; De
Abreu, F. C.; J. Braz. Chem. Soc.2008, 19, 704.
18. Zuman, P.; The Elucidation of Organic Electrode Processes, Academic Press: New York, 1969.
19. Ghoneim, M. M.; El-Ries, M.; Hassanein, A. M.; Abd-Elaziz, A. M.; J. Pharm. Biomed. Anal. 2006, 41, 1268.
20. Nicholson, R. S.; Shain, I.; Anal. Chem.1964, 36, 706.
21. Greef, R.; Peat, R.; Plter, I. M.; Pletcher, D.; Robinson, J.;
Instrumental Methods of analysis in Electrochemistry, E. Horwood, Chichester, 1985.
22. Laviron, E.; Roullier, L.; Degrand, C. A.; J. Electroanal. Chem. 1980, 112, 11.
23. Miller, J. C.; Miller, J. N.; Statistics for Analytical Chemistry, 3rd ed., Ellis Harwood Series, Prentice Hall: New York, 1993.
24. United States Pharmacopoeia Convention, The United States Pharmacopoeia: The National Formulary, 26th ed., Convention
Inc., 2003.
25. ICH, Proceedings of the International Conference on Harmonization, ICH Q1A, Stability Testing of New Drug Substances and Products, Geneva, 1993.
26. Harris, J.; Wamser, C.; Fundamentals of Organic Reaction Mechanisms, Wiley: New York, 1976.
27. McMurry, J.; Castellion, M. E.; Ballantine, D. S.; Fundamentals of General, Organic, and Biological Chemistry, 5th ed., Prentice
Hall, 2007.
28. Clayden, J.; Greeves, N.; Warren, S.; Wothers, P.; Organic Chemistry, Oxford University Press: Oxford, 2001.
29. Hoffman, P. S.; Sisson, G.; Croxen, M. A.; Welch, K.; Harman, W. D.; Cremades, N.; Morash,M. G.; Antimicrob. Agents Chemother.2007, 51, 868.
30. Trukhacheva, L. A.; Levina, V. I.; Grigor´ev, N. B.; Arzamastsev, A. P.; Dalinger, I.; Vatsadze, I. A.; Popova, G. P.; Shevelev, S. A.; Granikb, V. G.; Russ. Chem. Bull. 2005, 54, 2813. 31. Pankuch, G. A.; Appelbaum, P. C.; Antimicrob. Agents
Chemother. 2006, 50, 1112.
32. Christian, G. D.; Analytical Chemistry, 5th ed., John Wiley &
Sons Inc.: USA, 1994.
Received: June 21, 2009