Article
J. Braz. Chem. Soc., Vol. 22, No. 11, 2056-2064, 2011. Printed in Brazil - ©2011 Sociedade Brasileira de Química 0103 - 5053 $6.00+0.00
A
*e-mail: [email protected]
Square-Wave Cathodic Adsorptive Stripping Voltammetric Determination of
3-Hydroxyflavone, Morin and Hesperidin in Bulk Form and Biological Fluids in
Absence and Presence of Cu(II)
Yassien M. Temerk,* Mohamed S. Ibrahim and Mohammed Kotb
Chemistry Department, Faculty of Science, Assiut University, Assiut, Egypt
Devido à atividade farmacológica dos flavonóides, na presente investigação, foi desenvolvido um método eficiente e econômico para a determinação de traços dos mesmos. Neste contexto, o comportamento interfacial de três flavonóides, 3-hidroxiflavona (3HF), morin e hesperidina (Hesp) foi estudado em eletrodo de gota pendente de mercúrio (HMDE) por voltametria ac (fase sensível) e voltametria cíclica (CV). Os flavonóides investigados mostraram-se fortemente absorvidos, o que é um pré-requisito para a aplicação de voltametria adsortiva de redissolução catódica, na determinação de alguns flavonóides. Baseado no caráter de adsorção dos flavonóides investigados, na superfície de HMDE, foi descrito um procedimento de voltametria adsortiva de redissolução catódica com onda quadrada (SWCASV), validado, simples, rápido e sensível, para a quantificação dos flavonóides sob investigação na forma granel e em fluidos biológicos. Além disso, a acumulação adsortiva controlada do complexo de Cu(II) de flavonóides foi também obtida e usada para a determinação indireta de 3HF, morin e Hesp via redução do complexo formado. As condições operacionais e de solução para a determinação quantitativa ultra-traço dos compostos flavonóides investigados, foram otimizadas na ausência e presença de Cu(II). Os limites de detecção
de 4,4 × 10⁻⁹, 7,19 × 10⁻⁹ e 7,54 × 10⁻⁹ mol L-1 para 3HF, morin e Hesp, respectivamente, na forma
granel, foram atingidos usando SWCASV.
As flavonoids show pharmacological activity, in the present investigation, an economical and efficient method for their trace determination was developed. In this context, the interfacial behavior of three flavonoids, 3-hydroxyflavone (3HF), morin and hesperidin (Hesp) was studied on the hanging mercury dropping electrode (HMDE) by phase sensitive ac voltammetry and cyclic voltammetry (CV). The investigated flavonoids were strongly adsorbed which is the prerequisite step for applying the cathodic adsorption stripping voltammetric determination of some flavonoids. Based on the adsorption character of investigated flavonoids onto the surface of the HMDE, validated, simple, fast and sensitive square-wave cathodic adsorptive stripping voltammetric (SWCASV) procedure for the quantification of the flavonoids under investigation in bulk form and in biological fluids was described. Moreover, controlled adsorptive accumulation of the Cu(II) complex of flavonoids was also achieved to assay indirect determination of 3HF, morin and Hesp via the reduction of the formed complex. Operational and solution conditions for the quantitative ultra-trace determination of the investigated flavonoids were optimized in the absence and presence
of Cu(II). Limits of detection of 4.4 × 10⁻⁹, 7.19 × 10⁻⁹ and 7.54 × 10⁻⁹ mol L-1 3HF, morin and
Hesp in bulk form were achieved using SWCASV, respectively.
Keywords: flavonoids, adsorption, trace determination, flavonoid-Cu(II) complex, stripping
voltammetry
Introduction
Flavonoids are non-nutritive compounds of plants that have recently aroused considerable interest due to their broad pharmacological activity.1 Special attention
for monitoring the levels of drug in dosage forms and biological fluids.3,4 In this context, various analytical methods have been reported in literature for determination of some flavonoids. These include UV-Vis absorption, spectrophotometry,5 chromatographic methods like thin-layer chromatography (TL), gas chromatography (GC), liquid chromatography (LC) and capillary electrophoresis (CE) with UV or electrochemical detection,6-11 based on the oxidation of the phenolic hydroxyl groups in flavonoids. Direct electroanalytical determination of flavonoids by differential pulse voltammetry or stripping techniques has only rarely been reported.12-18
In continuation of our studies on the electrochemical determination of flavonoids it would be of interest to investigate the stripping voltammetry with adsorptive accumulation of three flavonoids in absence and presence of Cu(II).18 In the present paper, a validated square-wave adsorptive cathodic stripping voltammetric procedure was described for determination of 3HF, morin and Hesp in bulk forms and in biological fluids. Determination of the investigated flavonoids was also achieved by SWCASV of the formed flavonoid-Cu(II) complex. The application of SWCASV mode for trace determination of three flavonoids in presence of Cu(II) is more sensitive than that in the absence of Cu(II).
Experimental
Instrumentation
A Princeton Applied Research (PAR) Model 173, coupled with universal programmer Model 175, lock-in amplifier/phase detector Model 5210 and PAR Model 303A hanging mercury dropping electrode were employed for ac voltammetric measurements (ac). Phase sensitive ac voltammograms were recorded with phase angle adjusted to 90° corresponding to the out-of-phase component of the total ac current (capacitive current component). The amplitude of the ac voltage was 10 mV peak-to-peak, the scan rate of the dc ramp of the negative electrode potential was 5 mV s-1 and the frequency was 330 Hz, unless otherwise stated. The ac voltammograms were recorded on an advanced X-Y recorder model RE0150, after deaeration of the electrolyzed solutions. Cyclic voltammetry and square-wave cathodic adsorptive stripping voltammetry were carried out using an EG&G PAR model 263A potentiostat/galvanostat controlled by an IBM microcomputer with EG&G PAR M 270 software in conjunction with a PAR model 303A HMDE. The three electrode system was completed by an Ag/AgCl (saturated KCl) reference electrode and a
Pt-wire auxiliary electrode. A PAR model 305 stirrer was also used for SWCASV.
Chemicals and reagents
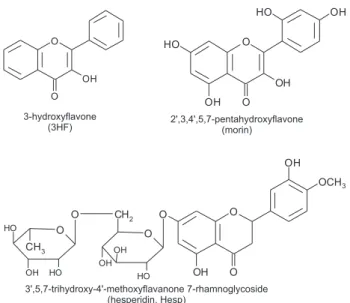
The three flavonoids, 3-hydroxyflavone, morin and hesperidin, (Figure 1) were obtained from Sigma (U.S.A.), and were used as received without further purification. Stock solution of the investigated flavonoids was prepared by dissolving an appropriate amount of the compound in ethanol. The supporting electrolyte was Britton-Robinson (BR) buffer prepared in the usual way by adding appropriate amount of sodium hydroxide (0.4 mol L−1) to an orthophosphoric acid, boric acid and acetic acid mixture (0.08 mol L−1). All chemicals were reagent grade (Merck, Darmstadt). Double distilled deionized water was used to prepare the solutions.
Urine and serum treatment
Human urine and serum samples were taken from healthy donors and used shortly after collection. Urine samples were centrifuged and filtered before use. The proteins of serum sample were also separated by centrifugation for 3 min at 14000 rpm. The clear supernatant layer was filtered through a 0.45 µm milli-pore filter to obtain protein-free serum samples. Different volumes of urine or serum were added to BR buffer to give a total volume of 5.0 mL. When the volume of urine or serum increased, the background current increased rapidly, so, to avoid the sample interferences, dilution was carried out (4.5:0.5 buffer:sample mixture). These diluted samples were used for voltammetric measurements.
Voltammetric measurements
For voltammetric measurements, the test solution was placed in a polarographic cell of volume 10 mL and deoxygenated by bubbling nitrogen for 15 min. During measurements, a steam of nitrogen was passed over the solution. Keeping both concentration of the investigated flavonoid and the total volume of solution constant then electrochemical procedures were carried out, while varying the Cu(II) concentration. The square-wave voltammetric response was obtained using pulse
amplitude, 25 mVpp; scan increment, 10 mV; frequency,
100 Hz; adsorption time, 60 s; equilibrium time, 15 s. Cyclic voltammetric response was obtained using scan rate 100 mV s−1 (unless otherwise stated). Typical CV peak potentials were reproducible to better than ± 5 mV and SWCASV peak potentials to ± 2 mV. All experiments were carried out at 22 ± 0.05 oC.
Statistical analysis
A statistical analysis of the calibration curve parameters (slopes, intercepts, regression coefficients and standard deviations) is given. The variation of the Ip (µA) current with the analyte concentration (mol L−1) is based on the linear equationIp= a + bCwhere a and b are the intercept and the slope of the straight line, respectively. Computations are performed based on an IBM computer using Kaleida graph (version 3.0) software program.
Results and Discussion
Surface activity of flavonoids at the charged interface
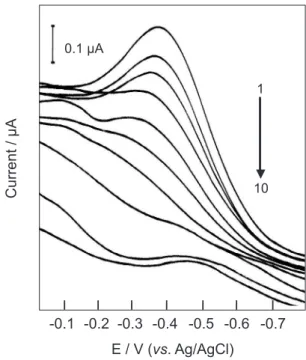
Ac voltammetry on the interfacial behavior of 3HF, morin and Hesp recorded as a function of the mean electrode potential in solutions of varying pH is studied. In this context the ac voltammograms of morin at pH 3.25 indicate that adsorption of the investigated flavonoid occurs across the whole potential range from the most positive adjustable potentials up to the more negative potential region (Figure 2). The interfacial behavior of morin shows around the electrocapillary zero of the blank supporting electrolyte a progressive suppression of the capactive ac signal with the increase of the bulk concentration of the flavonoid compound. This suppression of ac current corresponds to a progressive coverage of the electrode by a dilute adsorption layer.19
In order to calculate the adsorption parameters of the adsorbed molecules at various pH values, the experimental results were fitted to several adsorption isotherms. From the
comparison of the experimental results with theory, it seems that the isotherm is of Frumkin type given by equation 1.
βC = [θ/(1−θ)] exp −2aθ (1)
where θ is the degree of coverage, a is the interaction coefficient, β is the adsorption coefficient and C is the bulk concentration of flavonoids.
Gibbs energy of adsorption (−∆Gº) was then calculated from the adsorption coefficient β using equation 2.
β = 1/55.5 exp (−∆Gº/RT) (2)
The calculated values of the adsorption parameters of 3HF, morin and Hesp at various pH values are given in Table 1. Moderately high positive interaction coefficients a, for dilute layer at various pH values, indicate lateral attractive interaction of the adsorbed molecules. The low values of the adsorption energy indicate that the deviation from the adsorption equilibrium is low and is established at a relatively low bulk concentration of flavonoid compounds.
The surface activity and redox behavior of the flavonoid compounds under investigation were also studied at different pH values by cyclic voltammetry at HMDE. The CV behavior of morin at different pH values is studied and the curves obtained are represented in Figure 3. The
Figure 2. Ac capacitive current of (1) 0.0, (2) 0.039, (3) 0.118 (4) 0.234, (5) 0.328, (6) 0.421, (7) 0.689, (8) 1.33, (9) 1.79, (10) 2.50 µmol L−1 morin at pH 3.25, 0.5 mol L−1 BR buffer (NO
3−). Temperature, 20 °C; area of HMDE, 1.2 × 10⁻² cm2; scan rate, 5 mV s−1; amplitude, 10 mV
cathodic peak is due to the reduction of the carbonyl group of the γ-pyrone ring.14
In this context, cyclic voltammetry of Hesp as a function of potential in solutions of varying pH (3.25-11.25) does not indicate any response to the cathodic and anodic peaks over the investigated pH range. This may be attributed to the reduction of theC=Odouble bond for Hesp at sufficiently more negative potentials where the hydrogen evolution is evolved. Cyclic voltammograms of 3HF and morin at different scan rates are studied (not shown). The cathodic peak potential shifted to more negative values with the increase of the scan rate confirming the irreversible nature of the adsorption process. On plotting log ip versus log ν at pH 7.25 a straight line with a slope of 0.925 was obtained close to the expected slope for an ideal reduction of surface species. So in this case the process appears to have an important adsorption component. Additional information about the course of the adsorption of 3HF and morin was
obtained from the time dependence of cyclic voltammograms (not shown). The CV peak height of the two flavonoids increases with the increase of the adsorption time in the form of an adsorption isotherm. The adsorbed amount of 3HF and morin is proportional to the total charge Q consumed during the reduction of adsorbed molecules, i.e. to the integral of
the reduction current isover the potential range of reduction Es to Ee according to the following equation.20
(3)
where n is the number of electrons in the electrode reaction, F is the Faraday constant, A is the surface area of the electrode and Γ is the surface concentration of the adsorbed
species. The values of the Γ of 3HF and morin were
obtained as 4.98 × 10⁻¹⁰ mol cm−2 and 3.7 × 10⁻¹⁰ mol cm−2, respectively. Therefore, the values of surface area of two flavonoids are 0.33 nm2 (3HF) and 0.44 nm2 (morin). This indicates that the orientation of 3HF and morin in the adsorbed layer is characterized by a planar position with respect to the surface of the electrode.
Square-wave cathodic adsorptive stripping voltammetry of flavonoids
The aforementioned results of ac voltammetry and cyclic voltammetry indicate the strong adsorption of 3HF, morin and Hesp on the electrode surface. This phenomenon can be exploited for the electroanalytical determination of three flavonoids with the aid of square-wave cathodic adsorptive stripping voltammetry.
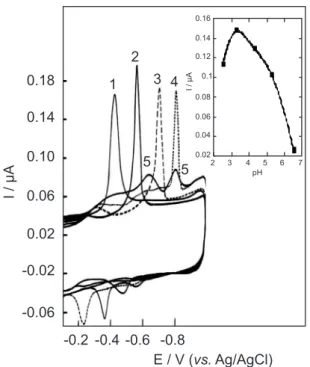
The operational parameters on the SWCASV of the three flavonoids are studied. In this context, the SWCASV of morin recorded as a function of the potential in BR buffer solution containing 0.5 mol L−1 NO
3− of varying pH is shown in Figure 4. The recorded SWCASV peaks at various pH values are mainly due to the direct reduction of the carbonyl group of the γ-pyrone ring. The SWCASV peak is pH dependent; it shifts to more negative potentials with rise of pH.
Table 1. Adsorption parameters for the dilute adsorption layer of 3HF, morin and Hesp, calculated from the results of ac voltammetry at different pH values
pH 3HF morin Hesp
a β × 105 / (L mol−1)
−∆Go / (kcal mol−1)
a β × 105 / (L mol−1)
−∆Go / (kcal mol−1)
a β × 105 / (L mol−1)
−∆Go / (kcal mol−1)
3.25 0.83 6.93 10.23 0.65 12.92 10.78 1.10 5.42 10.08
7.25 0.61 7.72 10.29 0.74 10.09 10.63 0.97 8.56 10.35
9.25 0.53 10.49 10.47 1.1 9.49 10.41 0.62 26.9 11.02
A well-defined peak is observed at pH 7.25 (3HF), pH 3.25 (morin) and pH 5.25 (Hesp) in BR buffer solution containing 0.5 mol L−1 NO
3−. This indicate that nitrate ions exhibit the least tendency for specific anions adsorption and less adsorption forces on the positive charged Hg surface. Therefore, the latter media was chosen for the trace determination of three flavonoids.
The peak height dependence on the adsorption potential was investigated at the optimum pH. The peak current was highly sensitive to the adsorption potential and the maximum peak height was obtained when the adsorption potential was controlled at 0.0 V for 3HF or morin and −0.4 V for Hesp. At more negative values, the interaction of the adsorbed species of the three flavonoids was weak. The adsorption potential was adopted at 0.0 V
(3HF or morin) and −0.4 V (Hesp) for the stripping
analysis experiments.
The SWCASV peak of the investigated flavonoids was recorded at various scan increment, frequencies and pulse heights at the optimum pH (not shown). In order to obtain a much more developed stripping peak current, the optimum instrumental conditions for determination of three flavonoids using SWCASV were found as shown in Table 2.
The dependence of the adsorptive stripping peak current on the adsorption time of the three flavonoids was examined under the aforementioned optimum solution and operational conditions Table 2. The peak current increases with increasing preconcentration time, indicating enhancement of the investigated flavonoids concentration at the electrode surface. At relatively longer adsorption times, an equilibrium surface concentration was reached and the peak height became almost constants. Preconcentration times of 250 and 210 s were arbitrary adopted at the concentration ranges of 9.0 × 10⁻⁸ mol L−1 and 1.9 × 10⁻⁷ mol L−1, respectively. This indicates that the optimized accumulation time should be chosen according to the concentration level of flavonoid compound. The higher concentration level, the shorter the accumulation time is.
Quantitative aspects in absence of Cu(II)
The applicability of the SWCASV technique as an electroanalytical method for trace determination of 3HF, morin and Hesp was studied as a function of the depolarizer concentration under the optimum conditions (Table 2). In this context under the optimum conditions the dependence of peak current on the concentration of morin in absence of Cu(II) is represented in Figure 5. The variation of Ip (µA) with the concentration of the investigated flavonoids is represented by the straight line equation Ip = a + bC where a and b are the intercept and slope of straight line, respectively. A statistical analysis of the calibration curve is given in Table 3.
Validation of the optimized procedure for the quantitative assay of the three flavonoids was examined via evolution of limits of detection (LOD) and quantitation (LOQ),
Figure 4. SWCASV of 1.96 µmol L−1 morin at different pH values (1) 3.25, (2) 4.25, (3) 5.25 and (4) 6.25. Adsorption potential, 0.0 V; adsorption time,60 s; scan increment, 10 mV; frequency, 100 Hz and pulse height, 25 mVPP. Inset: Plot of IP vs. pH.
Table 2. The optimal solution, instrumental and adsorption parameters for the determination of 3HF, morin and Hesp in the absence and presence of Cu(II) ions using SWCASV
system pH adsorption
potential / V
scan increment / mV
frequency / Hz
pulse amplitude / (mVPP)
adsorption time / s
3HF 7.25 0.00 15 1000 50 250
morin 3.25 0.00 12 700 100 250
Hesp 5.25 −0.40 10 1400 50 210
3HF-Cu(II) complex 6.25 −0.05 15 1500 50 300
morin-Cu(II) complex 3.25 +0.10 15 700 50 180
the linearity range and repeatability. The LOD and LOQ were calculated from the calibration graph, obtained after preconcentration of the investigated flavonoid onto the HMDE for four different time periods, using the following equations: 21
LOD = 3 SD/b (4)
LOQ = 10 SD/b (5)
where SD is the standard deviation of the intercept and b is the slope of the calibration curve. Both LOD and LOQ values, confirmed the sensitivity of the proposed procedure. Linearity range, which is the ability to elicit test results that are directly proportional to the concentration of analyte in
samples within a given range, was studied by using the proposed SWCASV. Linear calibration graphs over various concentrations ranging between 0.019 and 0.654 µmol L−1 bulk flavonoid were obtained (Table 3). The regression equation associated with the calibration plots good linearity that supported the validation of the proposed procedure for quantitation of the investigated flavonoid. The repeatability of results using the proposed SWCASV procedure was examined by performing five replicate measurements for 1.96 µmol L−1 of the investigated flavonoid. A mean recovery of 98 ± 1.19 (n = 5) was achieved.
Trace determination of flavonoids by SWCASV via flavonoid-Cu(II) complex
The SWCASV of 3HF, morin and Hesp in presence of some metal ions, which are capable of forming chelate with the three flavonoids or depositing at the mercury electrode, is interesting.22-26 The SWCASV of the three flavonoids was recorded in the presence of Cu(II) at various pH values (not shown). The addition of Cu(II) resulted in a disappearance of SWCASV peak height of investigated flavonoids and the appearance of a new peak at −0.35 V
(pH 6.25), −0.33 V (pH 3.25) and −0.40 V (pH 7.25)
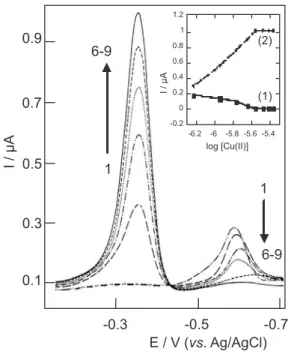
for 3HF, morin and Hesp, respectively. This new peak corresponds to the reduction of Cu(II) in the flavonoid-Cu(II) complex at the electrode surface. The effect of the Cu(II) concentration on the sensitivity of the SWCASV peaks of morin is shown in Figure 6. By increasing the Cu(II) concentration from 0.56 µmol L−1 to 4.33 µmol L−1 in the presence of 5.6 µmol L−1 morin, the reduction peak of morin-Cu(II) complex at −0.33 V increases while the
reduction peak of morin at −0.58 V decreases. Plot of
cathodic peak current (Ip) for the reduction of morin and morin-Cu(II) complex as a function of log [Cu(II)] indicates
Table 3. Calibration curve data for determination of some flavonoids in bulk form and biological fluids in absence and presence of Cu(II) using SWCASV
system linearity range / (µmol L−1)
straight line equation (Ip = a + bC)
regression coefficient (R)
LOD / (mol L−1)
LOQ / (mol L−1) 3HF 0.019-0.242 Ip= 3.617 + 0.838 × 10⁻⁸ C 0.990 4.40 × 10⁻⁹ 1.40 × 10⁻⁸ 3HF in urine 0.290-1.70 Ip= 0.237 + 0.444 × 10⁻⁷ C 0.995 5.00 × 10⁻⁸ 1.60 × 10⁻⁷ 3HF in serum 0.380-1.66 Ip= 1.547 + 0.359 × 10⁻⁷ C 0.994 6.80 × 10⁻⁸ 2.20 × 10⁻⁷ 3HF-Cu(II) complex 0.017-0.185 Ip= −6.838 +3.128 × 10⁻⁸ C 0.992 2.30 × 10⁻⁹ 7.60 × 10⁻⁹ morin 0.019-0.193 Ip= −2.64 + 1.46 × 10⁻⁸ C 0.996 7.19 × 10⁻⁹ 2.39 × 10⁻⁸ morin-Cu(II) complex 0.018-0.095 Ip= 0.24 + 1.07 × 10⁻⁸ C 0.997 4.30 × 10⁻⁹ 1.40 × 10⁻⁸ Hesp 0.019-0.654 Ip= 18.12 + 0.70 × 10⁻⁸ C 0.993 7.54 × 10⁻⁹ 2.51 × 10⁻⁸ Hesp in urine 0.740-2.85 Ip= −0.217 + 9.16 × 10⁻⁶ C 0.994 5.76 × 10⁻⁸ 1.92 × 10⁻⁷ Hesp in serum 0.909-2.85 Ip= 2.185 + 6.962 × 10⁻⁶ C 0.994 7.58 × 10⁻⁸ 2.52 × 10⁻⁷ Hesp-Cu(II) complex 0.009-0.184 Ip= 5.384 + 1.21 × 10⁻⁸ C 0.991 4.89 × 10⁻⁹ 1.63 × 10⁻⁸
Figure 5. Concentration dependence of SWCASV peak of (1) 0.0,
the stoichmetric ratio of 1:2 between Cu(II) and morin as shown in the insert of Figure 6.
The dependence of the adsorptive stripping peak current on the adsorption time of flavonoid-Cu(II) complex was studied. Such time dependent profiles represent the corresponding adsorption isotherms because the peak current depends on the amount adsorbed of flavonoid-Cu(II) complex (not shown). The rising part corresponds to diffusion controlled adsorption and the plateau part represents the full coverage of the electrode surface. At relative longer adsorption time an equilibrium surface constant is reached and the peak height became then constant. The aforementioned results indicate that the height of reduction peak of the tested complex was sensitive towards its accumulation on the electrode surface. Therefore, the spontaneous adsorption of the flavonoid-Cu(II) complex can be used as an effective accumulation step, prior to stripping analysis. In this way trace determination of three flavonoids in presence of Cu(II) could be achieved by means of SWCASV.
The peak height dependence of flavonoid-Cu(II) complex peak on the various solution and operational conditions was carefully investigated. The optimum conditions for the determination of three flavonoid as a Cu(II) complex are summarized in Table 2. Under these optimum conditions the peak height of the complex varied linearly with the concentration of the investigated flavonoid.
The calibration curve data and statistical analysis of the results are given in Table 3. Validation of the optimized procedure for the quantitative trace determination of the three flavonoids via flavonoid-Cu(II) complex was examined. In this context the limits of detection (LOD) and quantitation (LOQ) were calculated using equations 4 and 5 (Table 3). The obtained results confirmed the sensitivity of the proposed procedure for determination of three flavonoids in presence of Cu(II). The effective preconcentration associated with the adsorption of flavonoid-Cu(II) complex results in significant lower the detection limit compared to the corresponding solution measurements of SWCASV of flavonoid in absence of Cu(II). This indicates that the application of SWCASV mode for trace determination of 3HF, morin and Hesp in presence of Cu(II) is more sensitive as compared with that in absence of Cu(II).
Interferences
Interferences of potentially present ions either capable of forming complexes with flavonoid or codepositing at the Hg electrode were evaluated. At the micromol concentration range of some metal ion, e.g., Cd(II), Ca(II),
Ba(II), Mg(II), Ni(II), Co(II) and Zn(II) the degree of recovery of the investigated flavonoids was lowered by 1.59-7%. Strong competitive adsorption of flavonoid-Pb(II) and flavonoid-Fe(III) complexes would decreased the degree of recovery of the investigated flavonoids by 15% and 47%, respectively. This indicates that these metal ions, affect, to some extent, as a result of their tendency for complexation with flavonoids. Many organic compounds could interfere with the determination of 3HF, morin and Hesp if they adsorb on the mercury drop electrode or if they are electroactive by themselves with a reduction potential close to that of the investigated compounds. Organic additives such as EDTA was added to the investigated flavonoids and caused the degree of recovery to diminish by 7.5-15.5%. No interference was produced by glutaric acid, oxalic acid, ascorbic acid and alanine in the determination of 3HF whereas the degree of recovery of morin decreased by 1.5-12.5%. In presence of surface active substances
e.g. of 10 mg L−1 Triton X-100 the sensitivity of the peak current of the investigated flavonoids diminished by 34-72%. The effect of several types of inorganic and organic compounds on the electroanalytical determination of 3HF, morin and Hesp via the chelate adsorption of flavonoid-Cu(II) complex was studied. The presence of Cd(II), Ba(II), Pb(II) and Ni(II) at concentration level of 9.9 × 10⁻⁶ mol L−1 and 9.0 × 10⁻⁵ mol L−1, respectively, invoked a visible decrease of flavonoid-Cu(II) complex
reduction peak. The interfering effects of some organic compounds on the investigated flavonoid-Cu(II) complex were also examined. In this context, the degree of recovery for the reduction of the flavonoid-Cu(II) complex decreases by 4-24% in the presence of oxalic acid, glutaric acid, ascorbic acid and alanine. The reduction signal of the flavonoid-Cu(II) complex disappeared completely in the presence of 2 mg L−1 Triton X-100 as a model surfactant.
Applications
Applications of electroanalytical methods directly on analytes present in physiological matrices such as urine are interesting. The determination of the investigated flavonoids in spiked human urine sample was chosen as a practical example. Adsorptive stripping voltammogram of diluted urine sample (4.5:0.5 BR buffer/urine mixture) is represented in Figure 7. A linear relationship between the peak current and the concentration of flavonoid in spiked human urine sample was obtained. Detection limit of 5.0 × 10⁻⁸ mol L−1 was achieved based on singal-to-noise ratio of 3. A limit of quantitation of 1.6 × 10⁻⁷ mol L−1 was obtained, utilizing equation 5.
Application of SWCASV procedure for the determination of the investigated flavonoids in spiked human serum samples was applied (Figure 8). Experimental and instrumental parameters for quantitative determination
of flavonoids were optimized. No additional reduction peaks from potentially interfering compounds such as amino acids which may be present in the biological samples occurred in the potential range of the investigated flavonoid reduction. The response peak height was linear with the concentration of flavonoid. The LOD and LOQ values are 6.8 × 10⁻⁸ mol L−1 and 2.2 × 10⁻⁷ mol L−1, respectively, using the proposed procedure. Moreover, analysis of serum sample using this procedure required only separation of the precipitated protein with centrifugation, no time consuming for extraction and/or evaporation are required.
Conclusions
An electrochemical cathodic adsorptive stripping procedure for ultra-trace assay of the three flavonoids, 3HF, morin and Hesp in bulk form and in biological fluids was described. Controlled adsorptive accumulation of the three flavonoids under investigation provides the basis for a sensitive adsorptive stripping measurement of 3HF, morin and Hesp in nanomolar concentration. Indirect determination of 3HF, morin and Hesp was also achieved by SWCASV of the formed flavonoid-Cu(II) complex. Factors influencing the trace measurements of the three flavonoids via the reduction of the formed flavonoid-Cu(II) complex are assessed and the attractive stripping performance is characterized. The trace determination of the investigated flavonoids in the presence of Cu(II) by SWCASV was reported in the present work due to the importance role of Cu(II) in initiating and/or promoting the progression of Alzheimer’s and Parkinson’s diseases.
Figure 7. Concentration dependence of SWCASV peak of (1) 0.0, (2) 0.29, (3) 0.47, (4) 0.65, (5) 0.85, (6) 0.99, (7) 1.10, (8) 1.30, (9) 1.40, (10) 1.60, (11) 1.70 µmol L−1 3HF in human urine at pH 7.25. Adsorption potential, 0.0V; adsorption time, 250 s; frequency, 1000 Hz; scan increment, 15 mV; pulse height, 50 mVPP. Inset: Plot of IP vs. the concentration of 3HF in urine.
Acknowledgments
Yassien M. Temerk is grateful to the Alexander von Humboldt stiftung, Germany, for financial support to this investigation.
References
1. Di Carlo, G.; Mascolo, N.; Izzo, A. A.; Capasso, F.; Life Sci.
1999, 65, 337.
2. Hertog, M. G.; Feskens, E. J.; Kromhoutatan, D.; Lancet 1997, 349, 699.
3. Soleas, G. J.; Yan, J.; Goldberg, D. M.; J. Chromatogr., B: Anal. Technol. Biomed. Life Sci. 2001, 757, 161.
4. Dubber, M. J.; Sewram, V.; Mshicileli, N.; Shephard, G. S.; Kanfer, I.; J. Pharm. Biomed.Anal. 2005, 37, 723.
5. Nikolovska, Z.; Klisarova, L.; Suturkova, L.; Dorevski, K.; Anal. Lett. 1996, 29, 97.
6. Maleŝ, Ž.; Medić, M.; J. Pharm. Biomed. Anal. 2001, 24, 353. 7. Wang, L.; Morris, M. E.; J. Chromatogr., B: Anal. Technol.
Biomed. Life Sci. 2005, 821, 194.
8. Careri, M.; Elviri, L.; Mangia, A.; Musci, M.; J. Chromatogr., A 2000, 881, 449.
9. Peyrat, M.; Bonnely, S.; Berset, C.; Talanta 2000, 51, 709.
10. Xu, X.; Ye, H.; Wang, W.; Yu, L.; Chen, G.; Talanta 2006, 68, 759.
11. Wu, T.; Guan, Y.; Ye, J.; Food Chem. 2007, 100, 1573. 12. Hendrickson, H. P.; Kaufman, A. D.; Lunte, C. E.; J. Pharm.
Biomed. Anal. 1994, 12,325.
13. Obendorf, D.; Reichart, E.; Electroanalysis 1995, 7, 1075. 14. Reichart, E.; Obendorf, D.; Anal. Chim. Acta 1998, 360, 179.
15. Volikakis, G. J.; Efstathiou, C. E.; Talanta 2000, 51, 775. 16. Blasco, A. J.; Rogerio, M. C.; Gonzalez, M. C.; Escarpa, A.;
Anal. Chim. Acta 2005, 539,237.
17. Volikakis, G. J.; Efstathiou, C. E.; Anal. Chim. Acta 2005, 551,
124.
18. Temerk, Y. M.; Ibrahim, H. S.; Schuhmann, W.; Microchem. J.
2006, 153, 7.
19. Temerk, Y. M.; Valenta, P.; Nurnberg, H. W.; J. Electroanal. Chem. 1980, 109, 289.
20. Temerk, Y. M.; Valenta, P.; J. Electroanal. Chem. 1978, 93, 57.
21. The United States Pharmacopoeia, The National Formularly, USP 24, NF 19,USP Convention Inc., 12601 Twinbrook Parkway, Rockville, MD, 2000, p. 2151.
22. Speier, G.; Fulop, V.; Balogh, E.; Tyeklar, Z.; J. Inorg. Biochem.
1989, 36, 329.
23. Songa, Y.; Kanga, J.; Wanga, Z.; Lua, X.; Gaoa, J.; Wang, L.; J. Inorg. Biochem. 2002,91, 470.
24. Fernandez, M. T.; Mira, M. L.; Florêncio, M. H.; Jennings, K. R.; J. Inorg. Biochem. 2002, 92, 105.
25. Le Nest, G.; Caille, O.; Woudstra, M.; Roche, S.; Burlat, B.; Belle, V.; Guigliarelli, B.; Lexa,D.; Inorg. Chim. Acta 2004, 357, 2027.
26. Ensafi, A. A.; Hajian, R.; Electroanalysis 2006, 18, 579.
Submitted: November 8, 2010