www.ccarevista.ufc.br ISSN 1806-6690
Physiological characteristics in seeds of the common bean under
multicollinearity and conditions of salinity
1Características fisiológicas de sementes de feijão sob multicolinearidade em
condições de salinidade
José Henrique Soler Guilhen2, Tiago de Souza Marçal2, Rafael Fonsêca Zanotti3, José Carlos Lopes4 e Adésio
Ferreira4*
ABSTRACT -The objective of this work was evaluate multicollinearity effect and discard the variables which are based
on multicollinearity reduction in diversity analysis of common bean genotypes, related to seeds physiological quality, in different salinity levels in germination substrate. The common bean seed germination test for six cultivars and seven landrace genotypes was performed in paper rolls (germitest), imbibed in NaCl solutions on the osmotic potentials of 0.0; 0.3 and -0.6 MPa, maintained in germinated Mangelsdorff type at temperature of 25 °C, on constant light. The experimental design was completely randomized in factorial arrangement 13 x 3 (genotype x osmotic potential), with four replications with 25 seeds, totaling 100 seeds per treatment. The carried out evaluations were: weight of a thousand seeds, germination mean time, primary root protrusion in five and nine days after seeding, normal seedling percentage, hypocotyl and primary root length and dry matter from aerial part and roots. The multicollinearity diagnosis was carried out on the phenotypic correlation matrix and the characteristic discard was preceded through the canonical variable technique. To evaluate the multicollinearity effect, the Tocher cluster method was used before and after the variables discard. The proposed discard methodology of variables is efficient on the multicollinearity reduction and the number of discarded physiological quality descriptors is higher on the potentials of -0.3 and -0.6 MPa, under salt stress conditions, need to be discarded three characteristics and in the absence of stress only two discarded, to became a weak condition of multicollinearity to follow with the cluster analysis. The common bean genotypes clusters are different on the severe and weak multicollinearity only under salt stress condition.
Key words:Phaseolus vulgaris. Salt stress. Canonical variable.
RESUMO - Objetivou-se neste trabalho avaliar o efeito da multicolinearidade e descartar variáveis baseadas na redução da multicolinearidade em análise de diversidade de genótipos de feijão, em relação à qualidade fisiológica de sementes, em diferentes níveis de salinidade em substrato de germinação. O teste de germinação de sementes do feijoeiro para seis cultivares e sete genótipos crioulos foi realizado em rolos de papel toalha, tipo germitest, embebidos em soluções de NaCl, nos potenciais osmóticos de 0,0; -0,3 e -0,6 MPa, mantidos em germinador tipo Mangelsdorff com temperatura de 25 ºC e luz constantes. O delineamento utilizado foi inteiramente ao acaso em arranjo fatorial 13 x 3 (genótipos x potenciais osmóticos), com quatro repetições de 25 sementes, totalizando 100 sementes por tratamento. Realizou-se o diagnóstico de multicolinearidade na matriz de correlação fenotípica e procedeu-se o descarte de variáveis, utilizando-se a técnica de variável canônica. Para avaliar o efeito da multicolinearidade, utilizou-se o método de agrupamento Tocher, antes e após o descarte das variáveis. A metodologia de descarte de variáveis proposta é eficiente na redução da multicolinearidade e o número de descritores de qualidade fisiológica descartados é maior nos potencias de -0,3 e -0,6 MPa. Sob condições de estresse salino necessita-se descartar três características e na ausência de estresse, apenas duas características descartadas satisfazem a condição de multicolinearidade fraca para seguir com as análises de agrupamento. Os agrupamentos dos genótipos de feijoeiro comum são alterados em condições de multicolinearidade severa e fraca, apenas na condição de estresse salino.
Palavras-chave:Phaseolus vulgaris. Estresse salino. Variável canônica.
DOI: 10.5935/1806-6690.20160015 * Autor para correspondência
1Recebido para publicação em 14/08/2014, aprovado em 23/09/2015
Parte de Tese do terceiro autor apresentada ao Programa de Pós-Graduação em Produção Vegetal da Universidade Federal do Espírito Santo
2Programa de Pós-Graduação em Genética e Melhoramento, Centro de Ciências Agrárias, Alto Universitário, Universidade Federal do Espírito
Santo s/nº, Guararema, Alegre-ES, 29.500-000, [email protected]; [email protected]
3Programa de Pós-Graduação em Produção Vegetal, Centro de Ciências Agrárias, Alto Universitário, Universidade Federal do Espírito Santo, s/nº,
Guararema , Alegre-ES, 29.500-000, [email protected]
4Centro de Ciências Agrárias, Alto Universitário, Universidade Federal do Espírito Santo, s/nº, Guararema, Alegre-ES, 29.500-000, jcufes@
INTRODUCTION
The common bean (Phaseolus vulgaris L.) is a
legume of the Fabaceae family, whose grain is much appreciated, being an important source of calories, proteins,
carbohydrates (HADŽI et al., 2013; PLANS et al.,
2013), zinc (ROSAet al., 2010), iron (PEDROSAet al.,
2015), and calcium (JOST et al., 2009), with a low lipid
content (PEDROSAet al., 2015). In Brazil, the bean is the
fifth most-produced grain crop (CONAB, 2015), and in 2012 Brazil was the world’s third largest producer of the common bean, with a production of 2.94 million tonnes and a productivity of 1037.24 kg ha-1 (FAO, 2013).
Salinisation reduces the productivity of various
crops (ANDRÉO-SOUZAet al., 2010; MACHADOet al.,
2007), including the bean (BEN-GALet al., 2009), due to
morphological changes caused by saline solutions, such as a reduction in germination (SAEIDI-SARet al., 2013),
during initial development (BOURGAULTet al., 2010)
and in the vegetative growth attributed to osmotic stress; a result of the reduction in water potential of the medium and the toxic ion effect caused by the accumulation of ions in the tissues (AYDIN; KANT; TURAN, 2012;
KHADRI; TEJERA; LLUCH, 2007; ROSALES et al.,
2012), which modifies gene expression during salt stress
(HERNÁNDEZ-LUCEROet al., 2014). However, among
bean genotypes it is possible to select the most tolerant genetic materials to saline stress (BAYUELO-JIMENEZ; JASSO-PLATA; OCHOA, 2012) for use as parents in breeding programs.
One of the factors which compromise the correct interpretation of clusters is multicollinearity. This is the high correlation between the set of explanatory characteristics of an experiment, which may reduce the efficiency of the multivariate techniques that use the residual covariance matrix (CRUZ; REGAZZI, 2001). The breeder can use techniques that help reduce multicollinearity, such as discarding redundant variables, so as to decrease time and manpower in future evaluations (CRUZ; REGAZZI, 2001).
Given the above, the aim of this study was to evaluate the effect of multicollinearity and to discard variables with a view to reducing multicollinearity in the diversity analysis of bean genotypes, in relation to the physiological quality of seeds at different salinity levels in the substrate.
MATERIAL AND METHODS
The experiment was set up and carried out at the Seed Analysis Laboratory (LAS) of the Department of Plant Production at the Centre for Agricultural Sciences
of the Federal University of Espirito Santo (CCA-UFES), in Alegre, in the State of Espírito Santo, Brazil (ES), in January 2013.
The seeds used in the experiment were from six
cultivars of the common bean (Phaseolus vulgaris L.),
provided by the Agronomic Institute of Paraná (IAPAR), in Londrina, Paraná: G1 - IPR Campos Gerais, G2 - IAPAR-81, G 3 - IPR Andorinha, G4 - IPR Siriri, G5 IPR - Curió, and G6 - IPR Colibri, and seven landrace genotypes
obtained from various locations: G7 - Vagem Riscada
(Muqui, ES), G8 -Sangue de burro (Manhumirim, MG),
G9 -Carioquinha (Tupa, SP), G10 -Rosinha (Tupa, SP),
G11 -Mulatinho (Tupa, SP), G12 -Roxinho (Simonésia,
MG) and G13 -Preto (São José do Mantimento, MG).
The seeds were disinfected with a 2.5% solution of sodium hypochlorite for two minutes and then in 70% alcohol for 30 seconds (modified from MESQUITA; MARINO, 2009). The germination test was carried out in a Mangelsdorff germinator, at a temperature of 25 °C and under constant light (two 40W fluorescent, special daylight lamps), with the seeds being placed in roll made up from three layers of germitest paper towel (BRASIL, 2009), moistened with a volume of solution equal to 2.5 times their dry weight. An osmotic potential of -0.6 MPa was considered to be moderately harmful to the vigour of
the bean seeds in the germination test (COELHO et al.,
2010). An osmotic potential of 0.0, -0.3 and -0.6 MPa were therefore selected for the tests. For the calculation and preparation of the NaCl saline solutions at an osmotic potential of 0.0, -0.3 and -0.6 MPa, the Van’t Hoff equation, as cited by Pimenta (2004), was used.
The experimental design was completely randomised, with treatments distributed in a 13 x 3 factorial scheme (genotypes x osmotic potentials) with four replications of 25 seeds, giving a total of 100 seeds per treatment.
The characteristics to be analysed were thousand seed weight (TW) (BRASIL, 2009), mean germination time (MGT) (LABOURIAU, 1983), percentage of primary root protrusion ( 2 mm) at five days after sowing (PL), and the percentage of seeds with primary root protrusion at nine days after sowing (G). The criterion of days was adapted from BRASIL (2009); the percentage of normal seedlings at nine days after sowing (NS) (BRASIL, 2009) was obtained by counting seedlings with their key structures well developed, and with more than three centimetres of root and hypocotyl.
weight (three days); weighing was by digital analytical balance (0.0001 g). The dry weight of the shoots (SDW) without cotyledons, and of the roots (RDW) were expressed in grams seedling-1.
The residual and phenotypic covariance matrices were estimated, and multicollinearity was diagnosed for the phenotypic correlation data, and classified as to the number of conditions (NC), as weak (NC 100), moderate to strong (100 < NC <1000) and severe (NC 1000) (MONTGOMERY; PECK, 1981). An analysis was then made of the canonical variables to discard the most important variable associated with the lowest eigenvalue (CRUZ; REGAZZI; CARNEIRO, 2012). This procedure was carried out in the form of a loop, with the first value for NC of less than 100 being considered as the stopping criterion.
To check the effect of multicollinearity on the variables of seed germination and initial growth of the bean seedlings, the Tocher optimisation method was used to cluster the genotypes, based on the generalised
Mahalanobis distance (D2), both before and after
discarding variables. All the analyses were performed using the Genes, v.2013 software (CRUZ, 2013).
RESULTS AND DISCUSSION
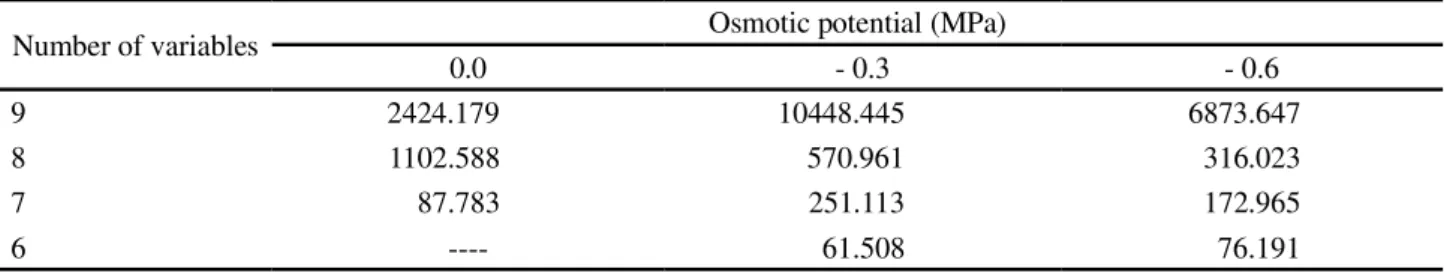
The multicollinearity diagnostic carried out for the set of nine variables evaluated in the bean genotypes for each osmotic potential, gave NC 1000. After discarding one variable, the multicollinearity remained severe (NC 1000) for the osmotic potential of 0.0 MPa, while for the remaining osmotic potentials (-0.3 and -0.6 MPa), it went down to moderate to strong (100 < NC <1000) (Table 1).
Discarding the second variable reduced the multicollinearity to weak (NC 100) at a potential of 0.0 MPa. However, at a potential of -0.3 and -0.6 MPa, the multicollinearity was moderate to strong, it being necessary to discard a third variable to obtain an NC 100 (Table 1). Multicollinearity results in unsuitable clustering
Table 1 - Multicollinearity diagnostic in relation to the number of conditions (NC), and to the number of seed and seedling variables analysed for an osmotic potential of 0.0, -0.3 and -0.6 MPa
Number of variables Osmotic potential (MPa)
0.0 - 0.3 - 0.6
9 2424.179 10448.445 6873.647
8 1102.588 570.961 316.023
7 87.783 251.113 172.965
6 ---- 61.508 76.191
in the bean by preventing true expression of the degree of dissimilarity between individuals (CARGNELUTTI FILHOet al., 2009).
Analysis for the osmotic potentials showed that under conditions of salt stress it was necessary to discard three characteristics, or only two in the absence of stress, to satisfy the condition of weak multicollinearity. The greater number of discarded features under conditions of stress may be related to the close association between the variables under stress conditions. Due to the high degree of association of the variables, the effective dimension of the matrix becomes less than the total number of variables, resulting in a linear dependence between the rows of the matrix (RENCHER, 2003).
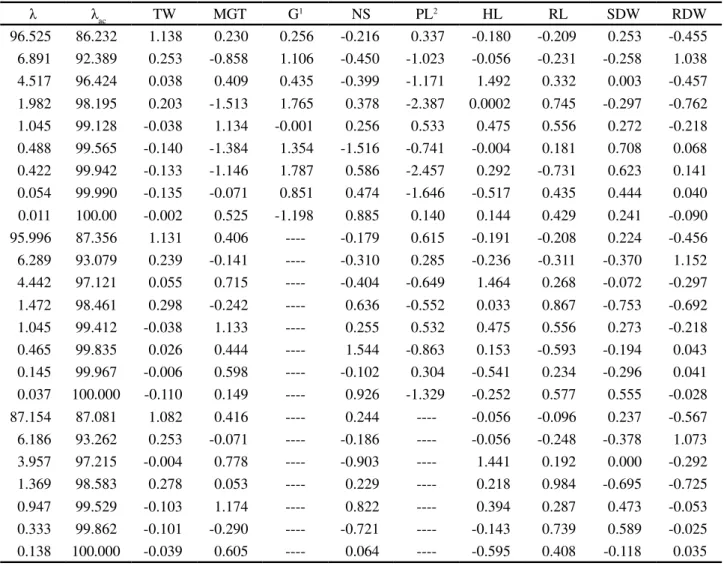
Discarding variables using the canonical variables gave a reduction in multicollinearity from 2424 to 87, from 10448 to 61 and from 6873 to 76, for an osmotic potential of 0.0, -0.3 and -0.6 MPa respectively (Table 1). In the absence of stress (0.0 MPa), the characteristic G was selected for disposal, as it presented a greater weighting coefficient for the least-important eigenvector in the phenotypic correlation matrix. However, discarding the G variable was insufficient to achieve an NC 100 (Table 2). In the second selection cycle, without the G variable, PL was the variable indicated to be discarded; this had the highest coefficient of canonical weighting (1,329) in absolute terms for the last canonical variable (Table 2). After discarding PL, the criterion of weak multicollinearity was achieved. The variables G and PL were therefore considered redundant and increased multicollinearity at a potential of 0.0 MPa.
Table 2 - Estimation of variances ( ), accumulated variances ( ac) and standardised weighting coefficients of the canonical variables for the characteristics, thousand seed weight (TW), mean germination time (MGT), primary root protrusion at nine days (G), normal seedlings (NS), primary root protrusion on the fifth day (PL), length of hypocotyl (HL), length of root (RL), shoot dry weight (SDW) and root dry weight (RDW) in the absence of salt stress 0.0 MPa
ac TW MGT G1 NS PL2 HL RL SDW RDW
96.525 86.232 1.138 0.230 0.256 -0.216 0.337 -0.180 -0.209 0.253 -0.455
6.891 92.389 0.253 -0.858 1.106 -0.450 -1.023 -0.056 -0.231 -0.258 1.038
4.517 96.424 0.038 0.409 0.435 -0.399 -1.171 1.492 0.332 0.003 -0.457
1.982 98.195 0.203 -1.513 1.765 0.378 -2.387 0.0002 0.745 -0.297 -0.762
1.045 99.128 -0.038 1.134 -0.001 0.256 0.533 0.475 0.556 0.272 -0.218
0.488 99.565 -0.140 -1.384 1.354 -1.516 -0.741 -0.004 0.181 0.708 0.068
0.422 99.942 -0.133 -1.146 1.787 0.586 -2.457 0.292 -0.731 0.623 0.141
0.054 99.990 -0.135 -0.071 0.851 0.474 -1.646 -0.517 0.435 0.444 0.040
0.011 100.00 -0.002 0.525 -1.198 0.885 0.140 0.144 0.429 0.241 -0.090
95.996 87.356 1.131 0.406 ---- -0.179 0.615 -0.191 -0.208 0.224 -0.456
6.289 93.079 0.239 -0.141 ---- -0.310 0.285 -0.236 -0.311 -0.370 1.152
4.442 97.121 0.055 0.715 ---- -0.404 -0.649 1.464 0.268 -0.072 -0.297
1.472 98.461 0.298 -0.242 ---- 0.636 -0.552 0.033 0.867 -0.753 -0.692
1.045 99.412 -0.038 1.133 ---- 0.255 0.532 0.475 0.556 0.273 -0.218
0.465 99.835 0.026 0.444 ---- 1.544 -0.863 0.153 -0.593 -0.194 0.043
0.145 99.967 -0.006 0.598 ---- -0.102 0.304 -0.541 0.234 -0.296 0.041
0.037 100.000 -0.110 0.149 ---- 0.926 -1.329 -0.252 0.577 0.555 -0.028
87.154 87.081 1.082 0.416 ---- 0.244 ---- -0.056 -0.096 0.237 -0.567
6.186 93.262 0.253 -0.071 ---- -0.186 ---- -0.056 -0.248 -0.378 1.073
3.957 97.215 -0.004 0.778 ---- -0.903 ---- 1.441 0.192 0.000 -0.292
1.369 98.583 0.278 0.053 ---- 0.229 ---- 0.218 0.984 -0.695 -0.725
0.947 99.529 -0.103 1.174 ---- 0.822 ---- 0.394 0.287 0.473 -0.053
0.333 99.862 -0.101 -0.290 ---- -0.721 ---- -0.143 0.739 0.589 -0.025
0.138 100.000 -0.039 0.605 ---- 0.064 ---- -0.595 0.408 -0.118 0.035
The values1 and2correspond to the first and second discarded variables respectively
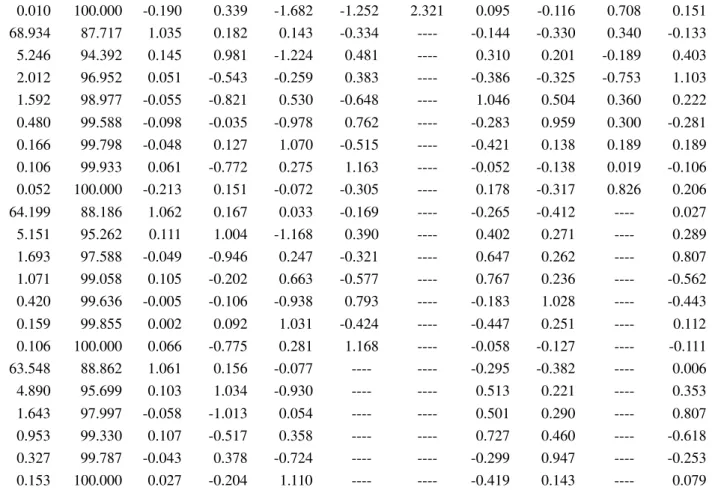
Table 3 - Estimation of variances ( ), accumulated variances ( ac) and standardised weighting coefficients of the canonical variables for the characteristics, thousand seed weight (TW), mean germination time (MGT), primary root protrusion at nine days (G), normal seedlings (NS), primary root protrusion on the fifth day (PL), length of hypocotyl (HL), length of root (RL), shoot dry weight (SDW) and root dry weight (RDW) for an osmotic potential of -0.3 MPa in a solution of NaCl
ac TW MGT G NS3 PL1 HL RL SDW2 RDW
70.197 87.669 1.045 0.175 -0.233 -0.486 0.525 -0.159 -0.345 0.331 -0.104
5.246 94.221 0.145 0.980 -1.242 0.475 0.025 0.309 0.200 -0.190 0.405
2.134 96.885 0.053 -0.530 -0.937 0.119 0.950 -0.420 -0.356 -0.767 1.115
1.593 98.875 -0.054 -0.834 0.595 -0.606 -0.103 1.035 0.497 0.340 0.250
0.487 99.483 -0.100 -0.028 -0.616 0.890 -0.501 -0.292 0.944 0.290 -0.254
0.181 99.709 -0.080 0.300 2.075 -0.281 -1.707 -0.304 0.011 0.222 0.275
0.138 99.882 0.063 -0.436 -0.635 -0.0003 1.888 -0.307 0.159 -0.054 -0.082
0.010 100.000 -0.190 0.339 -1.682 -1.252 2.321 0.095 -0.116 0.708 0.151
68.934 87.717 1.035 0.182 0.143 -0.334 ---- -0.144 -0.330 0.340 -0.133
5.246 94.392 0.145 0.981 -1.224 0.481 ---- 0.310 0.201 -0.189 0.403
2.012 96.952 0.051 -0.543 -0.259 0.383 ---- -0.386 -0.325 -0.753 1.103
1.592 98.977 -0.055 -0.821 0.530 -0.648 ---- 1.046 0.504 0.360 0.222
0.480 99.588 -0.098 -0.035 -0.978 0.762 ---- -0.283 0.959 0.300 -0.281
0.166 99.798 -0.048 0.127 1.070 -0.515 ---- -0.421 0.138 0.189 0.189
0.106 99.933 0.061 -0.772 0.275 1.163 ---- -0.052 -0.138 0.019 -0.106
0.052 100.000 -0.213 0.151 -0.072 -0.305 ---- 0.178 -0.317 0.826 0.206
64.199 88.186 1.062 0.167 0.033 -0.169 ---- -0.265 -0.412 ---- 0.027
5.151 95.262 0.111 1.004 -1.168 0.390 ---- 0.402 0.271 ---- 0.289
1.693 97.588 -0.049 -0.946 0.247 -0.321 ---- 0.647 0.262 ---- 0.807
1.071 99.058 0.105 -0.202 0.663 -0.577 ---- 0.767 0.236 ---- -0.562
0.420 99.636 -0.005 -0.106 -0.938 0.793 ---- -0.183 1.028 ---- -0.443
0.159 99.855 0.002 0.092 1.031 -0.424 ---- -0.447 0.251 ---- 0.112
0.106 100.000 0.066 -0.775 0.281 1.168 ---- -0.058 -0.127 ---- -0.111
63.548 88.862 1.061 0.156 -0.077 ---- ---- -0.295 -0.382 ---- 0.006
4.890 95.699 0.103 1.034 -0.930 ---- ---- 0.513 0.221 ---- 0.353
1.643 97.997 -0.058 -1.013 0.054 ---- ---- 0.501 0.290 ---- 0.807
0.953 99.330 0.107 -0.517 0.358 ---- ---- 0.727 0.460 ---- -0.618
0.327 99.787 -0.043 0.378 -0.724 ---- ---- -0.299 0.947 ---- -0.253
0.153 100.000 0.027 -0.204 1.110 ---- ---- -0.419 0.143 ---- 0.079
Table 3 Continued
The values1,2 and3correspond to the first, second and third discarded variables respectively
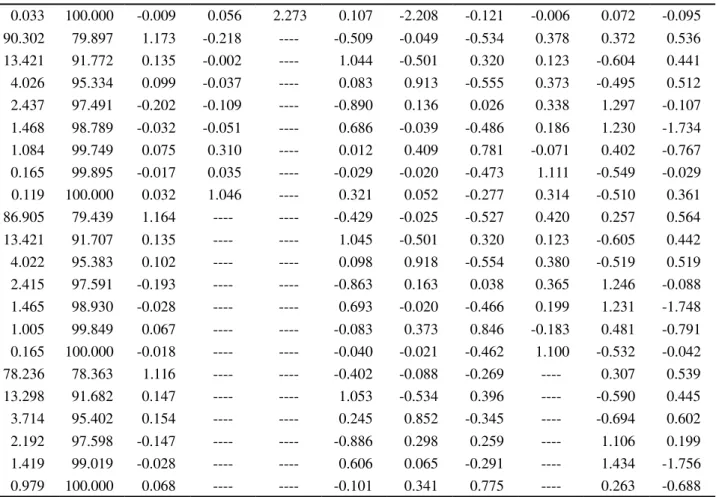
For the condition of -0.6 MPa, three selection cycles were performed, with the discarded characteristics being G, MGT and RL, based on the
weight of the weighting coefficients (2.273, 1.046 and 1.100) for the last canonical variable respectively (Table 4).
Table 4 - Estimation of variances ( ), accumulated variances ( ac) and standardised weighting coefficients of the canonical variables
for the characteristics, thousand seed weight (TW), mean germination time (MGT), primary root protrusion at nine days (G), normal seedlings (NS), primary root protrusion at five days (PL), length of hypocotyl (HL), length of root (RL), shoot dry weight (SDW) and root dry weight (RDW) for an osmotic potential of -0.6 MPa in a solution of NaCl
ac TW MGT2 G1 NS PL HL RL3 SDW RDW
90.685 79.420 1.177 -0.280 0.216 -0.503 -0.259 -0.538 0.376 0.375 0.529
13.878 91.574 0.136 -0.178 0.608 1.045 -1.065 0.299 0.115 -0.599 0.417
4.203 95.255 0.097 -0.233 0.676 0.058 0.262 -0.567 0.337 -0.485 0.464
2.458 97.408 -0.195 -0.023 -0.293 -0.860 0.452 0.007 0.363 1.261 -0.078
1.475 98.700 -0.024 0.024 -0.234 0.713 0.201 -0.486 0.193 1.181 -1.701
1.086 99.651 0.078 0.346 -0.112 0.016 0.523 0.783 -0.069 0.371 -0.735
0.206 99.831 -0.059 -1.242 2.101 -0.321 -2.119 -0.010 0.186 0.437 -0.576
The values1,2 and3correspond to the first, second and third discarded variables respectively
Table 5 - Clustering before discarding variables (nine characteristics for all potentials), and after discarding variables (seven characteristics for the potential of 0,0 MPa, and six characteristics for the potentials of -0.3 and -0.6 MPa) based on morphological characteristics, by the Tocher optimisation method, in 13 bean genotypes during seed germination under osmotic potentials of 0.0, -0.3 and -0.6 MPa in a solution of NaCl
0.033 100.000 -0.009 0.056 2.273 0.107 -2.208 -0.121 -0.006 0.072 -0.095
90.302 79.897 1.173 -0.218 ---- -0.509 -0.049 -0.534 0.378 0.372 0.536
13.421 91.772 0.135 -0.002 ---- 1.044 -0.501 0.320 0.123 -0.604 0.441
4.026 95.334 0.099 -0.037 ---- 0.083 0.913 -0.555 0.373 -0.495 0.512
2.437 97.491 -0.202 -0.109 ---- -0.890 0.136 0.026 0.338 1.297 -0.107
1.468 98.789 -0.032 -0.051 ---- 0.686 -0.039 -0.486 0.186 1.230 -1.734
1.084 99.749 0.075 0.310 ---- 0.012 0.409 0.781 -0.071 0.402 -0.767
0.165 99.895 -0.017 0.035 ---- -0.029 -0.020 -0.473 1.111 -0.549 -0.029
0.119 100.000 0.032 1.046 ---- 0.321 0.052 -0.277 0.314 -0.510 0.361
86.905 79.439 1.164 ---- ---- -0.429 -0.025 -0.527 0.420 0.257 0.564
13.421 91.707 0.135 ---- ---- 1.045 -0.501 0.320 0.123 -0.605 0.442
4.022 95.383 0.102 ---- ---- 0.098 0.918 -0.554 0.380 -0.519 0.519
2.415 97.591 -0.193 ---- ---- -0.863 0.163 0.038 0.365 1.246 -0.088
1.465 98.930 -0.028 ---- ---- 0.693 -0.020 -0.466 0.199 1.231 -1.748
1.005 99.849 0.067 ---- ---- -0.083 0.373 0.846 -0.183 0.481 -0.791
0.165 100.000 -0.018 ---- ---- -0.040 -0.021 -0.462 1.100 -0.532 -0.042
78.236 78.363 1.116 ---- ---- -0.402 -0.088 -0.269 ---- 0.307 0.539
13.298 91.682 0.147 ---- ---- 1.053 -0.534 0.396 ---- -0.590 0.445
3.714 95.402 0.154 ---- ---- 0.245 0.852 -0.345 ---- -0.694 0.602
2.192 97.598 -0.147 ---- ---- -0.886 0.298 0.259 ---- 1.106 0.199
1.419 99.019 -0.028 ---- ---- 0.606 0.065 -0.291 ---- 1.434 -1.756
0.979 100.000 0.068 ---- ---- -0.101 0.341 0.775 ---- 0.263 -0.688
Table 4 Continued
The effect of multicollinearity on clustering in the bean hinders the true formation of groups
(CARGNELUTTI FILHO et al., 2009), the effect
being more expressive under salt stress (-0.3 and -0.6 MPa). Grouping of the bean genotypes by the Tocher optimisation method differed only under conditions
of severe and weak multicollinearity. However, under non-stress conditions, multicollinearity did not change the grouping (Table 5); this can be explained by the lower number of discard cycles required to reduce the multicollinearity, due to the weaker relationship between the evaluated characteristics (Table 1).
---*Before discarding--- ---**After
discarding---Group Genotype Group Genotype
0.0 MPa
1 G2 G7 G8 G13 G6 1 G2 G7 G8 G13 G6
2 G1 G4 G11 2 G1 G4 G11
3 G3 G12 3 G3 G12
4 G5 G9 4 G5 G9
*Presence of severe multicollinearity. The osmotic potential under study displayed the characteristics: TW; MGT; G; NS; PL; HL; RL; SDW; RDW; ** Presence of weak multicollinearity. The characteristics maintained were: for the osmotic potential of 0,0 MPa: TW, MGT, NS, HL, RL, SDW and RDW; for the osmotic potential of -0,3 MPa: TW, MGT, G, HL, RL and RDW; and for the osmotic potential of -0,6 MPa: TW, NS, PL, HL, SDW and RDW
For the osmotic potentials of 0.0, -0.3 and -0.6 MPa, five, seven and five groups were formed respectively in the absence of multicollinearity (Table 5). Results obtained for the different osmotic potentials reinforce the idea of the need to study the clustering of genotypes for a wide range of saline environments. According to Almeidaet al. (2011),
similar results to those obtained in this study were found,
where the grouping of genotypes of Vigna unguiculata
was altered during plant development in different saline environments, due to the phenotypic responses varying greatly from one environment to another.
The genotype pairs, G1 and G4, and G6 and G13, remained together for all osmotic potentials (with and without multicollinearity), showing them to be the least dissimilar genotypes (Table 5). Those genotypes that formed groups with a high index of dissimilarity can be evaluated as promising parents in artificial crosses to obtain segregating populations and identify transgressive
genotypes (BERTINIet al., 2010).
CONCLUSIONS
1. The method of discarding variables using canonical variables is effective in reducing multicollinearity, with the number of discarded descriptors of physiological quality being higher for potentials of -0.3 and -0.6 MPa;
-0.3 MPa
1 G2 G8 G13 G6 1 G2 G8 G7
2 G1 G4 G10 2 G6 G13
3 G3 G12 3 G1 G4
4 G5 4 G9 G12
5 G9 5 G3 G5
6 G7 6 G11
7 G11 7 G10
-0.6 MPa
1 G3 G9 G5 G6 G13 1 G3 G9 G5 G6 G13
G8
2 G1 G4 2 G1 G4 G11
3 G8 G11 3 G7 G10
4 G7 G10 4 G2
5 G2 5 G12
6 G12
Table 5 Continued
2. The clustering of common bean genotypes is modified under conditions of severe and weak multicollinearity, but only under conditions of salt stress.
ACKNOWLEDGEMENTS
The authors wish to thank the Coordination for the Training of Personnel in Higher Education (CAPES/ REUNI), the National Council for Scientific and Technological Development (CNPq), and the Research Support Foundation of Espírito Santo (FAPES) for their encouragement and scholarships granted. The authors also thank the Agronomic Institute of Paraná (IAPAR) for the supply of seeds.
REFERENCES
ALMEIDA, W. S.et al. Identificação de genótipos de
feijão-caupi tolerantes a salinidade avaliado por meio de método multivariado. Ciência Rural, v. 41, n. 11, p. 1884-1889, 2011.
ANDRÉO-SOUZA, Y.et al. Efeito da salinidade na germinação
de sementes e no crescimento inicial de mudas de pinhão-manso.
plants decreasing membrane leakage. African Journal of Agricultural Research, v. 7, n. 7, p. 1073-1086, 2012.
BAYUELO-JIMENEZ, J. S.; JASSO-PLATA, N.; OCHOA, I. Growth and physiological responses of Phaseolus species to
salinity stress. International Journal of Agronomy, v. 2012,
p. 1-13, 2012.
BEN-GAL, A. et al. Is osmotic potential a more appropriate
property than electrical conductivity for evaluating whole-plant response to salinity?Environmental and Experimental Botany, v. 65, n. 2, p. 232-237, 2009.
BERTINI, C. H. C. M.et al. Análise multivariada e índice de
seleção na identificação de genótipos superiores de feijão-caupi.
Acta Scientiarum. Agronomy, v. 32, n. 4, p. 613-619, 2010. BOURGAULT, M.et al. Effects of deficit irrigation and salinity
stress on common bean (Phaseolus Vulgaris L.) and mungbean
(Vigna Radiata) wilczek grown in a controlled environment.
Journal of Agronomy and Crop Science, v. 196, n. 4, p. 262-272, 2010.
BRASIL. Ministério da Agricultura, Pecuária e Abastecimento. Secretaria Nacional de Defesa Agropecuária. Regras para análise de sementes. Brasília, DF: MAPA : SNDA, 2009. 395 p.
CARGNELUTTI FILHO, A.et al. Agrupamento de cultivares de
feijão em presença e em ausência de multicolinearidade.Ciência Rural, v. 39, n. 9, p. 2409-2418, 2009.
COELHO, D. L. M. et al. Estresse hídrico com diferentes
osmóticos em sementes de feijão e expressão diferencial de proteínas durante a germinação.Acta Scientiarum. Agronomy, v. 32, n. 3, p. 491-499, 2010.
COMPANHIA NACIONAL DE ABASTECIMENTO.
Acompanhamento da safra brasileira: grãos: safra 2014/15. Brasília, DF: CONAB, 2015. v. 2, n. 5, 116 p.
CRUZ, C. D. GENES-a software package for analysis in experimental statistics and quantitative genetics. Acta Scientiarum. Agronomy, v. 35, n. 3, p. 271-276, 2013. CRUZ, C. D.; REGAZZI, A. J. Modelos biométricos aplicados ao melhoramento genético. 2. ed. rev.. Viçosa,
MG: UFV, 2001. 390 p.
CRUZ, C. D.; REGAZZI, A. J; CARNEIRO, P. C. S.Modelos biométricos aplicados ao melhoramento genético. 4. ed.
Viçosa,MG: UFV, 2012. 514 p.
FOOD AND AGRICULTURE ORGANIZATION, 2013. Disponível em: <http://faostat3.fao.org/faostat-gateway/go/to/ download/Q/QC/E>. Acesso em: 04 ago. 2014.
HADŽI , A.et al. Energy and nutritional value of raw grains
of domestic bean varieties.Agroznanje, v. 14, n. 1, p. 51-58, 2013.
HERNÁNDEZ-LUCERO, E.et al. Differential expression of genes for tolerance to salt stress in common bean (Phaseolus vulgaris L.).Plant molecular biology reporter, v. 32, n. 2, p. 318-327, 2014.
JOST, E.et al. Efeitos gênicos do teor de cálcio em grãos de
feijão.Ciência Rural, v. 39, n. 1, p. 31-37, 2009.
KHADRI, M.; TEJERA, N. A.; LLUCH, C. Sodium chloride– ABA interaction in two common bean (Phaseolus vulgaris)
cultivars differing in salinity tolerance. Environmental and Experimental Botany, v. 60, n. 2, p. 211–218, 2007.
LABOURIAU, L. G.A germinação de sementes. Washington:
OEA, 1983. 174 p.
MACHADO, R. et al. Efeito da salinidade em características
físico-hídricas em solos salino-sodilizados no perímetro irrigado Jabiberi-SE.Revista Brasileira de Agricultura Irrigada, v. 1, n. 1, p. 15-19, 2007.
MESQUITA, J. B.; MARINO, R. H. Micoflora de sementes de feijão comum (Phaseolus vulgaris L.) provenientes do
Estado de Sergipe.Revista Brasileira de Ciências Agrárias,
v. 4, n. 3, p. 252-256, 2009.
MONTGOMERY, D. C.; PECK, E. A.Introduction to linear regression analysis. New York: J. Wiley, 1981. 504 p.
PEDROSA, M. M. et al. Effects of industrial canning on the proximate composition, bioactive compounds contents and nutritional profile of two Spanish common dry beans (Phaseolus vulgaris L.).Food Chemistry, v. 166, p. 68-75, 2015.
PIMENTA, J. A. Relações hídricas. In: KERBAUY, G. B. (Ed.). Rio de Janeiro: Guanabara Koogan, 2004. cap. 1, p. 1-39.
PLANS, M.et al. Characterization of common beans (Phaseolus vulgaris L.) by infrared spectroscopy: comparison of MIR, FT-NIR and dispersive FT-NIR using portable and benchtop instruments.
Food Research International, v. 54, n. 2, p. 1643-1651, 2013. RENCHER, A. C.Methods of multivariate analysis. Hoboken, NJ: John Wiley and Sons, 2003.738 p.
ROSA, S. S.et al. Potential for increasing the zinc content in
common bean using genetic improvement.Euphytica, v. 175, n. 2, p. 207–213, 2010.
ROSALES, M. A. et al. Physiological analysis of common
bean (Phaseolus vulgaris L.) cultivars uncovers characteristics
related to terminal drought resistance. Plant physiology and biochemistry, v. 56, p. 24-34, 2012.
SAEIDI-SAR, S.et al. Effects of ascorbic acid and gibberellin