Faculdade de Ciências
Departamento de Física
Improving resolution for the Siemens 3T
MR-BrainPET
Melissa Raquel da Silva Botelho
Dissertação
Mestrado Integrado em Engenharia Biomédica e Biofísica
Perfil em Radiações em Diagnóstico e Terapia
Faculdade de Ciências
Departamento de Física
Improving resolution for the Siemens 3T
MR-BrainPET
Melissa Raquel da Silva Botelho
Dissertação orientada pela Doutora Liliana Caldeira e Professor
Doutor Nuno Matela
Mestrado Integrado em Engenharia Biomédica e Biofísica
Perfil em Radiações em Diagnóstico e Terapia
“Se vi melhor e mais longe, foi por me ter apoiado sobre ombros de gigantes…”
i
R
ESUMO
A tomografia por emissão de positrões (acrónimo em inglês: PET) consiste numa técnica imagiológica não invasiva que permite obter informação in vivo sobre a distribuição espácio-temporal das moléculas. Antes da aquisição de imagem é necessário que um radiofármaco seja administrado ao paciente para que posteriormente este se distribua ao longo do corpo de acordo com a estrutura química e a fisiologia da pessoa. O PET é uma modalidade de imagem médica que se destaca pela aquisição de informação fisiológica. No entanto a informação anatómica fornecida por esta técnica é bastante escassa. Para contrariar esta limitação foi proposta a fusão do PET com outra modalidade que permitisse este tipo de informação: tomografia computorizada (acrónimo em inglês: CT) ou ressonância magnética nuclear (acrónimo em inglês: MRI). Inicialmente a fusão das duas imagens médicas não permitia a aquisição simultânea, baseando-se no co-registo das imagens adquiridas. Contudo, devido a vários erros causados pelas diferenças no posicionamento do paciente, foi proposto o desenvolvimento de sistemas híbridos que permitem a aquisição simultânea das diferentes imagens. Em 1998 foi proposto o primeiro sistema hídrico (com PET), PET/CT. Como técnicas de CT envolvem radiação ionizante e apresentam um reduzido contraste entre os tecidos moles, o PET/CT foi recentemente substituído por PET/MRI, permitindo a conjugação de informação molecular do PET com informação anatómica, funcional e estrutural da MRI. No entanto, esta fusão apresentou algumas dificuldades, como por exemplo os detetores e a eletrónica do PET serem sensíveis aos campos magnéticos da MRI. Entretanto foram desenvolvidos os fotodíodos de avalanche (acrónimo em inglês: APD) permitindo a construção dos sistemas híbridos PET/MRI. O BrainPET foi o primeiro sistema híbrido de PET/MRI, existindo apenas quatro scanners em todo o mundo. O scanner 3TMR-BrainPET, desenvolvido pela Siemens Medical Solution Inc., foi construído para imagiologia cerebral. Este scanner permite a aquisição de imagens PET com alta resolução (3 mm).
Alguns exames médicos como o PET apresentam uma aquisição muito longa (aproximadamente 1 hora), tornando-se difícil para o paciente permanecer imóvel durante toda a aquisição. Por conseguinte, na maioria dos casos, o movimento torna-se inevitável, introduzindo artefactos na imagem e consequentemente degradando-a. Assim, torna-se fundamental corrigir este movimento para assegurar a qualidade ótima das imagens, oferecendo a perspetiva de melhorar o diagnóstico e o tratamento. Ao longo dos anos foram propostos diversos métodos de correção do movimento. Uns corrigem-no no domínio da imagem, corrigindo apenas o movimento entre as frames mas não o que ocorre dentro de cada uma delas, e outros no domínio dos eventos, em que a correção do movimento consegue ser mais precisa uma vez que é feita diretamente nos eventos adquiridos. No contexto PET/MRI, ambas as imagens, PET e MRI, podem ser utilizadas para estimar o movimento e posteriormente corrigi-lo.
ii
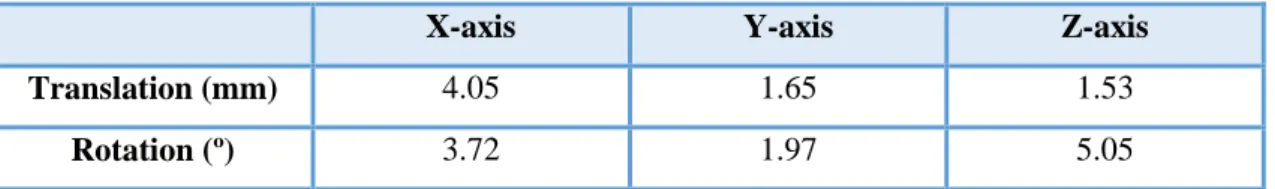
Nesta tese focar-nos-emos apenas na correção do movimento da cabeça que é considerado um movimento rígido e os parâmetros que o representam, três rotações e três translações de acordo com os três eixos Cartesianos (x, y e z), podem ser estimados utilizando algoritmos de registo de imagens. Este trabalho apresenta e testa um software de código aberto que dispõe desses algoritmos de dados multidimensionais, o Insight Toolkit (ITK), permitindo a estimação do movimento no domínio da imagem. O ITK já foi aplicado, com sucesso, em estudos de correções do movimento em modalidades técnicas de imagem, tanto para movimentos rígidos como deformáveis, que é o caso do movimento provocado pela respiração ou pelo batimento cardíaco. Relativamente à metodologia aplicada neste trabalho, inicialmente foram adquiridas imagens MPRAGE (imagens adquiridas com MRI) com o intuito de descobrir o alcance máximo do movimento da cabeça dentro das bobines do scanner. De seguida foram simulados quatro alcances diferentes: 1, 5, 10 e 30 de translação (mm) e de rotação (º) considerando os três eixos (x, y e z). Com o objetivo de testar a versatilidade do software, estas simulações foram realizadas em diversos tipos de imagens como, imagens clinicas, [18F]-FDG (imagem adquirida com PET) e EPI (imagem adquirida com MRI), e imagens de fantomas simulados, fantoma Utah e fantoma cerebral. Ao longo da dissertação foram realizados diversos estudos, como por exemplo, o estudo da influência da estatística de aquisição e do número de iterações do método de reconstrução de imagem na estimação do movimento. A estatística de aquisição influencia qualitativamente as imagens de PET, uma vez que quanto maior a estatística menor é o ruido. Ao mesmo tempo esta também é influenciada pelo número de iterações, visto que à medida que se aumenta o número de iterações o ruído da imagem aumenta, no entanto quando a imagem contém um número de iterações menor esta apresenta um bias maior. O ITK estima o movimento a partir de uma comparação de valores de intensidade das imagens, por conseguinte estas alterações qualitativas na imagem levam a diferentes estimações dos parâmetros do mesmo movimento simulado. Como um dos objetivos da tese consiste em verificar se o ITK pode ser utilizado para estimar o movimento no Instituto Forschungszentrum Juelich (FZJ), foram, adicionalmente, testadas imagens de cinco exames diferentes adquiridos rotineiramente no scanner 3TMR-BrainPET deste instituto.
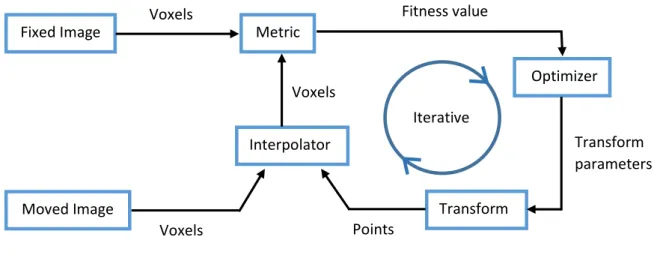
Em todas as imagens o movimento foi estimado utilizando o ITK. Este software apresenta um método iterativo para estimação do movimento. O ITK necessita de duas imagens de input, uma imagem fixa e uma imagem movida, enquanto o output deste software consiste em três translações e três rotações de acordo com os eixos cartesianos (transformada de Euler) que correspondem aos parâmetros do movimento rígido da cabeça. Ulteriormente, para corrigir esses movimentos, foram aplicadas transformadas inversas nas imagens afetadas pelo movimento. Estas transformadas podem ser aplicadas por outro programa, como por exemplo o PRESTO (PET REconstruction Software Toolkit), um software de reconstrução constituído por bibliotecas desenvolvidas em
iii
programação C++. Neste trabalho, utilizou-se o PRESTO para a aplicação das transformadas, na correção do movimento e na simulação dos fantomas e dos movimentos nas imagens.
Atualmente o FZJ utiliza um software diferente do ITK para corrigir o movimento, o PMOD (PMOD Technologies Ltd, Zurique, Suíça). No entanto este apresenta algumas limitações, como por exemplo, o facto de ser um software comercial e este não poder ser incorporado no script de reconstrução, sendo necessário um processo adicional trabalhoso, ao contrário do ITK que permite que a correção do movimento seja feita automaticamente durante a reconstrução, corrigindo o movimento diretamente nas linhas de resposta (acrónimo em inglês: LORs). Adicionalmente o PMOD requer um utilizador com conhecimento prévio sobre o software para conseguir manuseá-lo. Para confirmar a viabilidade do ITK e verificar se este pode substituir o PMOD na correção do movimento no instituto, foi feita uma comparação entre os resultados dos dois software. Os resultados obtidos revelaram-se muito semelhantes, exceto quando se utiliza imagens de PET com baixa estatística ou imagens com grandes movimentos.
Como as imagens sem correção de atenuação apresentam maior diferença de intensidades entre as fronteiras do objeto em estudo e o fundo da imagem, pensou-se na hipótese de os parâmetros do movimento obtidos pelo ITK ou pelo PMOD poderem apresentar erros menores utilizando imagens sem correção de atenuação. Ao mesmo tempo, como a correção do movimento atualmente no instituto está a ser realizada depois da reconstrução, um mapa de atenuação errado (mapa que não considera o movimento) está a ser aplicado à imagem. Neste sentido, o impacto do mapa de atenuação aplicado às imagens afetadas pelo movimento foi também estudado nesta dissertação. Os maiores erros foram encontrados quando se utilizou imagens sem correção de atenuação. Os bons resultados do PMOD revelaram-se mais dependentes da aplicação do mapa de atenuação correto. Em conclusão o ITK apresentou melhores resultados que o PMOD e a diferença entre as três imagens testadas pelo ITK não se revelou muito significativa.
Com o objetivo de melhorar os resultados obtidos, três métricas diferentes do ITK (Mutual Information, Mean Squares e Normalized Correlation) foram comparadas entre si, aplicando diferentes imagens de PET e de MRI como input. Este teste mostrou que a métrica é um parâmetro altamente dependente do problema que se tenta resolver. A métrica mutual information é a melhor métrica para corrigir o movimento utilizando imagens de diferentes modalidades, enquanto a métrica normalized correlation é a melhor nos estudos com imagens da mesma modalidade. De acordo com todos os resultados obtidos, pode-se afirmar que o ITK é um método viável para a estimação dos parâmetros do movimento rígido e tem capacidades de substituir o PMOD. Esses parâmetros, posteriormente, podem ser utilizados para a correção do movimento no pós-processamento de imagens de PET ou MRI.
iv
A
BSTRACT
The Siemens 3TMR-BrainPET scanner is a hybrid system which allows simultaneous acquisition of MRI and PET. There are medical exams that have long acquisition time and then it is inevitable introducing blurring in images. Therefore motion correction strategies are mandatory. In PET/MRI context, both PET and MRI images can be used for this purpose. Head motion is considered as rigid motion and the motion parameters can be estimated with image registration algorithms. In this thesis a software which has available these algorithms, Insight Toolkit (ITK), will be presented and tested. First MPRAGE images were acquired to check the maximum motion range inside the scanner head coil during acquisition. Therefore four motion ranges were simulated in translation and rotation with respect to the three Cartesian axes. Testing the software versatility, these simulations were realized in different images: simulated and clinical data. Several studies were made with these images e.g. the influence of statistics and number of iterations in motion estimation. Additionally images from five different exams performed in FZJ were also used. The motion was estimated by ITK. The ITK output is three translations and three rotations which correspond to the rigid motion parameters. Subsequently, to correct the motion, inverse transformations were applied in moved images. Actually FZJ uses other software, PMOD (PMOD Technologies Ltd, Zurich, Switzerland) to motion correction. For the purpose of confirm the viability of ITK and to verify if it can replace the PMOD, ITK results were compared with PMOD results. Other tests were made with the aim to improve the results such as study the impact of the attenuation map in motion estimation and the comparison between ITK results using three different metrics. According to results, ITK is a viable method of motion parameter estimation which can be used for PET or MRI post-processing motion correction.
vi
A
CKNOWLEDGEMENTS
I would like to express my gratitude for those that made this work possible.
Primary I want to express a special thanks to Professor Shah to give me the opportunity to work in INM-4 at Forschungszentrum Juelich and to participate in all the PET and MRI meetings. Secondly I would like to express my deepest gratitude to my external supervisor, Liliana Caldeira, for all contributions of ideas, all dedicated time to my work and for help me to participate in three conferences and in my first training school PET/MR.
I also wish to thank to my intern supervisor, Nuno Matela, for his regular feedback even far away and for providing the contact with the PET group at the Forschungszentrum Juelich.
I am extremely grateful to Dr. Elena Rota Kops and Dr. Jürgen Scheins for all your support, interesting discussions and reviews of my work. I also wish to thank to Lutz Tellmann for all the provided data and suggestions.
I also have to refer others workers of INM-4 at Forschungszentrum Juelich, Nuno Silva, Philipp Lohmann, Christoph Weirich and Michaela Gaens for all the friendly talks during the lunch and for all the fun activities outside of work.
I would like to thank Udo Koehl and his family for all the care and help in my integration at Germany.
I am grateful to all my family, especially to my grandparents, my parents and my sister for all the love and encouragement that they have given me over all the years.
A special thanks to my boyfriend, Pedro Fonseca, for all the love and support during these five years, for his presence in Aachen (Germany) to cheer me up and for his incentive during all 7 months of internship.
I could not forget my colleagues of MIEBB, especially Rita Gigante, Tiago Martins, Danielle Baptista, Mauro Sousa, David Soares and Vasco Verissímo, thanks for your moral support and encouragement. At the same time I want to express thanks to others friends from FCUL for all the great times during these five years. I would also like to thank to my old friends, particularly, Inês Borges for the visit at Aachen giving me some days of fun, and Silvia Almeida for all the help and interest in my work. Finally I would like to thank my friend Ana Morgado for sharing the apartment with me and put up with me during 7 months.
viii
Contents
Resumo ... i
Abstract ... iv
Acknowledgements ... vi
List of Abbreviations ... xii
1. Introduction ... 1
1.1. Context ... 1
1.2. Thesis objectives and outline ... 2
2. Hybrid medical systems ... 4
2.1. Position Emission Tomography ... 4
2.1.1. Basic Principles ... 5
2.1.2. Events detected in PET ... 6
2.1.3. Data correction ... 7 2.1.3.1. Normalization Correction ... 7 2.1.3.2. Attenuation Correction ... 8 2.1.3.3. Scatter Correction ... 9 2.1.3.4. Random Correction ... 9 2.1.3.5. Motion Correction ... 10
2.1.3.6. Partial Volume Correction ... 10
2.1.4. Image Reconstruction ... 11
2.2. Magnetic Resonance Imaging ... 13
2.2.1. Basic Principles ... 13 2.2.2. Image Principles ... 16 2.2.3. Image Sequences ... 17 2.3. PET/MRI ... 19 2.3.1. Design Difficulties ... 20 3. Motion Correction ... 22
3.1. Image domain motion correction approaches ... 23
3.2. Event domain motion correction approaches ... 24
4. Materials and Methods ... 27
4.1. Equipment ... 27
4.1.1. 3TMR-BrainPET scanner ... 27
ix
4.2.1. PRESTO ... 29
4.2.1.1. Generic Cylinder Model ... 31
4.2.2. ITK ... 32
4.2.2.1. ITK metrics ... 33
4.2.2.2. Motion Correction using ITK ... 35
4.2.3. PMOD ... 36
4.2.3.1. Motion Correction using PMOD ... 37
4.2.4. AMIDE ... 38
4.3. Data ... 38
4.3.1. MPRAGE images ... 38
4.3.2. Utah phantom ... 39
4.3.3. Brain phantom ... 40
4.3.4. FDG and EPI clinical images ... 43
4.3.5. Patient images ... 44 4.4. Performed Tests... 45 4.4.1. Volunteer MPRAGEs ... 45 4.4.2. Simulated data ... 47 4.4.2.1. Evaluation of estimation ... 47 4.4.2.2. Influence of statistics ... 47
4.4.2.3. Influence of number of iterations ... 48
4.4.2.4. Estimation using PET and/or MR images ... 48
4.4.2.5. Choice of reference frame ... 49
4.4.2.6. Choice of metrics ... 49
4.4.2.7. Comparison of PMOD and ITK ... 49
4.4.2.8. Influence of attenuation map ... 50
4.4.3. Acquired data ... 50
5. Results and Discussion ... 51
5.1. Volunteer MPRAGEs ... 51
5.2. Simulated data ... 58
5.2.1. Influence of statistics ... 62
5.2.2. Influence of number of iterations ... 71
5.2.3. Estimation using PET and/or MR images ... 73
5.2.4. Choice of reference frame ... 77
5.2.5. Choice of metrics ... 82
5.2.6. Comparison PMOD and ITK ... 86
5.2.7. Influence of attenuation map ... 90
x
6. Conclusion and Future work ... 99
Appendix: Posters in Conferences ... 101
List of Figures ... 102
List of Tables ... 107
xii
L
IST OF
A
BBREVIATIONS
[11C]-Flumazenil Ethyl 8-fluoro-5-methyl-6-oxo-5,6-dihydro-4H-benzo[f]imidazo[1,5-a][1,4]diazepine-3-carboxylate
[11C]-Raclopride 3,5-dichloro-N-{[(2S)-1-ethylpyrrolidin-2-yl]methyl}-2-hydroxy-6-methoxybenzamide
[18F]-FDG [18F]-Fluor-Deoxy-Glucose
[18F]-FET O-(2-[18F]-Fluorethyl)-L-tyrosin
[15O]-Water Oxygen-15 Water
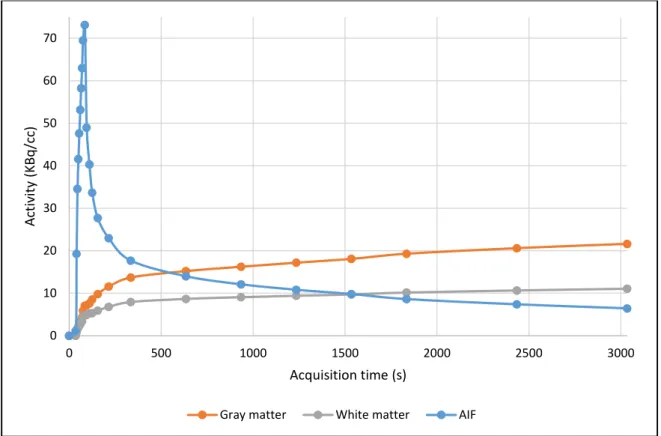
AIF Arterial Input Function
AMIDE Amide’s Medical Image Data Examiner
APD Avalanche Photodiodes
ASIC Application-Specific Integrated Circuit
BGO Bismuth Germanate
CSF Cerebrospinal Fluid
CT Computed Tomography
DICOM Digital Imaging and Communications in Medicine
EPI Echo Planar Imaging
FBP Filtered Backprojection
FID Free Induction Decay
FLASH Fast Low Angle SHot
fMRI Functional Magnetic Resonance Imaging
FOV Field of View
FZJ Forschungszentrum Juelich
GE Gradient-Echo
GM Gray Matter
GMC Generic Cylinder Model
ITK Insight Toolkit
LOR Line of Response
LSO Lutetium Oxyorthosilicate
MC Motion Correction
MAF Multiple Acquisition Frames
MAP Maximum a posteriori
xiii
MOLAR Motion-compensation OSEM List-mode Algorithm for Resolution
Recovery Reconstruction
MPRAGE Magnetization Prepared Rapid Gradient Echo
MR Magnetic Resonance
MRI Magnetic Resonance Imaging
MT Motion Tracking
NAW-OSEM Normalization Attenuation Weighted - Ordered Subset Expectation Maximization
NDI Northern Digital Ins.
NIH National Institutes of Health
NLM National Library of Medicine
NMR Nuclear Magnetic Resonance
OPOSEM Ordinary Poisson Ordered Subset Expectation Maximization
OSEM Ordered Subsets Expectation Maximization
PET Positron Emission Tomography
PMT Photomultiplier Tube
PRESTO PET REconstruction Software Toolkit
PSF Point Spread Function
PVC Partial Volume Correction
PVE Partial Volume Effect
RF Radio Frequency
ROI Regions of Interest
SE Spin-echo
Si APD Silicon Avalanche Photodiode
Si PM Silicon Photomultiplier
SPECT Single-Photon Emission Computerized Tomography
SNR Signal-to-Noise Ratio
TE Echo Time
TI Inversion Time
TOF Time-of-Flight
TOR Tube of Response
TR Repetition Time
UTE Ultrashort Echo Time
1
CHAPTER 1
1.
Introduction
The introduction is divided in two sections. In the first the summarised context of the thesis work is presented and in the second section aim and outline of the thesis are described.
1.1. Context
PET exam provides biochemical and metabolic information however it does not provide detailed anatomical information. Therefore this exam benefits from a fusion with other modality with morphological image information, such as CT, allowing higher diagnostic value than separate modalities (Herzog et al. 2010). Recently MR came to replace CT in this context, hybrid PET/MRI scanners have become commercially available with potential to change medical imaging, especially in cancer area, providing image information with very high resolution. Comparing with CT, MR presents more anatomical capabilities and better soft tissue contrast. The Siemens 3T MR-BrainPET scanner is a hybrid system for simultaneous acquisition of MRI and PET providing PET images with high resolution (3 mm) (Scheins et al. 2013). Generally PET exams have long acquisition time and because of that the probability of motion during the acquisition is very large, especially for children or patients suffering from medical condition that keeps them from staying still. Motion introduces blurring, distortion and artifacts on acquired images, degrading the achievable image quality in brain images. Because of the motion the image quality can be below acceptable levels for clinic diagnostic for both static and dynamic PET. Therefore the patient diagnostic can be adulterate due to a simple and small motion during the acquisition. Consequently it is fundamental to be able to correct the motion to ensure a precise diagnostics, mainly when the magnitude of motion is substantial in comparison to the image resolution (Jin et al. 2013). One method to try to avoid the motion consisted on the use of restraining devices, however even using it, the head motion cannot be sufficiently reduced to eliminate the image degradation. Other approach is the administration of anesthesia but it is
2
expensive and commits the patient safety (Maclaren et al. 2013). Therefore, strategies of motion correction (MC) are the best choice to prevent significant quantitative errors in PET images. Several methods have been proposed to solve the head motion problem. Most of them consider the head motion as a rigid motion with six degrees of freedom, three rotations and three translations along the Cartesian system (Jin et al. 2013) (Qin et al. 2009). Estimating these parameters the effect of motion on the image data could be compensated.
Some software provide the motion correction after the reconstruction of the images (e.g. PMOD (Menda et al. 2009)). PMOD is considered the reference tool for PET tracer characterization in Forschungszentrum Juelich (FZJ), but it does not allow to correct for motion the attenuation correction map and to use this corrected map for reconstruction (Multiple Acquisition Frame method). Furthermore motion correction after the reconstruction introduce interpolation effects leading to resolution degradation and possibly artifacts (Gravel et al. 2013). Another proposed method is to include the motion correction in the reconstruction process (Ullisch et al. 2013). Here the lines-of-response (LORs) are individually corrected by applying spatial transformations in list-mode data. For that, PET data can be segmented into frames (discrete parts of similar head positions). Now, it is important to find an automatic motion estimation method that can be easily included in the clinical framework. In this context, Insight Toolkit (ITK) can be used for motion estimation. ITK is an open-source image registration software toolkit that employs algorithms for registering multidimensional data and without the use of tracking devices or markers. After the motion being estimated its correction can be achieved by applying the inverse transformation on moved images, in which each movement of the patient’s head has an individual transformation. These inverse transformation have to be applied by a different software such as PRESTO. ITK is a software already used for image registration such as in motion estimation (Akbarzadeh et al. 2013) (Rao et al. 2005).
1.2. Thesis objectives and outline
The overall purpose of the thesis is to evaluate if the ITK can be used to estimate the motion of images acquired by the Siemens 3TMR-BrainPET scanner, i.e. PET and MR images. The motivation of this work is to verify if ITK is able to replace PMOD, software used to correct the motion at FZJ. Comparing with PMOD, ITK has the advantages of it can be implemented in the reconstruction script, therefore the LORs with motion can be corrected during the reconstruction. Therefore an additional step is not required contrary to PMOD. ITK is also an open-source software unlike PMOD.
3
The thesis report is organized in six chapters. The first chapter introduces the context, aim and organization of the thesis. The second chapter describes different image modalities and it is subdivided on four sections: hybrid systems, Positron Emission Tomography (PET), Magnetic Resonance Imaging (MRI) and PET/MRI. It begin with a resume of hybrid systems and then on a section dedicated to PET, the basic principles, data acquisition and correction and image reconstruction are described. In the other section, the basic and image principles of MRI modality are presented and the image sequences briefly described. In the multi-modalities section the advantages, design difficulties, and applications of the PET/MRI system are presented. On the third chapter the state-of-art of PET motion correction i.e. strategies described on the literature to correct the motion are discussed. In fourth chapter the material used in this work, equipment, software and data, is described. At the same time, this chapter also describes a summary of the performed tests developed in the thesis. In chapter five the results and the respective discussion of all performed tests, described in the previous chapter, are presented. Chapter six includes the overall thesis conclusion and future work. Finally in the appendix an enumeration of conference posters made with this work are listed.
4
CHAPTER 2
2.
Hybrid medical systems
In the last few decades there has been an increasing interest in multimodal imaging, especially in the field of nuclear medicine. Hybrid systems allow simultaneous acquisition (intrinsically align multi-modality image information within a single exam) of two modalities and besides integrating the strength of modalities also eliminate some weaknesses of the individual modality. Dual-modality imaging systems have been introduced in 1990 by Hasegawa et al. with the combination of single photon emission computed tomography and computed tomography (SPECT/CT) (Tellmann et al. 2011). Here the axial displacement between the CT and SPECT imaging fields are taken into account in images coregistration. An example of SPECT/CT system is shown in Figure 2. 1. In 1998, a prototype system combining PET and CT within a single gantry was presented. However the commercial PET/CT systems only became available in 2001 (Townsend 2008) (see Figure 2. 2). These scanners had such a successful impact that is now almost impossible to buy a PET scanner without an integrated CT scanner (Cherry 2009). PET/CT is now the clinical standard.
Figure 2. 1: Modern hybrid SPECT/CT scanner which incorporates multidetector CT (Hicks et al. 2007).
Figure 2. 2: The first commercial PET/CT scanner to become available. Both CT and PET components operated on independent computer platform (Hicks et al. 2007).
3
The several advantages of PET/CT in oncological imaging is attracting more interest on bimodal imaging modality. Recently an alternative to PET/CT was presented, PET/MR. The first attempts of simultaneous MRI and PET imaging was reported more than 15 years ago by Simon Cherry's group (Yiping Shao et al. 1997). Comparing with PET/CT, PET/MR provides high spatial resolution (anatomical, functional and molecular imaging) and high soft tissue contrast, and a significant reduction on radiation exposure to patients. At the same time, allows different applications from functional imaging (fMRI), spectroscopy, diffusion imaging and perfusion imaging. PET/MRI also provides shorter acquisition times and allows exact spatial and temporal images coregistration (Weirich et al. 2012). Contrary to PET/CT, PET/MRI has a simultaneous acquisition and therefore the patient does not have to be repositioned for the two acquisitions. The MR information can then be used to identify, stage, and predict several diseases, such as neurodegenerative disorders and cardiovascular disease (Daftary 2010) (Schwenzer et al. 2012).
Successful tests of a 3T MR-BrainPET prototype, developed by Siemens Healthcare (Erlangen, Germany) (see
Figure 2. 3) for simultaneous PET/MRI human brain studies, were performed (Schmand et al.
2007) (Schlemmer et al. 2008). Recently the first integrated hybrid MR-PET scanners for whole-body imaging have been installed (Weirich et al. 2012).
Figure 2. 3: The whole-body PET/MRI hybrid system (Biograph mMR) developed by Siemens Healthcare (www.siemens.com/press/photo/SOH201002-14e).
In the following sections PET, MRI and PET/MRI modalities are individually described in more detail.
4
2.1. Position Emission Tomography
Positron emission tomography (PET) is a powerful nuclear imaging technique that allows measurement of physiological and biochemical processes in vivo using a radiotracer in the body (Bendriem & Townsend 1998). PET provides many physiological information which only would be available with surgeries or more expensive exams. Therefore this modality allows early abnormalities detection in the function or structure of organs, enabling treatment in initial stages and therefore it increases the probability of patient recovery. Before the data acquisition, a radiopharmaceutical or radiotracers is administered to the patient, in a small amount, by inhalation, deglutition or mainly intravenously. The injected patient dose has an optimum value, if is too low there will not be sufficient data for statistics calculations and the image will not represent the true tracer distribution. On the other hand, if the dose is too high it can be dangerous for the patient.
Radionuclides (unstable isotopes) are chemically incorporated into a biological molecule which subsequently will be involved in a metabolic process. This is distributed throughout the body according to the chemical structure of substrate-radionuclide complex which has different tissues affinities. Therefore the choice of radiopharmaceutical will depend on the desired study. The radioactive material concentrates in areas that have high levels of chemical activity that typically correspond to areas of disease. The positron-emitting radionuclides used in PET scanning are typically isotopes with relatively short physical half-lifewhich can be produced mainly in a cyclotron. PET radiopharmaceuticals are based on four major radioisotopes: Carbon (11C), Nitrogen (13N), Oxygen (15O) and Fluorine (18F) (Zimmer & Luxen 2012). Their half-life time are: 20.4 min, 9.96 min, 2.07 min and 109.8 min respectively. The first three can only be used to study rapid uptake processes while the last one allows imaging of longer physiologic processes. Currently, the most widely used PET tracer is fluorodeoxyglucose (FDG or also called fludeoxyglucose and fluorine-18 labeled), an analogue of glucose.
In 1928, the existence of the positron was postulated by Paul AM Dirac, however it only was proved in 1932 by Carl Anderson (Olesen 2011). Both received the Nobel Prize in physics. The first PET scanner used for studies with phantoms was built in the 1970s by Ter-Pogossian, while the first camera for human studies (also called PET camera) was built in 1974 by Phelps and Hoffman (Suetens 2009). In 1977 the first whole-body PET scanner appeared. Currently, there are PET scanners with septa to fully 3D scanners and, in more modern systems, a higher time resolution is possible, using a technique called Time-of-Flight (TOF). With the development of new techniques and methods of acquisition and the use of analytical and iterative reconstruction algorithms it is possible to improve the resolution and sensitivity, making this technique more
5
generally used. Today PET exams have applications in several areas such as oncology, neurology, cardiology, development of drugs and new tracers.
2.1.1.
Basic Principles
Searching stability, radionuclides emit positrons (antimatter equivalent of the electron) due to neutron radioactive decay (beta decay), making it possible to measure the concentration of the radiotracer during the observation period. The positron travels in the tissue for a short distance (few millimeters), also called positron range, which depends on the energy of the isotope. During this time it loses kinetic energy, slowing down and then it interact with an electron. The encounter annihilates the electron and the positron, converting their masses into a pair of annihilation photons of 511 keV moving in approximately opposite directions.
If the positron is at rest, due to conservation of momentum and energy, the photons would be emitted at an angle of 180° and then detected by opposing detectors. The angular deviation from 180 º (± 0.5 °) is known as non-collinearity and it is independent of the radionuclide. Figure 2. 4 shows a basic physics scheme of PET.
Figure 2. 4: Basic physics of Positron Emission Tomography (van der Veldt et al. 2013).
The annihilation photons are detected when they hit scintillation detectors which are made of scintillation crystals. These convert the photon energy in photons in the visible range, which are detected by, for example, photomultiplier tubes. Here the scintillation light is then converted into electrical current. The electrons are accelerated and amplified by a series of diodes. This is followed by an analogue/digital converter. Several scintillators can be used in PET, e.g. Bismuth Germanate (BGO) or Lutetium Oxyorthosilicate (LSO). In the scintillator choice, many material
6
properties should be considered, such as the decay constant, energy resolution, stopping power, among others.
The line connecting the two detectors that were hit by the annihilation photons is called line-of-response (LOR) or tube-of-line-of-response (TOR), depending on the model used for reconstruction and it is used to obtain the tomographic image.
2.1.2.
Events detected in PET
In reality, the annihilation photons are not detected simultaneously due to two main factors: time resolution of the detection system and the difference between the distance of the annihilation site and each detector (Mendes 2012). An event is recorded if the annihilation photons arrive within the user-defined time (usually 4-12 ns) and energy windows, if not they are ignored. At the same time the formed LOR has to be within a valid acceptance angle of the tomograph (Bailey 2005). These events are called prompt events.
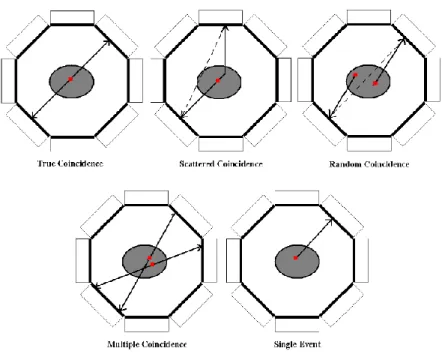
An event can be classified as: single, true, random, multiple and scatter. A single event occurs when only one photon of annihilation is detected. The true events are those corresponding to an ideal situation, i.e., the two annihilation photons are detected within the time window without interacting significantly with matter. Random events are detected, within the time window, simultaneously accidentally while the corresponding annihilation photon are not detected. Multiple events are produced when three or more photon, usually from two annihilations, are detected within the same coincidence time window. Usually these events are discarded (Bailey 2005). The scattered events are those in which one or both of annihilation photons change direction due to Compton scattering, introducing wrong LOR/TOR information and then deteriorating the image quality. The amount of these events depends on the object under study and the distribution of radioactivity. Figure 2. 5 shows the five PET events: true, scatter, random, multiple and single.
There are other events that are not even detected because the photon escapes the field of view (FOV) of the scanner or they are absorbed by the body (attenuated), resulting in loss of PET signal.
7
Figure 2. 5: PET events: True, scatter, random, multiple and single events (Mendes 2012).
2.1.3.
Data correction
The PET raw data can be store in two different ways: histogram or list-mode. Data correction is an essential step in or before the image reconstruction. This involves the motion, scattered (more than 35% in 3D mode) (Mourik 2009), attenuation and random events corrections. At the same time, factors relating to the scanner characteristics such as normalization and the partial volume effect, should also be taken in account on PET data reconstruction.
2.1.3.1. Normalization Correction
When there are changes in the detection efficiency of the different LORs, artifacts are introduced on reconstructed images, making impossible to recover quantitative information. However these can be compensated by the normalization coefficient. The scanner geometry and non-uniformity of the individual efficiencies of detectors are some causes that contribute to these effects. The first factor is observed in 3D acquisition mode, where not all voxels in space are crossed by the same number of LORs. The central voxels are crossed by a larger number of LORs, so they are more sensitive than the detectors on the edge of the scanner. The second factor occurs when some detectors have different efficiencies, i.e. considering the same acquisition, some detectors detect more counts than others.
8
An estimation of these factors can be obtained by two methods: direct measurements or components-based methods. The first uses a planar or rotating linear positron source with low activity avoiding dead time and pile-up effect. However this has the disadvantage that scans have to be long enough to obtain adequate counts per LOR (Bai et al. 2002). In the second method the coincidence detection efficiencies of a detector pair are modelled as a product of factors that can be measured (Guerreiro et al. 2009) independently. At the FZJ the normalization data is derived from a rotational plane source (Oakes et al. 1998).
2.1.3.2. Attenuation Correction
The Attenuation effect can be described by Beer's law (Zeng 2010). Here a fraction of the photons do not cross through the object under study. This occurs because the annihilation photons interact with matter primarily through Compton interactions resulting in a decrease in photon energy (increase in wavelength) or through photoelectric effect. Attenuation depends on the photon energy, the electron density and atom number of the absorber. As attenuation is independent of the location of the annihilation along the LOR, it can be corrected by acquiring two scans of transmission, one without any object of study (black scan) and other with the object (Mourik 2009), providing the attenuation map or µ-map.
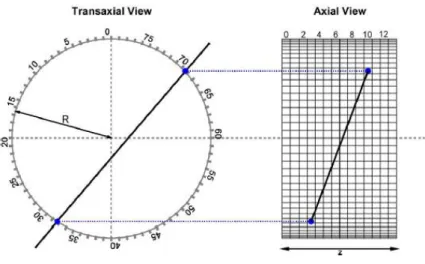
Each detector pair (and thereby each LOR) corresponds to a particular bin in the sinogram (where the PET data are stored) depending on its orientation angle and distance from the center of the gantry (Fahey 2002). Figure 2. 6 shows the sinogram formation of a brain scan. Attenuation correction factors are given by the ratio between sinograms of the two scans. This allows a precise estimation of the factors, but for that a long period of acquisition is required. Another approach to find the LOR attenuation is to use the source position and the position of the detector hit by the photon. Here a more active source can be used however this leads to an underestimation of the attenuation correction (Mendes 2012). In PET/CT scanners the anatomical images are used to measure the attenuation coefficients. Compared with the direct measurements, this method allows to obtain faster coefficients and with less noise. Disadvantages of this approach are the use of ionizing radiation, low contrast between soft tissues and the low CT data must be converted into a corresponding attenuation estimator of 511 keV. These disadvantages could be excluded using MRI instead of CT, however precise attenuation map defined by PET/MRI is still a research area. This is one of the design difficult of the hybrid system that are better explained in the PET/MRI section of this chapter.
9
Figure 2. 6: Sinogram formation of brain scan. (A) Four LORs labeled A, B, C and D pass through locus of interest which is noted by ellipse. Center of gantry is noted by a cross (X). (B) The LORs are plotted on a sinogram as function of angular orientation (y-axis) and displacement from center of gantry (x-axis). (C) Sinogram of brain scan and (D) Reconstructed brain image corresponding to sinogram in (C) (Fahey 2002).
2.1.3.3. Scatter Correction
The scattered photons lost some of their energy and changed their direction due to Compton scattering, resulting in erroneous LORs which give a wrong positioning of the annihilation site. Therefore dispersion also has a considerable impact on the image, degrading the quantitative accuracy of the image and reducing contrast. The amount of the scatter events depends on the object under study and the distribution of radioactivity. Three types of approach to the estimation of scattered events have been proposed: analytical approach (Cherry & Huang 1995), methods based on energy window (Ferreira et al. 2002), and simulation methods (Watson 2000) which can be done based on a model or using Monte Carlo methods. At the FZJ, in the BrainPET scanner, the scatter correction method is based on the single scatter simulation algorithm (Watson 2000).
2.1.3.4. Random Correction
Random coincidences result in loss of image contrast and they occur due to the width of the defined time window. The random coincidence rate increases with the square of activity, while the rate of true coincidences only increases linearly (Cherry et al. 2012). In order to correct
10
random events two methods may be considered, one which uses a single time window and the other that uses two time windows, called the delayed time window. The first method takes into account the rate of single counts for each detector pair and the width of the coincident time window. However this tends to overestimate the amount of random coincidences. The second approach assumes that prompt events are detected in a time window and the delayed window only measure random events and not true events. The delayed window is placed few ns after and it has the same width as the time window. These windows are used to correct the bias introduced by random events (Suetens 2009). There is a variance in the estimation of random coincidences and to reduce this, analytic (Defrise et al. 1991) and iterative (Panin et al. 2007) techniques using sinograms of delayed coincidences were proposed.
2.1.3.5. Motion Correction
In long acquisition exams, the patients cannot be still during the entire exam, introducing blurring on the images. The motion has to be corrected to achieve a good image quality. In order to prevent patient motion (non-physiological) locking devices may be used. However, they are very uncomfortable to patients and only reduce the motion. Movement tracking systems can be alternatively use, however the systems are not always available. Motion correction methods can be used to overcome these limitation. Some of these methods are described in chapter 3.
2.1.3.6. Partial Volume Correction
The Partial Volume Effect (PVE) degrades the image quality, introducing bias in the quantification. PVE does not cause any loss of signal, it shifts the signal from place and then burring the image. PVE refers to two phenomena: spatial resolution and image sampling grid of voxels (Soret et al. 2007). Because of the finite spatial resolution of a scanner, spill-in or spill-out effect of activity between adjacent regions can be observed. These effects are shown in Figure 2. 7. The second phenomenon is caused by the contours of voxels not matching the contours of the distribution of the tracer. Consequently, image voxels include different types of tissue. This is called tissue fraction effect. Even if a PET scanner had perfect spatial resolution, there is still some PVE due to voxels having finite size (image sampling).
PVE is combated by applying partial volume correction (PVC) methods, which can be sorted into two groups: the first is based on regions of interest (ROI), which uses anatomical information extracted from segmented MRI or CT images, and the second group consists in techniques based on voxels, which are applied to partition or multiresolution methods. An alternative to PVC is the resolution modelling (or point-spread-function, PSF), which allows modelling all phenomena that
11
degrade the resolution in the reconstruction algorithm (Rahmim et al. 2013). PVE complicates the motion estimation because this affects the accurate quantification in PET.
Figure 2. 7: Partial volume effect: spill-in and spill-out (Soret et al. 2007). Due to the spill-out effect the radioactivity of hot area spreads to the background, resulting in a smaller signal within a small structure. On the other hand, due to spill-in, a small structure with a low concentration (cold) that is positioned in a hot background becomes less cold radioactively because the hot area around spreads to it.
2.1.4.
Image Reconstruction
The aim of the reconstruction is to determine the relationship between the projection data (the total counts number which are detected along every LOR over the scan duration) and an image which represents the distribution of activity in the FOV. The quality of reconstructed images depends on an accurate model of this relationship (Panin et al. 2006). There are two types of reconstruction algorithms used in PET data processing: analytical and iterative. Analytical methods calculates the tracer distribution directly from the measured coincidences while iterative reconstruction methods estimate the tracer distributions that are iteratively compared to measured data and updated.
Analytical methods allow rapid reconstruction and easy control of the resolution and correlations of noise. Analytical reconstruction is based on a solution of the inverse Radon transform: with the projections along different angles from the sinograms it is possible apply the inverse Radon transform to determine an image from the distribution of activity in the FOV. This transformation is called backprojection. However this method introduces blurring and artifacts in the images. Therefore a high-pass filter is often applied leading to so-called filtered backprojection (FBP), which is a classic and standard algorithm of tomography (Olesen 2011). Analytical algorithms lost their popularity due to the rise of excellent computers available for image reconstruction. Iterative reconstruction methods are nowadays used in standard clinical practice. They are less sensitive to both detectors geometry and non-uniform resolution for the detectors. Therefore these
12
methods have improved the image quality (high resolution and the higher signal at regions of low counts) and allow the incorporation of a priori information about the distribution of activity. Figure 2. 8 shows the general model of the most iterative reconstruction algorithms. In iterative reconstruction methods, the process begun with some initial image estimate and then a projection step is applied, yielding a set of projection values. The estimated projection is compared with the acquired projection (measured sinograms) taking into account a given criterion. This comparison creates a set of projection-space error value and they are mapped back to the image space through a backproject operation, producing image-space error values. Finally the image estimate is updated using these error values and a new estimate is created. This process is repeated until the comparison criterion is satisfied. Each of these repetitions is called iteration. The contribution of each image voxel to each projection is described by a system matrix which can be calculated based on numerical integrations, Monte Carlo simulations or experimental measurements (Zhou & Qi 2011).
Figure 2. 8: Scheme of the general iterative reconstruction algorithms (Wernick & Aarsvold 2004).
Several algorithms were proposed in the literature, being the maximum likelihood expectation maximization (MLEM) algorithm the most popular (Moehrs et al. 2008) (Cloquet et al. 2010). However, it needs many iterations to converge. The ordered subsets expectation maximization (OSEM) algorithm (Michel et al. 1998) was proposed to replace this slow algorithm. Iterative algorithms are more versatile and flexible than FBP because both corrected data and not pre-corrected data can be used. At the same time some studies have shown that iterative reconstructions should achieve better noise characteristics than FBP (Riddell et al. 2001).
13
However they are computationally intensive (Pratx et al. 2006). Corrections can be included during the iterative process, for example, normalization and attenuation correction are included in normalization attenuation weighted OSEM (NAW-OSEM). This reconstruction method is preferred in clinical practice because it shows less noise and artifacts.
2.2. Magnetic Resonance Imaging
Purcell and Bloch discovered the physic phenomenon of nuclear magnetic resonance (NMR) in the early 1940s, however it first application as medical imaging was only realized in 1973 by Paul C. Lauterburg. He made the first NMR image by introducing gradients in the magnetic field. Paul Mansfield, in 1974, presented the mathematic theory for fast scanning and image reconstruction but only in 1977 Damadian et al. (Damadian et al. 1977) published the first images of the human body. The Nobel Prize in Medicine or Physiology in 2003 was shared by these two scientists, Lauterburg and Mansfield. Magnetic Resonance Imaging (MRI) is a medical imaging technique that allows acquiring images in vivo of morphology and body functions. MRI can provide high soft-tissue contrast and spatial resolution of anatomic images. The images are obtained non-invasively, safely and without ionizing radiation (Suetens 2009). Despite a relatively high cost, magnetic resonance imaging has become an indispensable technique in the diagnosis of various diseases. The MRI device is constituted by a magnet, magnetic gradient coils and a radio frequency (RF) transmitter and receiver. Additionally, to control the signal acquisition a computer is fundamental.
In essence, MRI measures magnetic properties of the tissue. It is based on magnetic fields and electromagnetic energy. In magnetic resonance (MR) a particular atomic nucleus is chosen to generate the signal and then obtain the images. This signal depends on the nucleus and its location in the body. The most common nucleus is hydrogen.
2.2.1.
Basic Principles
Besides the electron, the proton and the neutron also have spin angular momentum (or spin for short). The spin of an atomic nucleus consists in the vector sum of the constituent neutrons and protons spins, and its value depends on atomic mass and atomic number.
The human body is rich in water, so it is also rich in hydrogen. When applying an external static magnetic field B, the spins magnetic moment of protons begins to precess around an axis parallel to the direction of the field. This is explained by Boltzmann statistics (Brown & Semelka 2010):
14
at room temperature, there are less spins in the higher energy level than spins at the lowest energy level. For protons (1H) two orientations are possible: parallel and anti-parallel to B, corresponding to a lower and higher energy states, respectively. The precession has a frequency, 𝜔0 (Larmor frequency), which is directly proportional to the field B. It is given by the equation:
(1)
Where 𝛾 is the gyromagnetic constant and B is the magnetic field strength in Tesla. This equation explains the basic idea behind data acquisition in MR: the precessional frequency of a given nucleus is a linear function of the magnetic field experienced by that nucleus. For protons, the Larmor frequency is approximately 42.6 MHz in a magnetic field of 1 T.
Magnetic resonance occurs when transitions between the lower and the upper energy stage were performed and this can be achieved using an electromagnetic wave with a radio frequency spectrum range which is equal to the Larmor frequency (so-called RF pulse). The tissue protons absorb the energy and then they are going to occupy higher energy levels (number of antiparallel spins increased), at the same time the spins are force to rotate in phase. The flip angle consist on the angle of rotation relative to the main magnetic field direction. Due to changing energy levels, the net magnetization vector has both longitudinal (higher component in B direction) and transverse component. The net magnetization vector is oriented along the external field and represents the sum of all magnetic moments of the volume of protons. Figure 2. 9 shows the protons in the external magnetic field and the net magnetization are also represented. The appearance of a transversal component is due to an increase in coherence between spinning dipoles. This enables the detection of a signal using a RF receiver coil, according to Faraday’s induction law (Freire 2003).
The effects of pulsed RF spins depend on the amplitude and duration of these pulses (applied by means of a coil). The energy absorption process is called excitation. If a pulse of 90° is applied the total magnetization is no longer parallel to the magnetic field B and becomes perpendicular to B, being called transverse magnetization.
B
15
Figure 2. 9: External magnetic field effect on protons (Silva 2012).
When RF pulse ceases to act, the system gradually tends to return to the initial/equilibrium state with emission of energy, a process that is called relaxation.Here the transverse component returns to zero. The relaxation comprises two processes: the spin-lattice interaction (T1 relaxation) and spin-spin interaction (T2 relaxation).
The spin-lattice interaction is the mechanism which results in recovery of the initial situation (after applying a RF pulse), i.e., the value of longitudinal magnetization increase, returning to baseline (protons in the states of higher energy return to the lower states). Recovery occurs in an exponential manner and involves release of energy into the medium, characterized by a spin relaxation time T1. T1 is the time it takes for the longitudinal magnetization to recover 1 - (1 / e) of its maximum value. Its values depend of the strength of B (the higher the field, the higher T1), the flip angle and the composition of the tissues imaged.
T2 relaxation, also called spin-spin relaxation, results in the decrease (following an exponential relation) and then disappearance of transversal magnetization of the net magnetization vector after applying a RF pulse. This occurs due to the incoherent exchange of energy among neighboring spins (individual dipoles do not experience the same magnetic environment). T2 relaxation is a much faster decay mechanisms than the T1 relaxation and it value depends on the tissue under study. When the field inhomogeneities are taken in account it will cause the observable relaxation time, T2* instead of T2. This is cause by susceptibility differences between tissues, non-uniformity of the applied magnetic field and diffusion. T2* will be much shorter than T2 resulting in a more rapid signal loss.
16
2.2.2.
Image Principles
MR signal is generated by an alternating voltage, which happens because during the relaxation process, protons emit an electromagnetic wave with Larmor frequency, called the free induction decay (FID), which is shown in Figure 2. 10. FID does not have a spatial discrimination therefore to obtain a tomographic image using MR techniques is fundamental the use of three spatial encoding steps with the purposes of slice/volume selection and position encoding within the selected slice/volume. This is done by superimposing three linear magnetic field gradients, each one in the x, y and z directions onto the z-component of the main field (Suetens 2009).
Figure 2. 10: In section A of the figure is shown the conversion of longitudinal magnetization into transverse magnetization, Mxy, and then then the T2 relaxation occurs, which results in dephases i.e. decrease with time and finally the disappearance of Mxy. In section B a 90º RF pulse is applied at equilibrium. Initially Mxy has a maximum amplitude (spins rotate in phase) and then the Mxy precesses and induces a signal in an antenna receiver. A FID signal is produced, oscillating between positive and negative variations at the Larmor frequency. Due to the phase coherence loss the signal decays (Bushberg et al. 2002).
In the most acquisition sequence, the 3D image is reduced to 2D image (or slices). In each slice a RF excitation pulse,with a specific frequency spectrum, is applied in the presence of a magnetic field gradient parallel to B. Here a slice selection is made since only the protons with the Larmor frequency that matches the frequency profile of the RF pulse are excited (Silva 2012). Therefore this gradient is used to change the Larmor frequency of the protons along z direction.
The other two field gradient, phase encoding and frequency encoding gradients, are applied to the selected slice in order to differentiate between the protons within this slice. Phase encoding is
17
applied in y direction and allows that the individual dipoles precess at different speeds, according to their position along the y-axis. After the gradient is turned off, the dipoles returns to initial frequency, while their phases not. Frequency encoding is applied in x-direction and it will cause a variation on spin frequency of each protons in the selected slice, according to their position along the x-axis.
This raw data are represented by k-space and it was used a 2D Fourier transformed in order to determine the spatial distribution of the signal.
2.2.3.
Image Sequences
Different types of image contrast can be acquired with MRI by changing the RF pulse and gradient design through time. The two basic sequences are: spin-echo (SE) pulse sequence and the gradient-echo (GE) pulse sequence. The SE pulse sequence is the most often used in clinical MR and it starts with the application of a slice selection gradient together with RF excitation pulse of 90º followed by other pulse of 180º (Suetens 2009). After the first pulse the protons begin to diphase and then a phase and frequency encoding gradients are applied. In order to undo the dephasing the polarity of the first slice-selection gradient need to be reversed.It is possible when the pulse of 180º is applied because the protons became rotate back towards coherency, promoting the rephrasing of the spinning dipoles. The spin-echo sequence is characterized by very long acquisition times.
The gradient-echo sequence starts with a slice selection gradient simultaneously with an excitatory RF pulse. However, this time, the pulse has a flip angle lower than 90º which can be used to improve acquisition speed. As in the previous sequence, when the RF pulse is turned off, the protons begin to dephase and a phase encoding gradient is applied. Nevertheless the rephrasing step is achieved by alteration of the polarity of the frequency encoding gradient. Figure 2. 11 represents these two sequences.
The time between the excitatory pulse and the echo reading is the echo time (TE) while the time between consecutive excitatory pulses is known as repetition time (TR). These time intervals are used to control the image contrast.
18
Figure 2. 11: MR sequences: spin-echo (left) and gradient-echo (right). The ∝ is lower than 90º (Zientara 1995).
In this work, three different MR sequences were used: MPRAGE (Magnetization Prepared Rapid Gradient Echo), EPI (Echo-Planar Imaging) and FLASH (Fast Low Angle Shot) sequences. They are briefly described below.
MPRAGE sequence involves three periods: preparation period, data acquisition period and magnetization recovery period before the next preparation, avoiding saturation effects (Bluml et al. 1996). In the first period the T1 contrast are introduced in the image, applying a RF pulse with a flip angle of 180º. The data acquisition period start when the GE sequence is applied (rapid gradient echo) (Silva 2012). Images from MPRAGE sequences present high tissue contrast between gray matter (GM) and white matter (WM) which can be obtained in extremely short time. Changing TR, TE and flip angle parameters, the image contrast can be manipulated (De Lange et al. 1991), being possible get an optimum white-gray matter contrast. At the FZJ, the MPRAGE sequence is acquired in all MR acquisitions after the localizer image (i.e. MPRAGE is the 2nd sequence of the acquisitions).
EPI sequence can be classified as single-shot echo planar sequence and multi-shot planar sequence. The first EPI pulse sequence, and more common, consists in an excitation pulse that is followed by multiple gradient-echoes within a single pulse repetition time (TR) i.e. all the signal information needed to reconstruct the image is obtained in a ‘single shot’ (Borthakur et al. 2006). Subsequently an alternating frequency-encoding gradient was applied. This acts to diphase and rephrase spinning dipoles, yielding several echoes. The second differs from the first since the range of phase encoding steps is equally divided into several “shots” or TR periods and not acquired in one TR. The EPI sequence is mostly a GE-based, however a SE-EPI can also be performed. An EPI image slice can be acquired in 40 – 150 milliseconds and full 3D images in 1
19
to 3s (Freire 2003). The EPI sequence allows image acquisition in “real-time” and this is why it is the favorite in functional bold studies.
The FLASH sequence is characterized by two periods. The first period consists in magnetization preparation for tissue contrast while the second is the data acquisition period. This sequence allows longitudinal magnetization to recover faster and then reduce the TR. The FLASH sequence is a fast gradient echo-sequence which uses short RF pulses, resulting in small flip angles (Freire 2003). Using spoiling gradients or an RF spoiling pulse, the FLASH sequence eliminates the residual transversal magnetization prior to each RF pulse. The technique can provide T1- and T2- weighted images with high image contrast at high field strength (De Lange et al. 1991).
2.3. PET/MRI
PET/MRI is a hybrid system that combines the functional imaging with excellent sensitivity of PET and the high resolution, high soft-tissue contrast and great flexibility from MRI. The combination of PET/MRI allows the simultaneous acquisition of multifunctional data such as PET tracer uptake, MR spectroscopy, or fMRI (B. J. Pichler et al. 2008). The first true hybrid PET/MRI system for humans was proposed in 2008, the BrainPET insert which is a head dedicated PET insert system developed by Siemens Healthcare (Sauter et al. 2010). Despite it being a recent system, the first approach was published in 1997 by Shao et al. (Y. Shao et al. 1997). The PET/MRI systems are mainly implemented by Philips (Netherlands), Siemens (Germany) and GE Health Care (Milwaukee) (Jadvar & Colletti 2014). Several challenges were made over the years, however others significant challenges still exist before this hybrid system becomes a routine part of clinical imaging.
Merging these two techniques the limitations of both individual modalities can be reduced offering the prospect of improved diagnostics, treatment and preclinical research (Boss et al. 2010). MR information can be used to improve PET image quality into image reconstruction and post-reconstruction process, increasing the SNR and contrast (Caldeira et al. 2010) and reducing the PVE (Baete et al. 2004). MR information can also be used to smooth the activity within the tissues and make the edges steeper in PET images (Caldeira et al. 2013). Using simultaneous PET/MRI system, the motion parameters can be extracted by MRI and then be applied to correct the PET data. Therefore the motion can be corrected and then the coregistration can be improved.
20
2.3.1.
Design Difficulties
It is important to assure that these modalities can operate together without compromising the performance and with minimal interference. For this hybrid system there are three major concerns in the designing: 1) the photomultiplier tubes (PMTs) of PET are very susceptible to magnetic fields and therefore cannot be used in PET/MR, 2) creating attenuation maps for PET images and 3) find a proper construct for the PET/MRI system.
PET system has photomultiplier tubes (PMTs) which are used to convert the scintillation light from the crystal to an electrical signal with high gain. However PMTs are extremely susceptible to magnetic fields of the MRI scanner. Strategies to combat this interference were proposed. One of them consists in using optical fibers for detection defended by S. Cherry at UCLA (Y. Shao et al. 1997). However long optical fibers attenuates the light emitted by the crystals resulting in a loss of performance (Yamamoto et al. 2010). Other strategy is replacing the PMTs for avalanche photodiode devices (APDs) proposed by Pichler et al. (Pichler et al. 2006) and it has being explored the hypotheses of replacing PMTs for avalanche silicon photomultiplier (SiPM) (Wehner et al. 2014). A third approach consists in shielding the PMTs from surrounding magnetic field.
The attenuation maps are important because attenuation and scatter corrections depends on it. However in a PET/MRI context, creating attenuation maps for PET images is a concern because the map cannot be directly derived from MR images, due to the MR image intensities are not proportional to electron density (Hofmann et al. 2008). There are some approaches to MR-based attenuation correction: segmentation method and template/atlas-based method. In the first method, the attenuation map, which is generated by a transmission scan, is coregistered to the MRI images. This image is then divided into several areas with different attenuation values. After that the attenuation map is applied to the PET images. The atlas-based methods uses an MRI template and an attenuation map template. The MR template is adapted/registered to patient MR image using a non-rigid registration. Therefore the same non-rigid transformation is applied to attenuation map template and then the attenuation values can be assigned to the PET image, based on the attenuation values assigned to the MRI. The attenuation map template is constructed as an average image from several transmission scans. One such approach was proposed by Kops and Herzog (Kops & Herzog 2007) and it is routinely used in FZJ. The method consists in using coregistered measured attenuation maps and MR images to create the template pair (Malone et al. 2011). They applied separate spatial normalization to the MR images and attenuation maps. A proper construct for the PET/MRI system is essential. It requires a minimal disturbance between the PET ring and magnetic field and the PET detector must have an external read-out or be resistant to magnetic field (Daftary 2010). Additionally to avoid electromagnetic interference all