M
ASTER OF
S
CIENCE
M
ATHEMATICAL
F
INANCE
M
ASTERS
F
INAL
W
ORK
I
NTERNSHIP
R
EPORT
M
ODELING FINANCIAL NEEDS OF BANK CLIENTS THROUGHOUT
THEIR LIFE CYCLES
R
ICARDO
F
ANHA
V
ICENTE
S
OARES
M
ASTER OF
S
CIENCE
M
ATHEMATICAL
F
INANCE
M
ASTERS
F
INAL
W
ORK
I
NTERNSHIP
R
EPORT
M
ODELING FINANCIAL NEEDS OF BANK CLIENTS THROUGHOUT
THEIR LIFE CYCLES
R
ICARDO
F
ANHA
V
ICENTE
S
OARES
S
UPERVISION:
PEDRO LOUREIRO
ONOFRE ALVES SIMÕES
i
Acknowledgements
I would like to express my deepest gratitude to Professor Onofre Simões and Dr. Pedro Loureiro, for the guidance, the support and the good words, the patience and out-of-hours work done towards this project. For every lesson, advice and problem solving, I thank you.
To Gonçalo Traquina, Frederico Silva and António Leitão, for the precious advice in each stage of the project and for every tool provided, which enabled every analysis performed throughout this work, I thank you.
To Miguel Caiado, for your time dedicated to this work, your aid, motivation and optimism, I thank you.
To KPMG and the M&RC department, I’m grateful for the excellent work environment set to an intern.
To my Master’s colleagues and friends, for the kind words and the support given, I thank you.
To everyone who answered my survey, I thank you.
To Mihaela. Without you, this work would be impossible. I deeply thank you, for being there for me at all times, for keeping me cheerful and for helping me overcome every obstacle.
And a special gratitude to my parents, Cristina and António, and my grandmother, Teresa, because I owe it all to you.
ii
Abstract
The constant change that has been noticeable on a worldwide level has impacted the economical, geopolitical and social frameworks, with direct repercussions across every sector. For example, the financial sector is compelled to rethink strategies and to adapt its procedures in order to be up to date with respect to the current technological and social disruption, thus creating new business methods and opportunities.
Currently, the financial institutions need new approaches to retain and to capture clients, such as knowing them and anticipating their needs. It is in this context that the concept of financial necessities arises, a subject that needs academic and professional investigation.
With this work, it is intended to describe the different stages of the human life cycle, according to data collected during the project, and to provide an analysis on how its components are related to the decision process of acquiring financial products and services.
It is also expected to provide a framework to the life cycle – financial necessities relationship and to develop a statistical model that predicts these needs throughout the life cycle and optimizes the propensity to consumption of financial products and services.
The analysis carried out in this work discloses relevant insights, such as the existence of correlation between typical life events (e.g. marriage or childbirth) with the acquisition of financial products, a detailed framework of the life cycle - financial needs relationship and a predictive model which outputs the next best offer for clients.
iii
Resumo
A constante mudança que se tem feito notar a nível global, gerou um enorme impacto nas grandes envolventes económicas, geopolíticas e sociais, fazendo-se fazendo-sentir por todos os fazendo-sectores. Nomeadamente, o fazendo-sector financeiro tem sido obrigado a repensar estratégias e a adaptar abordagens para conseguir acompanhar toda a disrupção tecnológica e social que se tem sentido, criando e aproveitando novas oportunidades de negócio.
Atualmente, as instituições financeiras precisam de novas estratégias para reter os clientes atuais e capturar novos clientes, tal como a antecipação das suas necessidades. É neste contexto que surge o tema das necessidades financeiras de cada pessoa, um tema que carece de uma abordagem mais prática e realista, bem como de um enquadramento técnico adaptado ao tempo presente.
Com este trabalho é ambicionado descrever as diferentes fases do ciclo de vida de uma pessoa, com base em dados recolhidos, e analisar de que modo é que os seus componentes têm influência na decisão do consumidor, relativamente à aquisição de produtos e serviços financeiros.
É também pretendida a elaboração de um enquadramento da relação ciclo de vida – necessidades financeiras e o desenvolvimento de um modelo que projete estas necessidades ao longo do ciclo e que otimize a propensão ao consumo, mediante a posição de cada pessoa no ciclo de vida.
Esta análise revela pontos bastante relevantes, tal como a existência de correlação entre a ocorrência de certos eventos (como, por exemplo, casamento, nascimento de um filho) e a aquisição de produtos financeiros, um esquema detalhado da relação entre o ciclo de vida e as necessidades financeiras e ainda um modelo que prevê a melhor oferta de produtos e serviços financeiros para cada cliente.
Palavras-chave: Necessidades Financeiras, Ciclo de Vida, Análise de
iv
Table of Contents
Acknowledgements ... i Abstract ... ii Resumo ... iii Table of figures ... v 1. Introduction ... 12. Life Cycle and Financial Needs ... 2
2.1 Motivation ... 2
2.2 Theoretical Background ... 3
2.2.1 Life Cycle ... 3
2.2.2 Financial Life Cycle ... 4
2.2.3 Financial Products & Services and Financial Needs ... 5
3. Survey ... 8
3.1 The Survey ... 8
3.2 Goals and Limitations ... 11
3.3 The Database ... 12
4. Modelling Life Cycle Financial Needs ... 14
4.1 Data preparation ... 14
4.1.1 Data cleansing ... 14
4.1.2 Transforming and blending data ... 15
4.2 Life Cycle and Financial Needs ... 16
4.3 The “Best Offer” Model ... 23
5. Results and Conclusions ... 32
References ... 35
v
Table of figures
Figure 1 – The KPMG life cycle – financial needs framework ... 6
Figure 2 – Example of the survey’s demographic questions... 9
Figure 3 – Example of the P&S survey questions ... 10
Figure 4 – The survey’s events question ... 11
Figure 5 – Database composition ... 13
Figure 6 – Financial needs per life stage ... 17
Figure 7 – Basic and credit P&S owned by the respondents, in % ... 19
Figure 8 – Married respondents, per life stage, in % ... 21
Figure 9 – Top 3 products and top 3 events, for each life stage, in % ... 21
Figure 11 – Logit regression on “Housing loans” ... 25
Figure 10 - Logit regression on the answer “Investments in stocks” ... 25
Figure 12 – Partition indicator: cluster analysis ... 27
Figure 13 – Cluster solution on principal components 1 and 2 ... 29
Figure 14 – Clusters characteristics ... 30
Figure 15 - Survey ... 37
Figure 16 – New data type of the survey’s answers ... 43
Figure 17 – Alteryx workflow for changing the data type ... 43
Figure 18 – Correlation table ... 44
vi
List of Abbreviations
1
1.
Introduction
The present report resulted from a five months curricular internship at KPMG-Advisory, within the Management & Risk Consulting department, as part of the conclusion of ISEG’s master program in Mathematical Finance.
Apart from applying concepts learned throughout the academic part of the masters, the internship also allowed for learning new notions and approaches to topics addressed there. Most importantly, during the internship it was possible to be where theory meets practice and to see how what had been learned was used to create value within the financial system, particularly how statistical and econometric theory could be used for gaining insights and building models to optimize clients’ financial consumption and improve financial institutions’ performance.
The life cycle of a regular person is correlated with his/her own financial life cycle, where the typical life events, such as marriage or retirement, trigger needs to purchase financial products and services. This empiric perspective has increasingly gained importance within the financial business area, although lacking models and concrete tools that assure statistical significance, allowing the estimation of propensity to consumption regarding the relationship life cycle - financial products and services (P&S).
Hence, the scope of this project is to develop a life cycle framework and to build a model that optimizes the propensity to consumption of financial products and services throughout the course of life.
2
2.
Life Cycle and Financial Needs
2.1 Motivation
In line with the insights of Sikander Sattar, KPMG Portugal CEO, in KVISION (Jan 2018), it is easily perceivable that the world is changing, fast and unpredictably. The economic, geopolitical and social pictures exhibit strong shifts and disruptions. These changes affect all economic sectors worldwide and the financial sector is not an exception.
Under this frame, financial players have to adapt to the new circumstances and must be leaders of innovation. The markets don’t behave as they did 50, 40 or 20 years ago. Now, financial institutions, especially banks, have to create business, that is, provide new services to capture new clients (or to retain their own). Essentially, banks need to embrace change. Financial institutions now think of new ways to be in touch with their clients and one of the approaches chosen is to predict each of their clients’ needs. In order to obtain more accurate predictions, they must know each client to the maximum extent possible. And this implies knowing their necessities, immediately arising the question “What factors or events generate these necessities?”
In the course of life, human beings experience several events of all sorts: cultural, physiological, random, professional, etc. Some events, such as Marriage, Childbirth or First Job, are situational or occasional and some events are inevitable, occurring in certain periods or stages of life, due to the combination of some demographic, geographical and financial factors, among others, depending on multiple circumstances and aspects of an individual’s lifetime.
Events generate/trigger a set of needs, specifically financial, such as the need for saving, safeguarding, earn/growing and borrowing, that are satisfied by financial products and services. Accordingly, throughout their life cycles, people rely on financial Products and Services to answer needs and overcome difficulties, imposed by the occurrence of events, therefore becoming increasingly prominent the role of financial products and of financial institutions in one’s life.
3
Being a progressively relevant topic, the Life Cycle - Financial Needs relationship is a subject with increasingly relevance within KPMG and its line of business. Its business approach lacks not only a complete and realistic framework but also a robust statistical model that estimates a customer’s propensity to consume financial P&S, based on the customer’s life and financial life cycle, thus motivating this project.
The main purpose of this work is to find which drivers generate clients’ necessities for financial products and provide this topic with a complete framework and a robust statistical model that can be used for the prediction of such needs.
2.2 Theoretical Background
There are numerous studies on the Human life cycle and its stages, by different kinds of researchers, mainly biologists and sociologists, such as B. Bogin & B. Smith’s (1996), writing on the evolution of the life stages throughout history and Erikson, E. (1998), developing a detailed theory of the psychosocial life stages of human development, describing eight life-cycle stages, from birth to death. Later, Slater (2003) develops the Erikson argument, with special focus on the adult life stages. Also, the Dr Thomas Armstrong study in 2008 (The 12 Stages of Life, AILHD), provided advances in this field.
On the other hand, the financial life cycle subject lacks research and investigation, therefore being a somewhat difficult field to analyze. Nevertheless, in this section, the studies and theories that this work is developed upon will be presented.
2.2.1
Life Cycle
According to B. Bogin & B. Smith (1996), the Human life cycle is best described by five stages: Infant, Child, Juvenile, Adolescent and Adult, with factors as the change in human growth rates, meaning that hum an beings have different rates of development during their lifespan which at some extent are related with the changes in the trophic and reproductive behaviour; that is, the differences in the reproductive system that are associated with each life stage.
4
The scope of the present work regards only the Adult stage, as it will analyze the financial behaviour of the adult population during the Adult stage. As this stage is too broad, it is necessary to split it into four sub-stages, considering a number of different characteristics from the ones stated by B. Bogin & B. Smith (1996) (biological and physiological), such as demographic aspects (marriage, income, number of children, age and professional activity). Therefore, the four sub-stages proposed are, respectively, Young Adults (Early Adulthood), Adults, Midlife and Mature Adults.
The Young Adults life stage comprehend people from 18 to 24 years old who started working in the last five years, that is, who are in the very beginning of their professional life/career and are on the process of separation from their parents’ house/guard/allowance, becoming independent and accumulating responsibilities.
People between 25 and 35 years old, who already have an ongoing career, are placed in the Adults stage. Adults are generally independent, with priorities different from those of the Young Adults, more focused on the career, finding a mate and building a family.
Midlife includes people from 35 to 54 years old who are in a later phase, career wise, and whose priorities are more oriented towards growing the family and planning the future.
Lastly, the Mature Adults go from 55 to 67 years old and are on the verge of retirement (or newly retired).
2.2.2
Financial Life Cycle
According to the KPMG Database, the financial life cycle of a human being is partitioned into four stages. Financial Dependency, Financial Independency pre-family, Financial Independency with dependents and Financial Independency pre-retirement & retirement.
The KPMG Database is an extensive collection of data gathered during the firm’s activity, that is, a database that contains information associated with KPMG
5
projects of every kind, from multiple lines of business regarding different firms and people.
Anyone who relies on other person (usually parents) for sustenance belongs to the Financial Dependency Stage.
The second stage includes people who already work and have already moved out of the parent’s house, providing for themselves, before marrying and starting a family.
Financial Independency with dependents include people who already started a family of their own, while working and providing for themselves and their dependents.
In the last stage of the financial life cycle we find people who are nearly retiring (or already) retired, whose children are now financially independent.
2.2.3 Financial Products & Services and Financial Needs
The financial products and services sold by most Portuguese banks fall into five major categories: Basic P&S, Credit, Investment, Insurance and Savings. Financial P&S exist to answer a person’s financial needs. These needs are classified, according to the KPMG database, as Grow, Safeguard, Spend, Earn and Borrow. As a disclaimer, this approach is adopted due to the almost non-existence of research in this particular subject – different types of financial necessities – thus becoming interesting to test against the data collected when elaborating the project.
During their lifespan, people often need to protect themselves against threats and risks, that is, they need to safeguard themselves or their relatives against certain events. One way to safeguard is to buy insurance.
Also, there are moments in life where people lack liquidity, that is, have needs but do not own sufficient resources to satisfy those needs, such as buying a house for their family. In these cases, people generally resort to financial institutions, more specifically, to credit, thus incurring in debt.
6
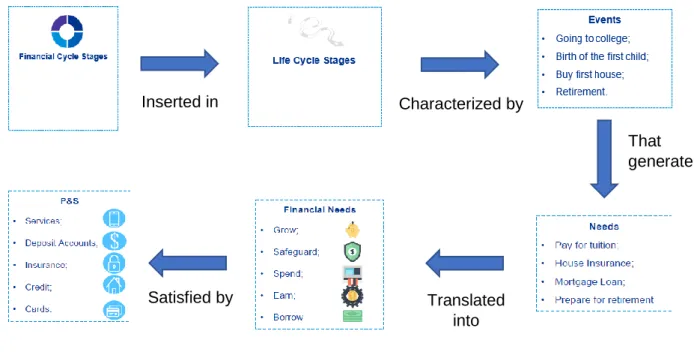
Figure 1 – The KPMG life cycle – financial needs framework
Grow is, most times, a constant need throughout the life cycle, leading people to acquire one, or several, savings products, such as savings accounts. Although being a permanent necessity, ideally, there can be times where it isn’t possible to save.
The Earn financial need has a risk component associated. Alike Growing, people need to Earn their entire life, therefore purchasing investment products and services from banks, such as participation in funds and investment management, a service that invests on behalf of the client.
2.3 The Life Cycle – Financial Needs Framework
According to the KPMG Database, the financial life cycle is somewhat inserted in the (general) life cycle, as the age and the occurrence of certain events define the limits of each stage, therefore being considered as a part of the Life Cycle. The life cycle stages are characterized by the occurrence of some stage-specific events, such as getting the first job – usually occurs between the adolescence
Inserted in Characterized by That generate Translated into Satisfied by Source: KPMG Database
Gráfico 1 – Esperança de vida e esperança de vida sem incapacidade
7
phase and the young adult phase, also during the latter, or having children – most common in the Adult and Midlife phases.
Most events throughout life generate needs, namely financial needs. Buying a house very often generates, or has generated the need for borrowing, therefore contracting debt from the bank. The birth of a child generates the need to Safeguard and to Grow, therefore buying insurance and a savings account. Hence, financial P&S are present throughout life, in every stage of the life cycle. In the next chapters, the theory presented and the veracity of the previous arguments will be tested against a set of data collected by the author, resorting to multiple statistical procedures and softwares.
8
3.
Survey
In order to study the relationship Life Cycle – Financial Needs and to develop the “Best Offer” Model, it is necessary to gather information on the individual’s demographics, their financial P&S consumption behavior and also the moment in life that certain events occurred, during the life cycle. To obtain this kind of information, a survey was designed and put into practice.
As a start, it was established that the targeted audience would be the active and retired Portuguese population. Students and younger individuals are not included in this work’ scope, since they do not have an established financial consumption behavior.
3.1 The Survey
The survey, hereafter referred to as "survey” (see Appendix A) was built and carried out in the Online Survey Platform “SurveyMonkey”, an online survey tool and it is segmented into three sections of questions: Demographic, Financial P&S consumption and Life Events. The language is Portuguese, with some translation notes subtitled.
The Demographic section (see Figure 2) contains questions on the respondents’ demographics, such as age, activity, and number of children, among others, and also questions on personal budgeting.
9
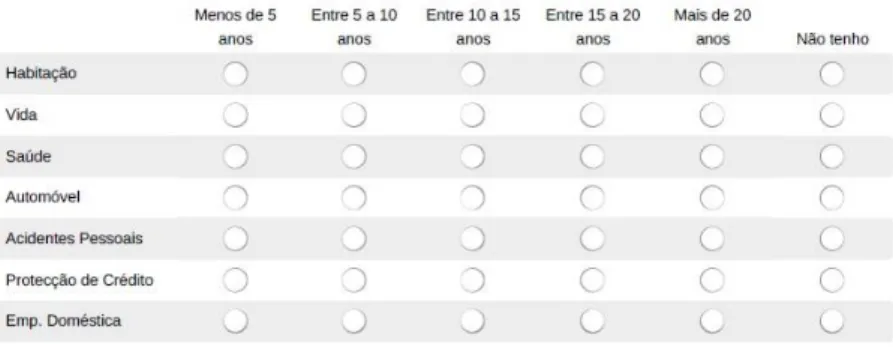
The Financial P&S Consumption section asks “when a certain product was acquired”, where the respondent chooses from a set of answers going from “in the last 5 years” or “5 to 10 years ago” to “more than 20 years ago”. There is also an “I don’t have this product” option. The questions are divided into five categories, which are the same used for the P&S: Basic P&S, Credit, Investment, Insurance and Savings (see Figure 3 for an illustration).
Translation notes: 5. Education level; 6. Current employment situation; 7. Business/sector; 8. Monthly net income.
Source: Survey
10
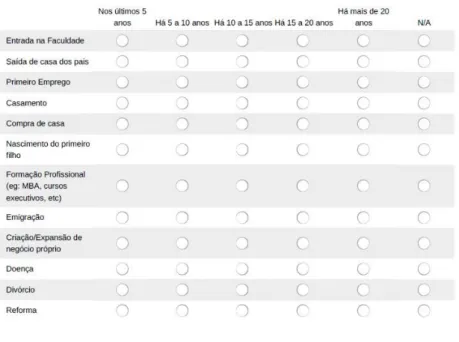
Lastly, the Events section (Figure 4) includes just the one question – When certain events have occurred in the respondent’s life, with the same type of answer options used in the previous section.
Translation notes: Timeline - How long have you purchased insurance products: House; Life; Health; Car; Personal accident insurance; Credit protection insurance; Domestic employees’ insurance.
Source: Survey
11
3.2 Goals and Limitations
Before launching the survey, the desirable characteristics of the database were defined.
In order to produce statistically significant insights on the relationship Life Cycle - Financial Needs and capture consumption patterns for the development of a good model, the database should:
• Have at least 500 to 1000 proper observations, or answers to the survey;
• Have demographically heterogeneous observations.
Ideally, the survey should have answers from different regions, by people of all ages, with different professions and lifestyles, in order to capture different patterns of financial products consumption.
Translation notes: Timeline – Admission to University; Move out of parent’s house; First job; Marriage; First House; Birth of the first child; Professional Training; Emigration; Own business; Disease; Divorce.
Source: Survey
12
Facing these objectives, there were several limitations that this survey, and therefore the project, were subject to.
Since this is a very early approach to the Life Cycle – Financial Needs relationship by the firm, there was an attempt to control the source of the data. The survey was limited to KPMG employees, ISEG alumni, friends and family, and LinkedIn connections.
Time was a constraint as well. Notwithstanding tight deadlines, the survey would benefit from being public for a longer period of time, in order to capture a greater number of answers.
These limitations shadowed a few objectives and had a footprint on the results of the project.
3.3 The Database
The survey went public on May 14, 2018 and was closed three weeks later on June 4, with a total of 342 answers. Of the total respondents, 52 were students, thus removed from the database, as students were out of the project’s scope. From the 290 non-student answers, 13 observations were removed due to incompletion of the questionnaire (had only 10 questions answered), arriving to 277 suitable observations, this being the final number of observations.
13
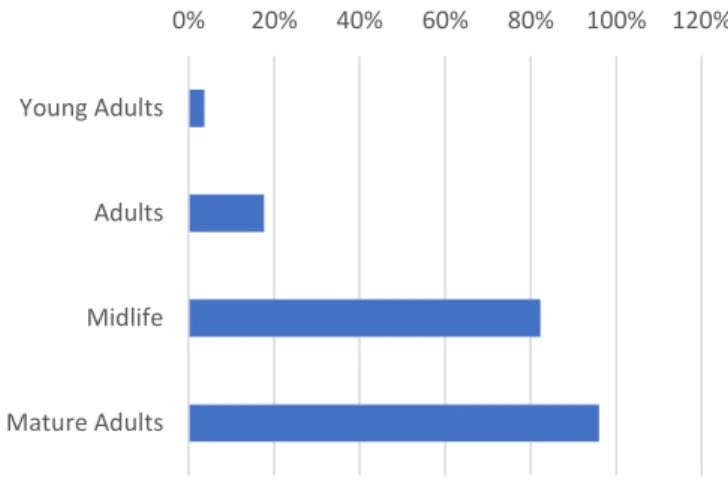
The dataset is composed of 81 Young Adults, 85 Adults, 86 “Midlifers” and 25 Mature Adults, as illustrated in Figure 5.
The main features of the sample are:
• 93% of the Young Adults started working in the last five years. 80% acquired a bank account when they were between 15 and 20 years old and half of them don’t have a credit card. Of those who have, 74% acquired during the last five years.
• Almost 60% don’t have any savings product purchased from the bank, while the remaining 40% that have bought one during the last five years. Still, Young Adults don’t spend much on financial products.
The idea of transition between stages arises from the description above, in which most products were acquired recently, and an important event occurred in the last five years of almost every Young Adult.
• It is possible to see a few differences in the Adult population picture. 75% already have a credit card and 25% have house loans (almost a 25% increase from the previous stage). From these 25% who have house loans, that is, 20 respondents, 15 bought the house in the last five years, where 11 of those 15 respondents also married during the last five years.
29% 31% 31% 9% Young Adults Adults Midlife Mature Adults Source: Survey
Gráfico 2 – Esperança de vida e esperança de vida sem incapacidade
aos 65 anos para mulheres em Portugal
14
• Only 15% have investments P&S and 77% have purchased savings products, of which 50% have been acquired during the last five years. In terms of events, although existing more married people than the stage before, the most common event between Adults is the first job.
• For Midlife, the consumption behaviour is certainly different from the previous stages. 90% have acquired credit cards, 92% are married and 90% own a house, where 72% of the respondents have house loans. • More than 30% have investment services purchased on the bank (the
double of the previous stage) and 70% have savings. Regarding insurance P&S, this is the stage that acquires more insurance services, with 77% having life insurance and 80% having car insurance.
Hence, it is possible to notice a very different consumption pattern and, therefore, financial needs, with respect to the other life stages.
• Finally, the Mature Adults show a distinct consumption pattern. While 40% have investments, less than 50% have house loans. In terms of savings, half of the mature adults have a savings account and 92% have car insurance. The most common event is retirement.
4.
Modelling Life Cycle Financial Needs
To answer the research question, the procedure is divided into three parts: i) Data Preparation; ii) Life Cycle-Financial Needs relationship research; iii) “Best Offer” Model
4.1 Data preparation
Data Preparation is the process of collecting, cleaning, and consolidating data into one file or data table, primarily for use in analysis, being that the observations are composed of the answers to the survey.
4.1.1
Data cleansing
After the data has been collected, the first step on preparation is the data cleansing. To cleanse the data, firstly was needed to extract the survey answers
15
to Excel. Then, answerswere organized, clearing unnecessary white spaces and non-relevant information/data. Secondly, the observations that did not prove to be relevant were removed. Afterwards, with the help of histograms and scatterplots, the outliers were identified. The inconsistent outliers, such as absurd observations (i.e., people with 25 years married for 20 years), were removed. The final process of cleansing the data was dealing with missing data. Two methods were carried out – Missing Data Deletion and Missing Data Imputation.
The Missing Data Deletion implies the deletion of unusable observations, such as observations with too many missing values. There were 13 observations within the dataset composed of mostly null answers. Those observations were removed from the data.
The Missing Data Imputation is a method for substituting null values with other values. There are single and multiple imputation methods. Single imputation processes include the mean imputation, median imputation and the regression imputation. The method used in this work was the Mean Imputation.
The mean imputation is a process aiming “[…] to replace each missing
value with the mean of the observed values for that variable”, (Gelman, 2007). After arriving at the final number of observations fit to start the analysis (277), there were still missing values, although of a not relevant size. Thus, each missing value was imputed by the mean value for that variable within the correspondent life stage.
4.1.2
Transforming and blending data
The second step is to transform and blend the data. In order to research the Life Cycle – Financial Needs topic and to develop the “Best Offer” Model, the data must be restructured, that is, reshaped to another data type – Data can be of different types, Categorical or Numerical (Data Types in Statistics, Towards Data Science). Categorical data includes nominal (generally data in form of text) and ordinal data (values representing discrete and ordered units without mathematical significance, such as ranks, qualifying statements resorting to numbers). Numerical data can be discrete (number of cards within a deck) or
16
continuous (measurements, such as height or weight). The survey data is composed mostly of nominal data and a few procedures carried out in the next chapters, required numerical or ordinal data, thus resorting to the transformation of the dataset.
The transformation and blending operations performed throughout this work are the conversion of the nominal data into numerical and categorical data and the creation of new variables from the answers to the survey.
Three procedures were applied to transform data:
Answers of Yes/No questions were assigned 1 or 0 and answers composed of ranges were assigned their range midpoint. The answers for the products and event questions were assigned their midpoint (less than 5 years were appointed with 2.5, 5-10 years were appointed 7.5), but 0 if the answer was negative (or N/A). The answers for the question “Se tem cartão de crédito, com que
regularidade o utiliza” (If you have a credit card, how often do you use it?) were
transformed into ranks, in which 1 was the first and 5 was the last answer. Finally, for questions with more than 2 answers, the latter were aggregated logically (eg if the inquired had a bachelor or superior, than 1, if not, 0). The full index is in the Appendix B.
Regarding, the creation of new variables within the dataset, these resulted from operations between existing ones, such as subtracting the age of the respondent’s dependents to the age of the respondent, which yielded the new variable “Age (of the respondent) when the dependant was born”.
4.2 Life Cycle and Financial Needs
For the second part of the methodology, to study the relationship between the Human being cycle of Life and the individual’s financial needs, data was explored with the aid of Alteryx tools, a Data Analytics software, which produces statistical summaries of the data, correlation matrices, histograms, scatterplots, and frequency tables.
The Alteryx tools used to produce the next insights were “Field Summary”, “Pearson Correlation”, “Scatterplot” and “Frequency Table”.
17
The Field Summary tool analyzes data and creates a summary report containing descriptive statistics of the data, such as mean, median and standard deviation. The Pearson Correlation tool calculates Pearson Correlation coefficient, thus measuring the linear dependence between two variables as well as the covariance.
«The purpose of correlation analysis is to measure and interpret the strength of a linear or nonlinear relationship between two continuous variables (…) For example, when the value of the predictor is manipulated (increased or decreased) by a fixed amount, the outcome variable changes proportionally (linearly)», (Silverman, Tuncali and Zou, 2003).
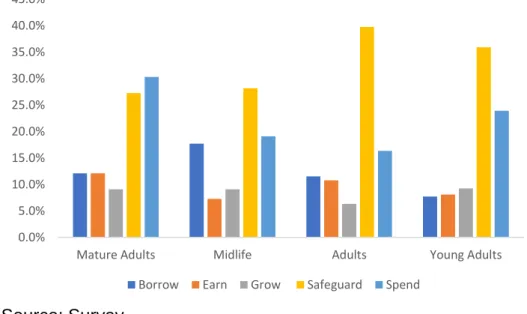
The Frequency Table tool produces a frequency analysis for selected fields. As stated previously, people in different life stages have different needs, in particular different financial needs. The dataset reflects this idea, as every result and output of this chapter is based on the dataset. The graph below was originated with the aid of the previous tools and it shows the importance of each class of financial needs for every life stage:
0.0% 5.0% 10.0% 15.0% 20.0% 25.0% 30.0% 35.0% 40.0% 45.0%
Mature Adults Midlife Adults Young Adults Borrow Earn Grow Safeguard Spend
Source: Survey
Gráfico 3 – Esperança de vida e esperança de
vida sem incapacidade aos 65 anos para mulheres em Portugal
18
These new variables (Borrow, Earn, Grow, Spend and Safeguard) were calculated assigning a financial product to the correspondent need that it satisfies.
Figure 6 expresses that the Young Adults show more concerns on spending and safeguarding, versus the other needs, being small the percentage of those who have needs of borrowing and earning. This confirms the theory that young adults start having more responsibilities (start to support themselves), but also have more money available, since the first job is within this life stage, for most cases (see the next figure). It is also in this life stage that the values for “Grow” are higher (9.3%), meaning that young adults worry about saving and worry about the future. The “Borrow” necessity gains relevance in the Adult stage, being even higher during Midlife, corresponding, to credit services for buying houses, cars or goods, among others, possibly due to the occurrence of events such as marriage or childbirth.
Conversely, Mature Adults do not need to safeguard as much as people in the younger stages. Instead, they acquire products and services related to spending and investing.
The figures below show the three products most owned within life stages, for basic financial products and credit P&S.
19
Credit cards and standard bank accounts are the most common products sold by banks, and this fact is confirmed by Figure 7. While most Young Adults and Adults need prepaid cards, for “Midlifers”, the need is absolutely different. People within this stage need to purchase bank accounts that have specific features, such as
0% 2% 4% 6% 8% 10% Consumption
Education Housing
Credit - Young Adults
0% 5% 10% 15% 20% 25% Housing Car Loan Consumption
Credit - Adults
0% 20% 40% 60% 80% Housing Car Loan ConsumptionCredit - Midlife
0% 10% 20% 30% 40% 50% Housing Car Loan ConsumptionCredit - Mature Adults
0% 20% 40% 60% 80% 100% 120% Bank Acc
Credit Card Prepaid Card
Basic P&S - Young Adults
0% 20% 40% 60% 80% 100% 120% Bank Acc
Credit Card Prepaid Card
Basic P&S - Adults
0% 50% 100% 150% Bank Acc
Credit Card Prearranged Acc
Basic P&S - Midlife
0% 20% 40% 60% 80% 100% Credit Card
Bank Acc Account Manager
Basic P&S - Mature Adult
Figure 7 – Basic and credit P&S owned by the respondents, in %
Source: Survey
Gráfico 4 – Esperança de vida e esperança de
vida sem incapacidade aos 65 anos para mulheres em Portugal
20
the possibility of salary advances. For Mature Adults, the Figure confirms the theory. Their daily expenses are reduced, since their children start living on their own and loan charges start to decrease, therefore having more money available. While other needs cease to exist, with more money available, other needs arise, such as wealth management. Figure 7 illustrates this argument, with more that 40% of Mature Adults having an account manager.
Figure 7 also confirms the reasoning presented previously. It is possible to capture the behaviour towards the credit services, especially when it comes to borrowing money to buy a house. Young Adults don’t resort to credit, with only 9% having borrowed for consumption. In the Adult phase, the housing loans start to have significance, with 22% having incurred in debt to buy a house. But is the transition into the midlife stage that is critical, regarding housing loans. 75% of “Midlifers” have already purchased housing loans. Accordingly, the difference between married Adults and married “Midlifers” on Figure 8 is similar to the housing loans numbers on Figure 7.
To corroborate the fact mentioned above, the numbers of Mature Adults who have loans is significantly lower than “Midlifers”, thus having lower expenditures, at least on this level.
21
Figure 9 aids in this analysis and provides insights on the relationship Life Cycle – Financial Needs. 0% 20% 40% 60% 80% 100% 120% Young Adults Adults Midlife Mature Adults
Translation notes: Young Adults: First job/Health insurance; Move out of parents’ house/Savings Account; Admission to University/Credit Card. Adults: First job/Health insurance; Training/Credit Card; Move out of parents’ house/Car insurance.
35% 31% 28% 30% 35% 93% 0% 20% 40% 60% 80% 100% CC Entrada na Faculdade Conta Poupança Saída de casa dos pais Saúde Primeiro Emprego
Top 3 Products vs Events
-Young Adults
26% 24% 28% 28% 42% 54% 0% 10% 20% 30% 40% 50% 60% SAutomóvelSaída de casa dos pais CC Formação Profissional (eg:…
SSaúde Primeiro Emprego
Top 3 Products vs Events
-Adults
Figure 8 – Married respondents, per life stage, in %
Source: Survey
Gráfico 5 – Esperança de vida e esperança de
vida sem incapacidade aos 65 anos para mulheres em Portugal
22
Figure 9 compares the events that happened in the last five years in each respondent’s life, and, cumulatively, the latest events of each life stage. Also, the three most bought P&S during the last five years.
For Young Adults, after getting their first job they bought, a savings account and a health insurance (maybe part of the job contract). But for Midlife, the picture changes. Since 24% studied to achieve higher education levels and 19% had a child, the products they bought were majorly savings products. For Mature Adults, the latest events are retirement, generating needs of investing their life savings and updating their banking account to a most appropriate one. The bar graph illustrates this argument.
It is easy to understand that, in fact, there are life stages, during everyone’s life cycle. Stages that depend on multiple factors and variables. Even though people with the same age, the same income or with the same number of children might not belong in the same life stage, their life follow patterns, in the form of events, decisions or consumptions. With this study, it is possible to conclude that there are correlations (see Appendix C) within people’s behaviours, especially between life events, needs and financial needs, and decisions of consumption.
Translation notes: Midlife: Training/Savings Account; Birth of first child/Term deposit; Disease/Car insurance.
Mature adults: Retirement/Checking account; Disease/Investment Fund; Own business/House Insurance. 12% 4% 12% 8% 16% 16% 0% 5% 10% 15% 20% Habitação Criação/Expansão de negócio… Fundos Doença Conta Corrente/DO Reforma
Top 3 Products vs Events
-Mature Adults
20% 14% 22% 19% 24% 24% 0% 5% 10% 15% 20% 25% 30% Automóvel Doença Depósito a prazo Nascimento do primeiro filho Conta Poupança Formação Profissional (eg:…Top 3 Products vs Events
-Midlife
Source: Survey
Gráfico 6 – Esperança de vida e esperança de
vida sem incapacidade aos 65 anos para mulheres em Portugal
23
The next step is to model and to predict which financial products and services will a certain person need, based on his/her life stage, life events, demographics and his own subscriptions of financial P&S.
4.3 The “Best Offer” Model
The purpose of the “Best Offer” Model is to predict the short-term financial needs of a bank costumer, taking into account the client’s profile and financial life cycle stage, information on his/her demographics and past events and also his/her client profile, i.e. which P&S he/she already owns.
The model was developed by capturing different consumer behaviours within the dataset, with resource to statistical procedures of Cluster Analysis. There are several algorithms and methods of clustering data, such as mean-shift, Gaussian Mixture Models and K-Means. Although these methods were fit to the scope of this paper, the K-Means was chosen mainly due to its simplicity and for being optimized in the Alteryx software.
The k-means clustering aims to partition the sample (n) into k clusters, in order to minimize the within-cluster sum of squares, i.e. the variance. The objective is to find arg min 𝑺 ∑ ∑ ||𝑥 − 𝜇𝑖|| 2 = 𝑎𝑟𝑔 min 𝑺 ∑ |𝑆𝑖| 𝑘 𝑖=1 𝑉𝑎𝑟 𝑆𝑖 𝑥∈𝑆𝑖 𝑘 𝑖=1
Where 𝜇𝑖 is the mean of points in 𝑆𝑖.
The cluster analysis identified different consumer clusters and, as referenced before, it was performed with the k-means clustering method, in Alteryx.
“(…) The main idea behind these techniques is the minimization of a certain criterion function usually taken up as a function of the deviations between all patterns from their respective cluster centers. Usually, the minimization of such criterion function is sought utilizing an iterative scheme which starts with an arbitrary chosen initial cluster configuration of the data, then alters the cluster
24
membership in an iterative manner to obtain a better configuration. (…) A K-Means algorithm alternates between two major steps until a stopping criterion is satisfied.”
In Selim & Ismail (1984)
The method for the model development is comprised of several steps:
The first issue addressed was the variable reduction. The dataset includes 80 original variables – the survey questions - plus 25 new Yes/No variables, whether the respondent have/have had (1) or doesn’t have (0) a determined financial P&S. After performing tests utilizing every variable in the dataset, results returned very poor, implying that 105 variables for 277 observations was too much. Therefore, a selection of variables was required.
To reduce the number of variables and, at the same time, input the most relevant ones, regressions would be run on the newly created variables, to conclude which old ones would be related with the dependent variable (the dependent variables of these regressions were the newly created variables) and therefore, be selected to the cluster analysis. Since the dependent variable is dichotomous, the choice was between the logit and the probit regressions. With the aid of the Alteryx Distribution Analysis tool, a tool that determines which distributions better fit the data, it was possible to conclude that the data does not follow a normal distribution.
Since the probit regression model assumes the underlying distribution is normal (Probit Regression, IDRE), the logistic model was chosen to carry out the regressions. Logistic regression sometimes called the logistic model or logit model, analyzes the relationship between multiple independent variables and a categorical dependent variable, and estimates the probability of occurrence of an event by fitting data to a logistic curve. Binary logistic regression is typically used when the dependent variable is dichotomous and the independent variables are either continuous or categorical (Park, 2013). The logit equation is as follows:
𝜌𝑖 =
1
25
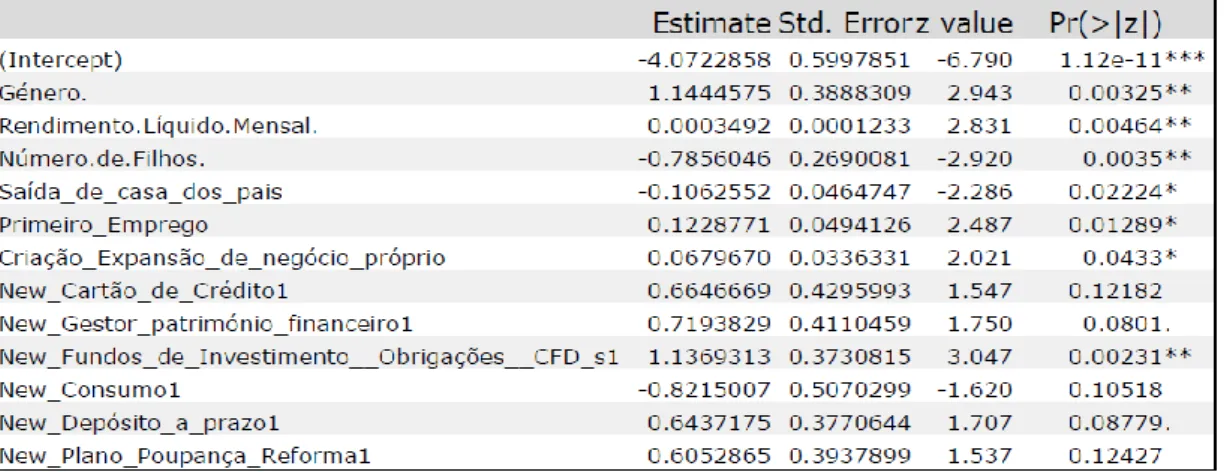
The tests were run to every new variable and the three most relevant to each P&S were chosen to perform the clustering analysis. Two examples can be seen in Figures 10 and 11. For instance, on Figure 10, it is possible to see that the three most relevant variable are the “New_Fundos_de_Investimento” (Participation in investment funds), “Género” (Gender) and “Número de filhos” (Number of children).
Source: Survey
Gráfico 8 – Esperança de vida e esperança de
vida sem incapacidade aos 65 anos para mulheres em Portugal
Figure 10 – Logit regression on “Housing loans”
Source: Survey
Gráfico 7 – Esperança de vida e esperança de
26
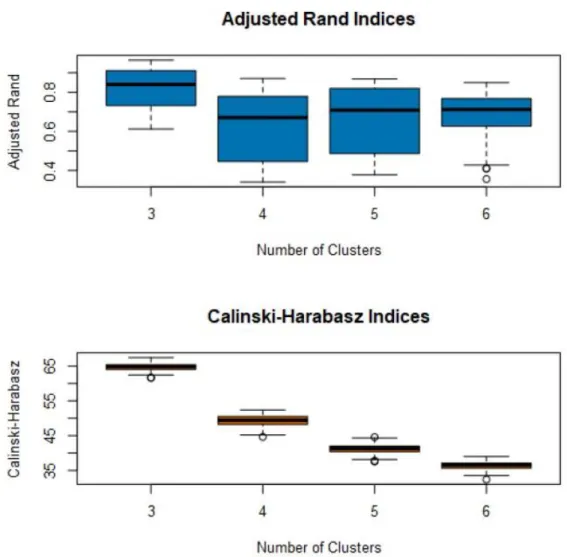
The first approach to the clustering analysis is the diagnosis. The Alteryx Diagnosis tool assesses the appropriate number of clusters to specify, given the data and the clustering method – K-Means is the method chosen in this project (K-Centroids Diagnostics Tool, Alteryx Documentation). The user sets a range of desirable clusters (within the scope of this work, the range was set between three and six clusters). The tool produces qualitative information for each number of clusters, through two indices, the Adjusted Rand and the Calinski-Harabasz. These indices serve as indicators for cluster quality. The Adjusted Rand Indice according to Santos (2009).
“The Adjusted Rand Index (ARI) is frequently used in cluster validation since it is a measure of agreement between two partitions: one given by the clustering process and the other defined by external criteria.”
Further, Yeung, Ka Yee. and. Ruzzo, Walter L. (2001), explain that
“The Rand index lies between 0 and 1. When the two partitions agree perfectly, the Rand index is 1.”
27
The Calinski-Harabasz, according to Liu, Y., Li, Z., Xiong, H., Gao, X., & Wu, J. (2010, December) “[…] evaluates the cluster validity based on the average between- and within cluster sum of squares.”
For both indices, the greater their average value and the lower the interquartile range, the best the number of clusters fit the data (Desgraupes, 2013). As stated in Figure 12, the best number of clusters for the dataset was three.
28
In both indices, the greatest value observed had respect to three clusters, meaning that a partition of the data in three implied that there were different patterns with significant differences between them. Figure 12 was the tentative that exhibited the best values (See Annex D for one of the failed tests).
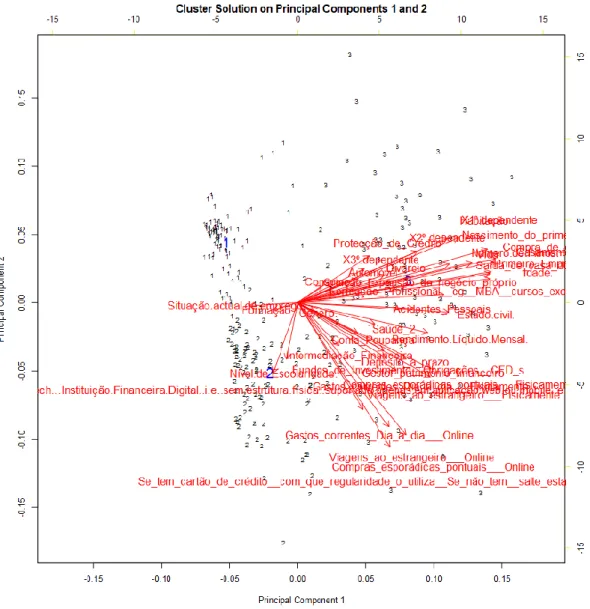
After selecting the appropriate number of clusters, the K-Means algorithm was run and the three clusters obtained – Figure 13.
Source: Survey
Gráfico 9 – Esperança
de vida e esperança de vida sem incapacidade
aos 65 anos para mulheres em Portugal
29
Regarding Figure 13, it is possible to notice the three clusters. Cluster 1 and Cluster 2 are significantly condensed, which is very positive, and also well separated. Cluster 2 shows a bigger level of dispersion than Cluster 1, although still relatively small. Cluster 3 is quite dispersed throughout the data, although very separated from Clusters 1 and 2, meaning that there really are different consumption and demographic patterns among the database. Cluster 1 and 2 depict clear patterns, well concentrated, while cluster three doesn’t portray a clear, well defined pattern, rather consumption behaviours different from most of the observations, including a few outliers.
Figure 13 – Cluster solution on principal components 1 and 2
Source: Survey
Gráfico 10 – Esperança
de vida e esperança de vida sem incapacidade
aos 65 anos para mulheres em Portugal
30
The final step before the model development was appending the clusters to the database, that is, each inquire was allocated to the correspondent cluster, performed with the aid of the Alteryx Append Cluster tool (the tool appends the observation with the respective cluster, embedding into the dataset).
The three clusters obtained show different demographic characteristics and different consumption patterns. Cluster 1 include 89 observations, while 2 and 3 have 100 and 88, respectively.
Cluster 1 is 80% married, with more than one child. Uses the credit card actively, as Cluster 2, and 40% have portfolio managers. Almost 100% have a car (Seguro Automóvel), as opposed to Clusters 2 and 3, with 60% and 40% having a vehicle, respectively. Regarding investments, Cluster 1 invests more, although the difference is not relevant. Cluster 1 exhibit a strong consumption behavior, with more P&S subscriptions than Clusters 2, which also has higher values than Cluster 3.
Figure 14 – Clusters characteristics
Source: Survey
Gráfico 11 – Esperança
de vida e esperança de vida sem incapacidade
aos 65 anos para mulheres em Portugal
31
Regarding the model per se, it comprises three phases:
Phase One: The Score model - in which specific information of an individual is inserted, such as marital status, number of children, events etc, and through multipliers associated with each input, the model places the individual into the matching cluster.
Phase Two: The Crossmatch – the model crossmatches the cluster typical P&S wallet with the individual’s own products, resorting to excel formulas, flagging products or services that the client doesn’t have.
Phase Three: The Output - the model crossmatches the cluster average age of acquisition of such products (new variable calculated previously) with the age of the individual. The model outputs the flagged P&S with average age of acquisition is within the interval “age of the individual - 5 < age of the individual + 5”, being so a probable future need for the client, thus optimizing his/her propensity for consumption.
With this model, financial institutions can better understand and, most importantly, can anticipate their clients’ needs. This knowledge will allow them to personalize the offer of P&S to each clients in a more adequate way, thus improving their customer service and their relationships with customers.
32
5.
Results and Conclusions
The present work addresses an analysis of the behaviour of the consumer of financial P&S, an issue with increasingly importance in the financial industry, particularly within the banking sector.
The purpose of the work is therefore the conceptualization of the aspects of one's life related to the need to purchase financial P&S, and is also the development of a predictive model which aids in the estimation of a person's future financial necessities (and in the optimization of the propensity to consume financial products and services). This project's scope is in accord with the KPMG Advisory guidelines and business model.
Regarding the development of the project, several tools were employed:
The online survey tool, SurveyMonkey, whose purpose was to obtain a solid database, providing the foundation for all analysis procedures. The MS Office tools, Excel, PowerPoint and Word, provided with the interface for the entire project workflow, supporting the creation of tables, graphics and figures exhibited throughout this text, as well as enabling the design and the implementation of the model. Lastly, the employment of the Alteryx software, in which all statistical operations and computation presented in this project were performed.
The survey consists of 24 questions, placed under three sections - demographic, financial and event questions.
The objective of the survey was to build a broad database, to avoid hindering the development and possible outcomes associated with the research. Only seven questions, out of the 24, were not considered relevant to the project, mostly due to the time constraints set at the beginning. The remaining questions provided quality data, therefore enabling further work.
As a side note, it is worth to mention that the removed questions could potentially complement and further the analysis to the extent of arriving to new insights and conclusions regarding the life cycle - financial needs framework.
33
The answers to the survey originated a database with a total of 277 observations and 62 variables (answers to the questions). The database provided support in every stage of the project, although exhibiting a few frailties, due to the small number of observations and the homogeneity of the data. Although being an early and preliminary study, a greater number of observations and a wider distribution of the survey could improve the outcomes both in quality and quantity, especially regarding the cluster analysis.
The life stage hypothesis based on the KPMG analysis was verified within the dataset. It is possible to separate the observations in four life stages, with different demographic characteristics, products bought and different needs; especially concerning the "Young Adult" stage; although being not so common within the life stage subject, it currently is a realistic concept, at least within the dataset. The difference between Adult and Child is not so clear nowadays, as young people generally study until their mid twenties, thus deserving its own stage – the “Young Adult”, as they have a specific set of needs and a particular financial behaviour. Another important result is the KPMG financial needs study that also is verified within the dataset, in which one of its main conclusions is the relationship between the life cycle and the financial necessities, that is, the needs are different in each life stage, therefore the importance of modelling this relationship.
As for the development of the model, it started with the data transformation, in order to prepare the data for the cluster analysis. Then, due to the sensitivity of the K-Means algorithm (general to all data partition algorithms) in relation to the Variables/Observations ratio, a reduction of variables was made - the most relevant ones were chosen, taking into account financial products, using logit regressions, with these products as dependent variables.
After analyzing clusters with the chosen variables, the optimal number was in 3 partitions, with different consumption behaviours of financial products. For the purposes of the model, clusters were analyzed, in demographic terms and events that have already witnessed and chosen the main differentiating factors of each cluster. These differentiating factors constituted the inputs section of the model -
34
that is, it is based on these variables, multiplied by weights calculated for each cluster, that the model allocates each person to a cluster.
Finally, the current subscriptions of each person are compared to the common subscriptions of the respective cluster, and the template selects the most common cluster products that the client does not have, revealing a product that the customer is likely to need.
In this way, it is possible to state that, in view of this preliminary study, there are still several issues within the topic to be explored, such as the introduction of new factors that may influence consumer decision-making, such as risk attitudes. Another future development concerns the size of the database. A considerable size of the database, with more heterogeneous data, would improve the results obtained.
35
References
American Institute for Learning and Human Development. The 12 Stages of
Life. [online] Available at:
http://www.institute4learning.com/resources/articles/the-12-stages-of-life/ [Accessed 29 Mar 2018]
Alteryx Community. [online] Available at: https://community.alteryx.com/ [Accessed 15 May 2018]
Alteryx Documentation. K-Centroids Diagnostics Tool. [online] Available at: https://help.alteryx.com/current/K-Centroids_Diagnostics.htm/ [Accessed 20 Jun 2018]
Alteryx. The Leading Platform for Self-Service Data Analytics. [online] Available at: https://www.youtube.com/user/alteryx/ [Accessed 24 May 2018]
Armstrong, T. (2007), – The human odyssey. Navigating the twelve stages of
life. New York, Sterling Publishing Co., Inc.
Bogin, B., & Smith, B. H. (1996), – Evolution of the human life cycle, || American
Journal of Human Biology: The Official Journal of the Human Biology Association, 8(6), 703-716.
Callanan, T. P., Guo, L. & Jeske, D. R. (2011), – Identification of key drivers of Net Promoter Score using a statistical classification model, || in Efficient
Decision Support Systems-Practice and Challenges From Current to Future. InTech.
Desgraupes, B. (2013), – Clustering indices. University of Paris Ouest-Lab
Modal’X, 1, 34.
Embrechts, M. & Santos, J. M. (2009, September), – On the use of the adjusted rand index as a metric for evaluating supervised classification, ||
in International Conference on Artificial Neural Networks (pp. 175-184). Springer, Berlin, Heidelberg.
Gao, X., Li, Z., Liu, Y., Wu, J & Xiong, H. (2010, December), – Understanding of internal clustering validation measures, || in Data Mining (ICDM), 2010
IEEE 10th International Conference on (pp. 911-916). IEEE.
Gelman, A., & Hill, J. (2007), – Data analysis using regression and
multilevel/hierarchical models, chapter 25. Cambridge university press.
Institute for Digital Research and Education. Probit Regression | Stata Data
Analysis Examples. [online] Available at:
https://stats.idre.ucla.edu/stata/dae/probit-regression/ [Accessed 16 May 2018]
36
Ismail, M. A. & Selim, S. Z. (1984), – K-means-type algorithms: A generalized convergence theorem and characterization of local optimality, || IEEE
Transactions on pattern analysis and machine intelligence, (1), 81-87.
MathWorks. Calinski Harabasz Evaluation. [online] Available at:
http://www.mathworks.com/help/stats/clustering.evaluation.calinskiharabas zevaluation-class.html/ [Accessed 14 Jun 2018]
Park, H. (2013), – An introduction to logistic regression: basic concepts to interpretation, || in Journal of Korean Academy, 43(2),154-164.
Ruzzo, W. L. & Yeung, K. Y. (2001), – Details of the adjusted rand index and clustering algorithms, supplement to the paper an empirical study on principal component analysis for clustering gene expression
data. Bioinformatics, 17(9), 763-774.
Slater, C. L. (2003), – Generativity versus stagnation: An elaboration of Erikson's adult stage of human development, || Journal of Adult
Development, 10(1), 53-65.
Towards Data Science. Data Types in Statistics. [online] Available at:
https://towardsdatascience.com/data-types-in-statistics-347e152e8bee/ [Accessed 23 Apr 2018]
Silverman, S.G., Tuncali, K. & Zou, K.H. (2003), – Correlation and simple linear
regression. Radiology, 227 (3), 617-628.
37
Appendix
Appendix A. Survey
42
Source: Author
Gráfico 12 – Esperança
de vida e esperança de vida sem incapacidade
aos 65 anos para mulheres em Portugal
43
Appendix B. Data type transformation
Figure 17 – New data type of the survey’s answers
Source: Author
Gráfico 14 – Esperança
de vida e esperança de vida sem incapacidade
aos 65 anos para mulheres em Portugal
Source: Author
Gráfico 15 – Esperança
de vida e esperança de vida sem incapacidade
aos 65 anos para mulheres em Portugal
Figure 18 – Alteryx workflow for changing the data type
Source: Author
Gráfico 16 – Esperança
de vida e esperança de vida sem incapacidade
aos 65 anos para mulheres em Portugal
Figure 19 – Correlation
44 Figure 20 – Corr e la tio n t a b le S o u rce: A u th o r A p pe ndix C. Co rre la ti on Ta ble
45
Appendix D. Cluster Analysis
Figure 21 – Partition indicator: preliminary cluster analysis –
bad attempt
Source: Author
Gráfico 20 – Esperança
de vida e esperança de vida sem incapacidade
aos 65 anos para mulheres em Portugal
Figure 22 – Partition
indicator: preliminary cluster analysisSource: