Printed version ISSN 0001-3765 / Online version ISSN 1678-2690 http://dx.doi.org/10.1590/0001-3765201720160496
www.scielo.br/aabc | www.fb.com/aabcjournal
First Assessment of Carbon Stock in the Belowground Biomass of Brazilian Mangroves
DANIEL M.C. SANTOS¹,
², GUSTAVO C.D. ESTRADA¹, VIVIANE FERNANDEZ³, MARCIEL R.M. ESTEVAM¹, BRUNNA T. DE SOUZA¹ and MÁRIO L.G. SOARES¹
¹Universidade do Estado do Rio de Janeiro, Faculdade de Oceanografia, Departamento de Oceanografia Biológica, Núcleo de Estudos em Manguezais,
Rua São Francisco Xavier, 524, 4023-E, Maracanã, 20550-013 Rio de Janeiro, RJ, Brazil
²Faculdades São José, Escola de Saúde, Av. de Santa Cruz, 580, Realengo, 21710-232 Rio de Janeiro, RJ, Brazil ³Universidade Federal Fluminense/UFF, Centro de Estudos Gerais, Instituto
de Geociências, Departamento de Análise Geoambiental,
Av. Gal. Milton Tavares de Souza, s/n, Campus da Praia Vermelha, Boa Viagem, 24210-340 Niterói, RJ, Brazil
Manuscript received on July 27, 2016; accepted for publication on February 17, 2017
ABSTRACT
Studies on belowground roots biomass have increasingly reported the importance of the contribution of this compartment in carbon stock maintenance in mangrove forests. To date, there are no estimates of this contribution in Brazilian mangrove forests, although the country has the second largest area of mangroves worldwide. For this study, trenches dug in fringing forests in Guaratiba State Biological Reserve (Rio de Janeiro, Brazil) were used to evaluate the contribution of the different classes of roots and the vertical stratification of carbon stock. The total carbon stock average in belowground roots biomass in these forests was 104.41 ± 20.73 tC.ha−1. From that, an average of 84.13 ± 21.34 tC.ha−1 corresponded to the carbon stock only in fine roots, which have diameters smaller than 5 mm and are responsible for over 80% of the total belowground biomass. Most of the belowground carbon stock is concentrated in the first 40 cm below the surface (about 70%). The root:shoot ratio in this study is 1.14. These estimates demonstrate that the belowground roots biomass significantly contributes, more than 50%, to the carbon stock in mangrove forests. And the mangrove root biomass can be greater than that of other Brazilian ecosystems.
Key words: global climate change, Guaratiba State Biological Reserve, roots, Sepetiba bay, trench method.
Correspondence to: Mário Luiz Gomes Soares E-mail: mariolgs@uerj.br
INTRODUCTION
In recent decades, the scientific community has
issued several advances and alerts with regard to
global climate change, its implications, and its
origins (IPCC 2014). These changes have their
origin associated with the increasing emissions of
greenhouse gases (GHG) such as carbon dioxide, sulfur, and nitrogen oxides (IPCC 2014). According to the monitoring carried out by the US Oceanic and Atmospheric Administration Agency, atmospheric carbon concentration reached the 400 ppm mark in 2013 (NOAA 2013).
because of their large vegetal biomass as a major
reason (Brown et al. 1992, Vieira et al. 2008, Guo et al. 2010, Donato et al. 2011). It is estimated that
tropical forest ecosystems worldwide can store up to 193 PgC (Saatchi et al. 2011). Conversely, the loss of forest systems would imply the loss of the capacity to mitigate or reduce GHG concentration through organic carbon sequestration and stock (Harris et al. 2012, Zarin 2012), and it will contribute to additional emissions of carbon that
is stored in these systems. Therefore, various
forms of mitigation have been studied to reduce GHG concentration and/or emissions (IPCC 2014). Among them are those that use the conservation of vegetal biomass of forest ecosystems as carbon sinks and sequestrants (Cenamo et al. 2010, Soto-Pinto et al. 2010).
Mangrove forests have a tropical and subtropical distribution (Tomilson 1986, Schaeffer-Novelli
et al. 2000) and great potential as atmospheric carbon sinks and sequestrants (Siikamaki et al.
2012). Even though they occupy less than 1% of the
global tropical forest cover (Giri et al. 2011), these
forests can globally store 4.03 PgC (Twilley et al. 1992), 13.1 PgC (Alongi 2014) to 20 PgC (Donato
et al. 2011) of organic carbon. Both carbon stock and emission estimates based on the protection or
loss of this system still have great uncertainty. This
is because of the absence of information, both in relation to sequestration rates and carbon stocks
in these forests on global and local scale (Donato
et al. 2011). In addition, mangrove forests play an important role in the biogeochemical carbon
cycle as presented by Alongi and Mukhopadhyay (2015), Bouillon et al. (2008, 2003) and Twilley
et al. (1992), mainly due to its location in direct contact with the tides of the oceans, which provides an exchange of organic matter, with this adjacent
environment, different from other forest systems. According to Donato et al. (2011), carbon
is mostly stored in the sediments, aerial vegetal biomass, and belowground biomass in the
descending order. However recent studies suggest the importance of the carbon stock in the belowground biomass of mangrove forests (Abohassan et al. 2012), there are few estimates regarding this compartment (Komiyama et al. 2008). Among the estimates available in literature, a few are based on the use of trenches sampling, which despite being extremely labor intensive provide more accurate estimates for collecting larger volumes of roots than those provided by sampling based on core.
In Brazil, mangroves occur almost along the entire length of the Brazilian coast (Schaeffer-Novelli et al. 1990), stretching over 6,786 km (Schaeffer-Novelli et al. 2000). According to recent estimates, Brazil ranks second in the total area occupied by mangroves, with 1,071,083.74
ha (Magris and Barreto 2010), and has the largest
contiguous mangrove area in the world, with
742,400 ha (Nascimento Jr et al. 2013). Therefore,
the understanding of the contribution of Brazilian mangroves for carbon stock is fundamental to further understand the role of these forests on a global scale. Nevertheless, there is no estimate for the carbon stock in belowground biomass of these forests along the Brazilian coast.
Therefore, this study aims to present the first
estimate of carbon stock in belowground biomass of Brazilian mangrove forests, using mangroves located in southeastern Brazil as a case study. In addition to the quantification of the total belowground biomass, this study was also based on the following question: what is the contribution of the belowground biomass to carbon stock in mangrove fringes in the Sepetiba bay?
MATERIALS AND METHODS
STUDy AREA
The study area is located in the Sepetiba Bay
Guaratiba mangrove is protected under the Guaratiba State Biological Reserve. According
to the Köppen classification, the climate can be
divided into Aw, tropical hot and humid climate with a dry season in winter, typical of the lowland, and Af, tropical hot and humid climate without a dry season, characteristic of the adjacent slopes.
The average annual temperature is 23.5°C, and the
average annual rainfall is 1067 mm, with January
and March being the months with the highest rainfalls and June and August the driest ones. The
tidal regime is microtidal, with amplitude smaller than two meters. In the mangroves of Guaratiba, the innermost parts of the intertidal zones are only reached by spring tides, which create hypersaline
plains. Therefore, there is a structural development
gradient of the forest due to the reduction of tidal
flood frequency and increased salinity toward the
interior, characterizing three distinct physiographic types: fringe, basin, and transition with hypersaline
plains. The sampling sites are located between coordinates 23º 00’ 54”S; 43º 34’ 44”W and 23º 00’ 40”S; 43º 34’ 14”W.
Three mangrove species described for this
part of the Brazilian coast occur in the study area:
Avicennia schaueriana, Laguncularia racemosa,
and Rhizophora mangle. The fringe forests have
a living basal area contribution of 65.2% of A
schaueriana, 1.4% of L. racemosa, and 24% of
R. mangle (Estrada et al.2013). The basin forests
have a living basal area contribution of 55% of A.
schaueriana, 0.2% L. racemosa, and 31.4% of R.
mangle. The transition forests to hypersaline plains
have a living basal area contribution of 32.7%
of A. schaueriana and 46.5% of R. mangle. The
maximum diameter is 40 cm in fringe forest, where
this study was developed. The forest structure parameters, as density, mean DBH, mean height
and salinity are presented in table I.
METHODS
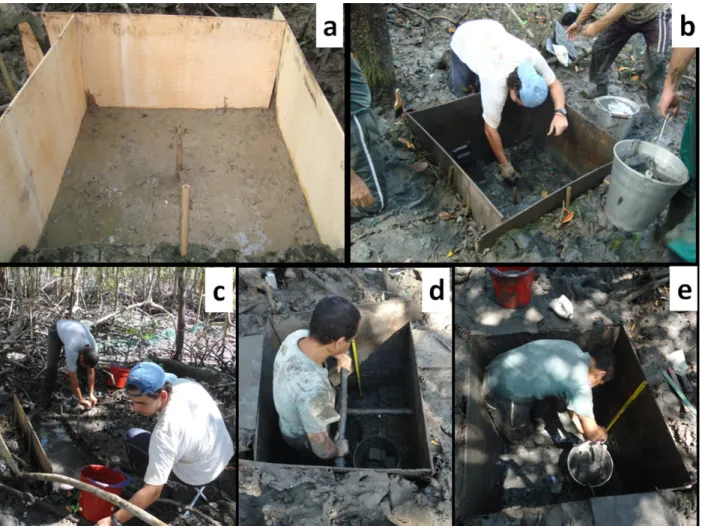
The belowground root biomass was estimated using trenches digging. This sampling method was
adopted because it allows more robust estimates as it evaluates a higher volume of sampled sediment in its entirety and reduces the loss of material (Komiyama et al. 1987). Five trenches with 1 m3 volume (1 × 1 × 1 m) were excavated (Figure
2). The trenches were all positioned in the fringe
forest on the margin of the Piracão river, located in the Guaratiba State Biological Reserve, and were placed approximately 150–200 m from each other,
covering approximately 1 km of the forest. The excavation was stratified into 10 strata of 10 cm each. The substrate removed from each stratum was
washed still in the study area, using a 1 mm mesh sieve. Roots were manually separated and cleaned from sediment excess and other organic debris.
The material screened in the field was taken to the
laboratory for a new wash in running water and full removal of the sediment using 0.25 mm mesh sieves. Roots were separated into the following diameter classes: less than 5 mm; between 5 and 10 mm; between 10 and 20 mm; between 20 and
50 mm and larger than 50 mm. This roots was not
separated in live and dead roots. Apart from these, pneumatophores were also collected and stocks
related to these structures were recorded in the first
stratum. The screened roots were stored and oven
dried at 70ºC to obtain the dry weight.
To transform biomass into carbon, the specific
carbon contents found by Rodrigues et al. (2014)
were applied: 42.6% for L. racemosa and A.
schaueriana and 40% for R. mangle. Because the
three species occur in Guaratiba’s fringe forests, it was necessary to apply the weighting method of the carbon content, considering the relative dominance of each species in terms of basal
area as described by Rodrigues et al. (2014). To
compare the results of this study to the literature that present only belowground or aboveground biomass, biomass was converted into carbon stock. For aboveground biomass the carbon content of
45% provided by Twilley et al. (1992) was applied,
and for belowground biomass the carbon content
of 40.8% proposed by Khan et al. (2007) was used. To improve reliability of these estimates,
structural characterization was performed in the vicinity of each trench. For each sampling point,
a 100 m² area plot was defined, with the trench
at its center. All plants with more than 1 m tall
were identified at the species level, tree heights were recorded with an optical rangefinder and the diameter measured at breast height (DBH; 1.30 m
above ground level) of all trunks was measured.
The trunks also had their status (dead or alive) verified. The average height, average DBH, and basal area were calculated for each plot. The relative contribution (%) in living and dead basal
area of each species was also calculated.
Subsequently, the basal areas of all the trunks of the plot were added, considering the class (type and condition) and converted to m2.ha−1.
RESULTS
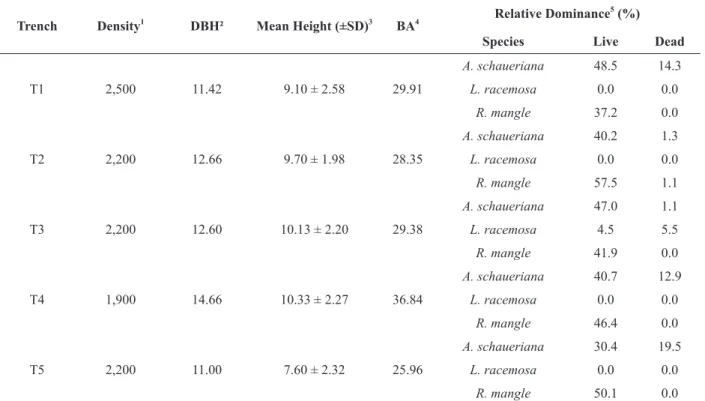
The structural parameters of the forest, where
the trenches were excavated, are consistent with those presented by Estrada et al. (2013), with trunk density ranging from 1900 to 2500 live trunks.ha−1,
TABLE I
Structures parameters and intertiscial salinity from diferents physiographic type of Guaratiba mangrove. (mean ± standart deviation). Data from Estrada et al.
(2013). Physiographic type Density (trunks. ha-1 ) Mean DBH (cm) Mean Height (m) Salinity
Fringe 5895 ± 9399 10.1 ± 3.8 7.4 ± 2.3 35.3 ± 7.3
Basin 10260 ± 8554 5.8 ± 2.0 5.0 ± 1.8 40.9 ± 7.5
the living basal area ranging from 25.96 to 36.84 m².ha−1, the average DBH ranging from 11.00 to 12.66 cm, the average height ranging from 9.10 ± 2.58 to 10.33 ± 2.27 m, and the contribution in basal area indicating co-dominance of A. schaueriana
and R.mangle (Table II).
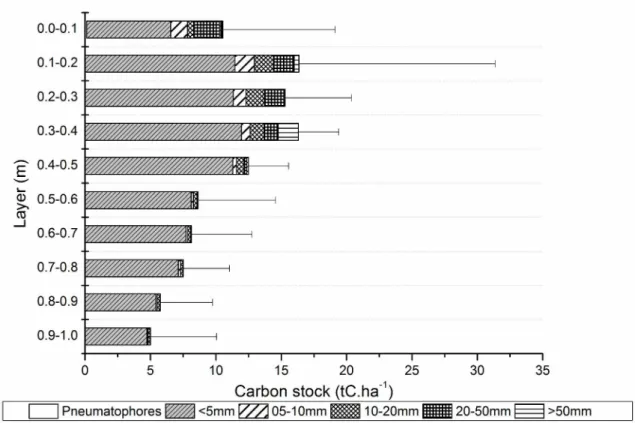
The carbon stock estimates for Guaratiba
mangrove belowground biomass ranged from 85.86 to 141.46 tC.ha−1, with an average of 104.41 ± 20.73 tC.ha−1. From this total, an average of 84.13 ± 21.34 tC.ha−1 corresponds to the carbon stock only in fine roots, with diameters smaller
than 5 mm. The pneumatophores compartment
presented a smaller carbon stock, averaging 0.13
± 0.13 tC.ha−1, which corresponds to less than 1%
of all the carbon stock. Fine roots contribute up to
70% of the total belowground biomass; however,
other authors have found smaller relationships of
approximately 13% to 47% (Castañeda-Moya et al. 2011) and between 46 and 60% (Komiyama et al. 1987). In this study the contribution of fine roots was superior, with approximately 80.1 ± 6.4%. In all strata, fine roots with diameters smaller than 5 mm accounted for over 60% of the belowground
biomass carbon stock, and in the lower strata
(deeper than 50 cm) this contribution reached more
than 90%.
Figure 2 - Excavation of the five trench to remove the belowground root biomass. The excavation was conducted with scale support
Most of the carbon stock is concentrated in the more superficial sediment layers, up to 0.4 m deep, and corresponds to more than 50% of the
belowground biomass carbon stock. However, the highest average of all strata is observed between 0.3 and 0.4 m, with 16.23 ± 3.14 tC.ha−1, which
corresponds to 15.56% of the belowground biomass stock (Figure 3). The ratio between belowground
root biomass stock and aboveground biomass stock (root:shoot) for the forests studied in Guaratiba is 1.14 based on estimates generated by Estrada et al. (2015) for the aboveground biomass carbon stock.
This corresponds to a contribution of 53% of the
carbon stock in plant biomass.
DISCUSSION
Belowground root biomass carbon stock in the world ranged from 0.5 tC.ha-1 to 263 tC.ha-1. The
average carbon stock in fringe forest of Guaratiba
mangroves was greater than about 80% of the
values found in the literature.
Table SIII (Supplementary Material) depicts
belowground biomass carbon stock values for
different regions worldwide. For studies in which
carbon stock values were not displayed, these were calculated using a more conservative approach, with
a rate of 40.8% of carbon in the dry biomass. The
stock estimated for Guaratiba was higher than that reported in most studies. However, other authors also found belowground biomass carbon stock values higher than those estimated for Guaratiba.
There are several factors that can regulate the
belowground biomass in mangrove forests, and consequently, the carbon stock associated with it.
These factors include the position of the sampling area in relation to the water body, i.e., the flood tide
frequency that the forest is subjected to, and the position in relation to the continent, i.e., if the forest is located in a more sheltered estuarine environment
TABLE II
Forest structure parameters of the plots measured around the trenches.
Trench Density1
DBH² Mean Height (±SD)3
BA4 Relative Dominance 5
(%)
Species Live Dead
T1 2,500 11.42 9.10 ± 2.58 29.91
A. schaueriana 48.5 14.3
L. racemosa 0.0 0.0
R. mangle 37.2 0.0
T2 2,200 12.66 9.70 ± 1.98 28.35
A. schaueriana 40.2 1.3
L. racemosa 0.0 0.0
R. mangle 57.5 1.1
T3 2,200 12.60 10.13 ± 2.20 29.38
A. schaueriana 47.0 1.1
L. racemosa 4.5 5.5
R. mangle 41.9 0.0
T4 1,900 14.66 10.33 ± 2.27 36.84
A. schaueriana 40.7 12.9
L. racemosa 0.0 0.0
R. mangle 46.4 0.0
T5 2,200 11.00 7.60 ± 2.32 25.96
A. schaueriana 30.4 19.5
L. racemosa 0.0 0.0
R. mangle 50.1 0.0
Footnote: 1(live trunks.ha-1
); 2
mean diameter at breast height (cm); 3
mean forest height (m); 4
basal area (m2
.ha-1
); 5
or in an open area with a higher marine influence (Sherman et al. 2003, Donato et al 2011).
On the basis of the extensive review of belowground roots and aboveground biomass values of various forest land types in the world, Cairns et al. (1997) demonstrated that the root:shoot ratio ranges from 0.05 to 0.70, with an average of 0.26, with most studies reporting values between
0.20 and 0.30. The root:shoot ratio for mangrove
forests, therefore, tends to be higher than that for terrestrial forests, which can be explained by the need for a greater support for aboveground biomass in unstable substrate (Komiyama et al. 2008) and by the possible increase in cambial activity induced by ethylene production in immersion conditions
(yamamoto et al. 1995). Further studies in other
ecosystems in Brazil, show that BGB in mangrove systems may be higher than in other. For example, Ribeiro et al. (2011) shows much lower values for Brazilian Savanna (Cerrado) than this study,
even the mangroves occupying a much smaller
area than Cerrado, wich occupies about 20% of Brazilian territory (MMA 2007). This distinctive
feature of mangroves explains the importance of the belowground biomass as a carbon reservoir in that ecosystem, when compared with other forest
systems. This shows that the carbon stock rates, in
mangrove forest biomass, are considered high in relation to several others ecosystems (Cairns et al. 1997).
Thus the conservation of these forests allows
the maintenance of carbon stock in the forest biomass. However, recent human activities have contributed to the degradation of these ecosystems (Ellison and Farnsworth 1996). In addition to these threats, mangroves are also threatened by possible climate changes (Soares et al. 2011). Processes of deforestation and degradation of these forests will allow the release of the carbon stock in the biomass as well as that stored in the sediment.
This means high amounts of carbon released
into the atmosphere through decomposition and
bioavailability processes.The conservation of
forest ecosystems of mangroves, as well as other ecosystems, allows a consequent maintenance of the carbon stock in the plant biomass (Harris et al. 2012, Zarin 2012).
The root:shoot ratio in carbon stock ranges from 0.21 to 1.55 (Komiyama et al. 2008). The
values found here are within this range, but the contribution of belowground biomass for carbon
stock in Guaratiba is greater than 90% of the
values found in literature. However, most recently Zhila et al. (2014) found a lower contribution of
carbon stock of belowground biomass with 1.3%
equivalent to 0.01 root:shoot ratio.
Salinity can reduce the root biomass of non
halophytes plants (Bernstein and Kafkafi 2002).
However this is inversely in halophytes,for these plants, increased salinity induces the growth of roots and the reduction of salinity inhibits roots´ growth
(Bernstein and Kafkafi 2002). The root:shoot ratio can also be influenced by porewater salinity, where
there may be a reduction of the aboveground biomass in relation to belowground biomass (Bernstein and
Kafkafi 2002). This is to compensate for the soil
conditions and reduce the need for nutrients and water by reducing the aerial part and increasing the biomass of roots to increasing the uptake of water
and nutrients (Bernstein and Kafkafi 2002).
The highest concentration of carbon stock in the first layers of sediment was also found by Khan
et al. (2007) other mangrove forests in the
Indo-Pacific region. Donato et al. (2012) also reported
a similar behavior for other mangroves where the
stock tends to markedly decrease after the first 40 cm depth. The belowground biomass can be divided
into compartments according to the diameter of the root (Komiyama et al. 1987), and consequently its carbon stock too. In a mangrove forests in southern
Thailand over 50% of total root biomass was allocated in the fine roots (<2 mm diameter), the
ratio ranged from 46.4% to 66.4%, which shows a high root biomass of fine roots (Komiyama et al.
1987). Zhila et al. (2014) found a contribution of
27% and 37% of fine roots in carbon stock of the
total forest biomass.
The fine roots in mangroves are concentrated
in lateral branches that arise from perennial roots.
The fine roots with diameters smaller than 2
mm are the primary source of water and nutrient uptake by plants and play an important role in the ecosystem, since without them the nutrients could not be absorbed and many inorganic and organic compounds have their cycles incomplete or damaged (Chalermchatwilai et al. 2011).
CONCLUSIONS
This study presented the first carbon stock
estimates for the belowground biomass in
southwestern Atlantic mangrove forests. The
values found for Guaratiba, ranged from 85.86 to 141.46 tC.ha−1, with an average of 104.41 ± 20.73 tC.ha−1 (southeastern Brazil) are within the range reported in the literature, being compatible with the
highest estimates presented for other regions. The
trench sampling method, although very laborious, is considered, in the literature (Komiyama et al.
1987), more reliable and efficient because with this
method there is practically no loss of material due to limitations of sampling in addition to the more representative volume of sampled material.
Although the aboveground biomass presents relevant participation in the mangrove forest carbon stock, the belowground biomass contribution has proven to be increasingly important as new studies are conducted showing that the ratio of aboveground and belowground biomass can be
less than 1:1. That is, the belowground biomass can contribute more than 50% of the total biomass
This first carbon stock estimate of the
belowground biomass of Brazilian mangrove forests
begins to fill a huge gap of knowledge regarding
this country›s contribution to the mitigation of global warming, particularly considering that Brazil has the second largest area coverage of
mangroves in the world. More efforts should be
made to ensure that new estimates arise and allow not only the reduction of the uncertainty of the national inventory of carbon emissions but also the understanding of the carbon stock variability in this compartment in local, regional, and latitudinal scales.
ACKNOWLEDGMENTS
We thank to Empresa Brasileira de Pesquisa Agropecuária (EMBRAPA) - Agroindústria de Alimentos for field support and Fundação Carlos
Chagas Filho de Amparo à Pesquisa do Estado do Rio de Janeiro (FAPERJ) for funding the study.
REFERENCES
ABOHASSAN RAA, OKIA CA, AGEA JG, KIMONDO JM AND MCDONALD MM. 2012. Perennial Biomass Production in Arid Mangrove Systems on the Red Sea Coast of Saudi Arab. Environ Res J 6(1): 22-31.
ALONGI D. 2014. Carbon Cycling and Storage in Mangrove Forests. Annu Rev Mar Sci 6: 195-219.
ALONGI D AND MUKHOPADHyAy SK. 2015. Contribution of mangroves to coastal carbon cycling in low latitude seas. Agr Forest Meteorol 213: 266-272.
BERNSTEIN N AND KAFKAFI U. 2002. Root Growth Under Salinity Stress. In: Plant Roots: The Hidden Half. Waisel y, Eshel A and Kafkafi U (Eds). Marcel Dekker, p. 787-805.
BOUILLON S, FRANKIGNOULLE M, DEHAIRS F, VELIMIROV B, EILER A, ABRIL G, ETCHEBER H AND BORGES AV. 2003. Inorganic and organic carbon biogeochemistry in the Gautami Godavari estuary (Andhra Pradesh, India) during pre-monsoon: The local impact of extensive mangrove forests. Global Biogeochem Cy 17(4). Online. DOI: http://dx.doi.org/10.1029/2002GB002026. BOUILLON S ET AL. 2008. Mangrove production and
carbon sinks: A revision of global budget estimates. Global Biogeochem Cy 22(2). Online. DOI: http://dx.doi. org/10.1029/2007GB003052.
BRIGGS SV. 1977. Estimates of biomass in a temperate mangrove community. Aust J Ecol 2: 369-373.
BROWN S, LUGO AE AND IVERSON LR. 1992. Processes and lands for sequestering carbon in the tropical forest landscape. Water Air Soil Pollut 64: 139-155.
CAIRNS MA, BROWN S, HELMER EH AND BAUMGARDNER GA. 1997. Root biomass allocation in the world’s upland forests. Oecologia 111: 1-11.
CASTAÑEDA-MOyA E, TWILLEy RR, RIVERA-MONROy VH, MARX BD, CENAMO MC, PAVAN MN, BARROS AC AND CARVALHO F. 2010. Guia sobre projetos de REDD+ na américa latina. Manaus, Brasil, 96 p.
CHALERMCHATWILAI B, POUNGPARN S AND PATANAPONPAIBOON P. 2011. Distribution of fine-root necromass in a secondary mangrove forest in Trat province, Eastern Thailand. Science Asia 37: 1-5.
DONATO DC, KAUFFMAN JB, MACKENZIE RA, AINSWORTH A AND PFLEEGER AZ. 2012. Whole-island carbon stocks in the tropical Pacific: Implications for mangrove conservation and upland restoration. J Environ Manage 97: 89-96.
DONATO DC, KAUFFMAN JB, MURDIyARSO D, KURNIANTO S, STIDHAM M AND KANNINEN M. 2011. Mangroves among the most carbon-rich forests in the tropics. Nature Geosci 4: 293-297.
ELLISON AM AND FARNSWORTH EJ. 1996. Anthropogenic Disturbance of Caribbean Mangrove Ecosystems: Past Impacts, Present Trends, and Future Predictions. Biotropica 28(4a): 549-565.
ESTRADA GCD, SOARES MLG, CHAVES FO AND CAVALCANTI VF. 2013. Analysis of the structural variability of mangrove forest through the physiographic types approach. Aquat Bot 111: 135-143.
ESTRADA GCD, SOARES MLG, FERNANDEZ V AND ALMEIDA PMM. 2015. The economic evaluation of carbon storage and sequestration as ecosystem services of mangroves: a case study from southeastern Brazil. Int J Biodivers Sci Ecosyst Serv Manage 11(1): 29-35. GIRI C, OCHIENG E, TIESZEN LL, ZHU Z, SINGH A,
LOVELAND T, MASEK J AND DUKE N. 2011. Status and distribution of mangrove forests of the world using earth observation satellite data. Global Ecol Biogeogr 20(1): 154-159.
GOLLEy F, ODUM H AND WILSON R. 1962. The structure and metabolism of a Puerto Rican red mangrove forest in May. Ecology 43: 9-19.
GOLLEy FB, MCGINNIS JT, CLEMENTS RG, CHILD GI AND DUEVER MJ. 1975. Mineral Cycling in a Tropical Moist Forest Ecosystem. Georgia Univ. Press, Athens, 248 p.
A comparison of three methods. Forest Ecol Manag 259: 1225-1231.
HARRIS NS, BROW S, HAGEN SC, SAATCHI SS, SALAS W, HASEN MC, POTAPOV PV AND LOTSCH A. 2012. Baseline map of Carbon Emission from Deforestation in Tropical Regions. Science 336(6088): 1573-1576.
IPCC. 2014. Climate Change 2014: Synthesis Report. Contribution of Working Groups I, II and III to the Fifth Assessment Report of the Intergovernmental Panel on Climate Change [Core Writing Team, Pachauri RK and Meyer LA (Eds)]. IPCC, Geneva, Switzerland, 151 p. KAUFFMAN JB, HEIDER C, COLE TG, DWIRE KA
AND DONATO DC. 2011. Ecosystem Carbon Stocks of Micronesian Mangrove Forests. Wetlands 31: 343-352. KHAN MNI, SUWA R AND HAGIHARA A. 2007. Carbon
and nitrogen pools in a mangrove stand of Kandeliaobovata (S., L.) yong: vertical distribution in the soil–vegetation system. Wetl Ecol Manag 15: 141-153.
KHAN MNI, SUWA R AND HAGIHARA A. 2009. Biomass and aboveground net primary production in a subtropical mangrove stand of Kandelia obovata (S., L.) yong at Manko Wetland, Okinawa, Japan. Wetl Ecol Manag 17(6): 585-599.
KOMIyAMA A, HAVANOND S, SRISAWATT W, MOCHIDA y, FUJIMOTO K, OHNISHI T, ISHIHARA S AND MIyAGI T. 2000. Top/root biomass ratio of a secondary mangrove (Ceriopstagal forest). Forest Ecol Manag 139: 127-134.
KOMIyAMA A, MORIyA H, PRAWIROATMODJO S, TOMA T AND OGINO K. 1988. Forest primary productivity. In: Ogino K and Chihara M (Eds), Biological System of Mangrove. Ehime University, p. 97-117. KOMIyAMA A, OGINO K, AKSORNKOAE S AND
SABHASRI S. 1987. Root biomass of a mangrove forest in southern Thailand. 1. Estimation by the trench method and the zonal structure of root biomass. J Trop Ecol 3: 97-108.
KOMIyAMA A, ONG JE AND POUNGPARN S. 2008. Allometry, biomass, and productivity of mangrove forests: A review. Aquat Bot 89: 128-137.
KUSMANA C. 1997. An Estimation above and below-ground tree biomass of a mangrove forests in East Kalimantan, Indonesia. J Biol Resour Manag 2(1): 20-26.
MACKEy AP. 1993. Biomass of the mangrove Avicennia marina (Forsk.) Vierh near Brisbane, south-eastern
Queensland. Aust J Mar Fresh Res 44(5): 721-725. MAGRIS RA AND BARRETO R. 2010. Mapping and
assessment of protection of mangrove habitats in Brazil. Panam J Aquat Sci 5(4): 546-556.
MATSUI N. 1998. Estimated stocks of organic carbon in mangrove roots and sediments in Hinchinbrook Channel, Australia. Mangroves Salt Marshes 2: 199-204.
MMA - MINISTÉRIO DO MEIO AMBIENTE. 2007. Áreas Prioritárias para Conservação, Uso Sustentável e Repartição de Benefícios da Biodiversidade Brasileira: Atualização - Portaria MMA n°9, de 23 de janeiro de 2007. Ministério do Meio Ambiente, Secretaria de Biodiversidade e Florestas. – Brasília: MMA, 301 p. NASCIMENTO JR WR, SOUZA-FILHO PWM, PROISy
C, LUCAS RM AND NOAA - NATIONAL OCEANIC E ATMOSPHERIC ADMINISTRATION. 2013. Trends in atmospheric carbon dioxide. Acessed http://www.esrl. noaa.gov/gmd/ccgg/trends/.
RAy R ET AL. 2011. Carbon sequestration and annual increase of carbon stock in a mangrove forest. Atmos Environ 45(28): 5016-5024.
RIBEIRO SC, FEHRMANN L, SOARES CPB, JACOVINE LAG, KLEINN C AND GASPAR RO. 2011. Above- and belowground biomass in a Brazilian Cerrado. Forest Ecol Manag 262(3): 491-499.
RODRIGUES DP, HAMACHER C, ESTRADA GCD AND SOARES MLG. 2014. Variability of carbon content in mangrove species: Effect of species, compartments and tidal frequency. Aquat Bot 120: 346-351.
SAATCHI SS ET AL. 2011. Benchmark map of forest carbon stocks in tropical regions across three continents, P Natl Acad Sci USA 108( 24): 9899-9904.
SCHAEFFER-NOVELLI y, CINTRÓN-MORELO G, ADAIME RR AND CAMARGO M. 1990. Variability of mangrove ecosystems along the Brazilian Coast Estuaries 13: 204-218.
SCHAEFFER-NOVELLI y, CINTRÓN-MOLERO G, SOARES MLG AND DE-ROSA T. 2000. Brazilian mangroves. Aquat Ecosys Health and Manag 3: 561-570. SHERMAN ER, FAHEy JT AND MARTINEZ P. 2003.
Spatial Patterns of Biomass and Aboveground Net Primary Productivity in a Mangrove Ecosystem in the Dominican Republic. Ecosystems 6: 384-398.
SIIKAMAKI J, SANCHIRICO JN AND JARDINE SL. 2012. Global economic potential for reducing carbon dioxide emissions from mangrove loss. P Natl Acad Sci USA 109(36): 14369-14374. DOI: www.pnas.org/cgi/ doi/10.1073/pnas.1200519109.
SOARES MLG, ALMEIDA PMM, CAVALCANTI VF, ESTRADA GCD AND SANTOS DMC. 2011. Vulnerabilidade dos Manguezais da Região Metropolitana do Rio de Janeiro Face às Mudanças Climáticas. In: Megacidades, Vulnerabilidades e Mudanças Climáticas: Região Metropolitana do Rio de Janeiro – Instituto Pereira Passos, p. 259-289.
TAMAI S, NAKASUGA T, TABUCHI R AND OGINO K. 1986. Standing biomass of mangrove forests in southern Thailand. J Jpn Forest Soc 68: 384-388.
TAMOOH F, HUXHAN M, KARACHI M, MENCUCCINI M, KAIRO JG AND KIRUI B. 2008. Below-ground root yield and distribution in natural and replanted mangrove forests at Gazi bay, Kenya. Forest Ecol Manag 256: 1290-1297.
TOMILSON PB. 1986. The Botany of Mangrove. Nova york (Ny): Cambridge University Press, p. 419.
TWILLEy RR, CHEN RH AND HAGRIS T. 1992. Carbon sinks in mangroves and their implications to carbon budget of tropical coast ecosystems. Water Air Soil Pollut 64: 256-288.
VIEIRA SA ET AL. 2008. Estimation of biomass and carbon stocks: the case of the Atlantic Forest. Biota Neotrop 8(2). Online. DOI:
http://dx.doi.org/10.1590/S1676-06032008000200001.
yAMAMOTO F, SAKATA T AND TERAZAWA K. 1995. Physiological, morphological and anatomical responses of
Fraxinus mandshurica seedlings to flooding. Tree Physiol
15: 713-719.
ZARIN DJ. 2012. Carbon of Tropical Deforestation. Science 336: 1518-1519.
ZHILA H, MAHMOOD H AND ROZAINAH MZ. 2014. Biodiversity and biomass of a natural and degraded mangrove forest of Peninsular Malaysia. Environ Earth Sci 71: 4629-4635.
SUPPLEMENTARY MATERIAL
TABLE SIII - World mangroves carbon stock on belowground