Mass Spectrometry Study of Ammonia Formed During Plasma Nitrocarburizing and
Nitriding Processes
Paola Egerta* , Heloisa Regina Turatti Silvaa, Carlos Viana Spellerb, Jayr de Amorimc, Allan Seeberd
Received: February 20, 2018; Revised: May 16, 2018; Accepted: June 08, 2018
In this work, we used mass spectrometry to investigate ammonia (NH3) formed during the
nitrocarburizing and nitriding processes of α-Fe sintered and low alloy steel by using d.c. glow discharges in different N2/H2/CH4 gas concentration mixtures. Experiments were conducted using two
different configurations: one to collect and analyze species probed primarily in the bulk of the plasma, at a position distant from the heated sample; and the other to collect and analyze species very close to the reactive surface of the heated sample in such a way as to allow the analysis of lower concentration or residence time species, formed at the plasma/sample surface interface. Use of these configurations contributed to the investigation of the physical chemistry involved in the above plasma processes.
An exchange the expected stoichiometry in ammonia formation in N2/H2/CH4 mixtures, with a shift
towards higher nitrogen consumption, is observed and is interpreted an indication of nitrogen removal from the surface associated with ammonia and carbonitrides/nitrides formation. The present results point to the existence of a correlation between the nitrocarburizing and nitriding processes with respect to the formation of non-stoichiometric ammonia as a product.
Keywords: ammonia synthesis, nitrocarburizing, nitriding, plasma, glow discharge, mass spectrometry.
*e-mail: [email protected]
1 Introduction
Plasma nitrocarburizing and nitriding are thermochemical processes. In the former, nitrogen and carbon atoms diffuse into the surface of a ferrous substrate heated below the lower critical temperature, forming a compound layer and a subsurface diffusion layer, whereas in nitriding only nitrogen atoms are introduced into the subsurface matrix. These treatments change significantly the mechanical properties of the material surface, such as wear resistance and corrosion
and micro hardness, without changing the performance
characteristics of the material core.
Although considerable information is available, a complete understanding of the absorption mechanisms of carbon and nitrogen atoms presented in the literature for the plasma nitrocarburizing and nitriding process remains an open question. Nitrocarburizing and Nitriding are complex processes depending on many parameters. The plasma used for treatments is a very rich and reactive medium. A large number of chemical species and a considerable number of reactions continuously taking place within it and which involve different physic-chemical processes, such as ionization, neutralization, excitation, charge transfer, decomposition,
are to be considered in any attempt at modeling. The analysis of the chemical reactions of these species in the plasma atmosphere and with the surface of the material to be treated becomes rather difficult and leads to different mechanisms of atom absorption into the metal surface during the process. A good example in this respect is given by Sun and Bell1
in a modeling work on plasma nitriding of low alloy steels.
Nitrogen and carbon atoms are amongst the species
efficiently formed in the plasma used for nitrocarburizing. These species can be very reactive and their chemistry leads to an improvement in the diffusion of atoms into the ferritic matrix, even at temperatures lower than those used in conventional treatments. In addition to their reactivity, the ion bombardment onto the substrate surface along with the fast neutrals is responsible for heating the substrate to the processing temperature.
From the different mechanisms proposed so far to explain plasma processes, such as nitriding, carburizing or nitrocarburizing, we can reasonably infer that nitrogen and carbon mass transfer during plasma treatment is the result of competition and accumulated effects of various reactions. In these, several intermediate species may be involved through gaseous and gas-surface reactions. During
aUnidade Acadêmica das Ciências da Produção, Construção e Agronegócio, Universidade do Sul de
Santa Catarina, 88137- 270, Palhoça, SC, Brasil
bDepartamento de Engenharia Mecânica, Laboratório de Materiais - LABMAT, Universidade Federal
de Santa Catarina, 88040-900, Florianópolis, SC, Brasil
cDepartamento de Física, Instituto Tecnológico de Aeronáutica-ITA, 12228-900, São José dos Campos,
SP, Brasil
dEngenharia de Energias Renováveis e Meio Ambiente, Universidade Federal do Pampa, 96400-100,
carburizing in plasma-enhanced processes in H2, for instance, it has been suggested2,3 that carbon radicals (CH
x) and ions (CHx+) contribute to carbon transfer to the ferritic matrix
following their adsorption and decomposition on the surface. In nitrocarburized samples, Li and Manory4 detected the presence of hydrogen, which they attributed to the presence of CHx (x = 1-3) species. The authors claim that in the initial
nucleation stage, radicals of the type CHx close to the surface
will be bound to the surface by chemisorption to initially form the unstable intermetallic compound FeNCHx, and finally
form stable carbonitrides ε-Fe2-3(CN)1-x and γ′-Fe4(CN)1-x. In an attempt to study the nitriding process in N2-H2 mixtures
using mass spectrometry, Szabo and Wilhelmi5 detected mass/charge ratios to which they assigned FeNH2-3 species.
They postulate that the interaction of these intermetallic compounds with the sample surface would form iron nitrides with greater stability that diffuse into the sample resulting in ammonia formation, which is finally released into the plasma.
In the present work, we restrict our efforts to the study of
NH3, thus giving continuity to our previous investigation of
the nitriding process. We previously carried out preliminary
nitriding experiments6,7, in which the formation of ammonia
was observed in the gas phase, consistent with the results obtained by Szabo5 for the nitriding process. Furthermore,
a correlation was found between the ammonia profile and the surface Fe-nitride diffusion layer. In the present work,
the investigation of ammonia formation was extended to the
plasma nitrocarburizing process. As in the previous works, to
satisfy our concern in the diagnosis of the nitrocarburizing and nitriding processes, mass spectrometry was used to
investigate neutral species formed during the process in N2/ H2/CH4 gas mixtures.
2 Material and Methods
2.1 Reactor, vacuum system and general
conditions
The present experimental system is basically the same as the once conceived by Seeber8 in our laboratory, with some
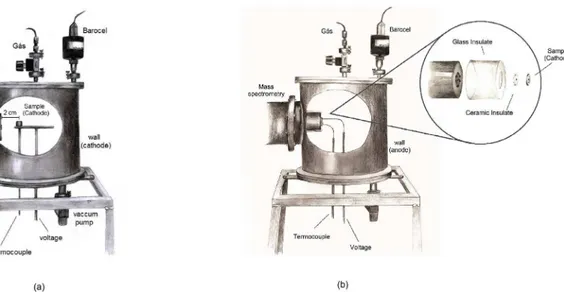
modifications. The nitrocarburizing and nitriding process were performed in a cylindrical plasma reactor (Figure 1) of AISI 304 stainless-steel (18-20 % wt Cr; 8.0-10.5 % wt Ni; other minority components, including 0.08 max C, 2.0 max Mn and 1.0 max Si), supplied with two transparent windows (not shown in the figure), normally used for visual observation
of the discharge and for spectroscopic measurements, and
a flange connection for a mass spectrometer.
The top and bottom steel plates were sealed to the body with O-rings and held connections for the gas inlet, vacuum manifold, electrodes and sensors (temperature and pressure). A valve in series with a two stage mechanical rotary pump was used to pump the reactor volume down to approximately
1 Pa (~10(-2) Torr) and maintain pressure inside at the desired
values during the experiment. The cathode was constituted by the sample substrate to be treated and the anode by the walls of the reactor.
The nitrocarburizing and nitriding process were performed at a pressure and temperature of 400 Pa (3 Torr) and 550°C, respectively. A membrane manometer was used to measure the pressure inside the reactor and the sample temperature was given by a thermocouple. N2 (purity 99.999 %), H2 (purity
99.999 %) and CH4 (purity 99.995%) were dynamically
mixed with varied mixing ratios. To control the introduction of gases, separated flowmeters were used. Moreover, the relation of pumping speed to gas flow (the total value of
which in this work was equal to 3.3 cm3.s-1) was regulated
to keep the intended pressure constant in the reactor. Power transferred to the plasma was delivered by a square pulsed waveform d.c. power supply, with maximum voltage peak ranging from 400 to 700 V in steps of 100 V, and a maximum current of 5 A. The negative voltage output was connected to the cathode (sample) and the positive one (reactor walls) was grounded. The time of the pulse switched on could be varied from 10 to 240 µs with a total time on/ off of 240 µs, thus allowing the adjustment of the power transferred to the plasma. After the adjustment, the conditions remained constant for all the experiments in this work.
2.2 Diagnostics and sample configurations
A scanning electron microscope (SEM) (Philips XL30) with energy dispersive X-ray spectroscopy (EDX) was available for morphological analysis in the samples treated. The SEM micrographs were used for the microstructure evaluation as well as to measure the thickness of the carbonitride and nitride layers formed.
Infrared (IR) spectroscopy (SHIMADZU IR-408) coupled
to a condensation device was performed to identify some
of the species, like amines. The monitoring of most of the neutral chemical species formed during the process was carried out using a mass spectrometer (MS) (VG SXP Elite 600) coupled to the plasma chamber through a small conical orifice (∅=100 µm), and capable of analyzing mass to charge number ratios (m/z) from 1 to 600 u (unified atomic mass unit). Neutral species collected from the plasma reactor enters the MS, where they are ionized by electron impact, filtered and detected. The electron energy in the source may be varied to produce maximum ionization efficiency, which is typically done with 70 eV electrons, or used as a tool to discriminate possible ionic fragments presenting mass coincidence (different species for the identified mass) or when assigning the respective ion to the corresponding mother molecule (different mother molecules for the identified ion species). In the present experimental conditions, the molecular ion NH3
+
presented the most suitable conditions for the monitoring of the neutral species NH3. The ionization energy to produce NH3+ by electron impact on NH
3 is equal to approximately
10 eV9 and the electron energy in the ionization chamber
was fixed at 17.0 eV. This value was chosen to allow the
detection of NH3 while discriminating the contribution from OH+ ions (OH+ and NH
3
+ have both m/z=17 u), formed
from the dissociative ionization of the unavoidable residual
water with a corresponding appearance energy of about
18.0 eV9, and so higher than the electron energy used in
our experiment. Although the observed signal of NH3 + was
already considerably weak in the normal conditions of our experiment, and significantly lowered under this rigorous condition of the electron energy, due to the lowering of the
ionization cross section9,10, its identification was unambiguous.
An intermediary pumped chamber coupled between the quadrupole and the plasma chamber enabled the sampling
of gases at the desired pressure (400 Pa ≅ 3 Torr), which lie
well below the upper limit of the instrument (normally above
1300 Pa ≅ 10 Torr). The cylindrical head of the MS, located
inside the plasma chamber, was electrically insulated from the MS body by a ceramic ring, which was adequately protected against the formation of plasma arcs by a borosilicate glass tube. The vacuum in the two MS chambers was generated by two pumping systems, respectively, each consisting of a turbomolecular and a two-stage mechanical rotary pump in conjunction with a gate valve. Pressures in the MS chambers were measured with penning manometers.
Bulk configuration - In the first, named bulk configuration, a cylindrical sample of 0.8 cm in diameter and 0.5 cm thickness of pure iron (α-Fe) was placed on a vertical holder, approximately 2 cm from the MS gas collecting orifice, as shown in Figure 1a. In this mode, the species collected are primarily those extracted from the bulk of the plasma.
Surface configuration - In the second, named surface configuration, the sample to be treated had a hole in its center and was coaxially juxtaposed directly on the MS flange containing the gas collecting orifice (Figure 1b). In this case, when compared with the bulk configuration, the collection of the species formed in the cathode surface glow area is expected to be enhanced. The sample was thermally insulated from the metallic MS flange by very thin ceramic flat rings, thus minimizing undesirable heat loss from the sample (heated cathode) to the MS body. As plasma arcs were also observed sometimes on the edges of the screws holding the orifice flange, they also were protected by small ceramic tubes. Disk samples of 2.0 cm in diameter and 0.3 cm thickness with a conical hole of 0.05 cm in diameter at their center, of low alloy steel, were used in the surface configuration experiments.
2.3 General procedure
the figures represented a specific gas mixture composition. To ensure that the results were reproducible, each complete experiment was performed three times. However, each run corresponded to a new sample.
Because the total pressure was kept constant in a mixture containing three different gases, N2/H2/CH4, whenever the mixing ratio of the gas of interest was changed, the pressure
balance of one of the two other gases was necessarily performed with one of them fixed at a constant mixing ratio. The choice depended on the interest. As a general rule, when H2 was
used as the variable gas of interest, the mixing ratio of CH4
was fixed at 3 % vol or 0 % vol, for nitrocarburinzing and
nitriding, respectivamente, and N2 was used as balance gas; for the CH4 dependence study, N2 pressure was fixed at 80 %
vol and H2 pressure was varied for balance.
Uncertainty of mass peak intensity measurements was estimated to within a maximum of 10 %. Because each experiment required a complete preparation procedure (reactor opening, sample replacement, chemical cleaning, pumping down, gas mixture preparation, plasma cleaning), it was sometimes difficult to reproduce the same conditions inside the reactor with desirable accuracy and, consequently, the absolute intensities were not always repetitive enough to allow direct comparison between different spectra (different experiments). To facilitate a comparison between different spectra, the data in most figures were normalized (unless specified otherwise) to the highest peak intensity obtained in the set of points for each corresponding figure. This procedure was useful when comparing plot profiles for different conditions (plasma process, sample material, gas mixing ratio).
Basically, the same procedure was followed in the nitriding experiments, albeit remembering that in this case the
mixtures used did not contain CH4 (0 % vol CH4), i.e, N2-H2.
3 Results and Discussion
During the nitrocarburizing and nitriding plasma process
using N2/H2/CH4 and N2/H2 gas mixtures, respectively, we
have the formation of a number of chemical species that can be produced, not only in the gas phase but also at the substrate surface and on the reactor walls. As expected in this work, in addition to the chemical species of the introduced gases we detected and identified other species, such as NH3, HCN, C3H8, C4H10, and CH3NH2, derived from chemical reactions
occurring in the reactor. Except for CH3NH2 (methylamine,
detected by IR spectroscopy), all these species seem to be commonly observed in electrical discharges in N2/CH4/H2
gas mixtures at low pressures11,12. Higher order hydrocarbon
molecules, amines or cyanides were absent or very scarce. Nevertheless, except for NH3 and HCN, the complexity of
the obtained spectra and the feeble intensities found for most of the measured mass peaks at 17 eV electron energy made it difficult to investigate the identified molecules, yielding
unreliable results when the mixing ratio of the gas mixture was changed.
3.1 Nitrocarburizing
3.1.1 Dependence of NH3on H2
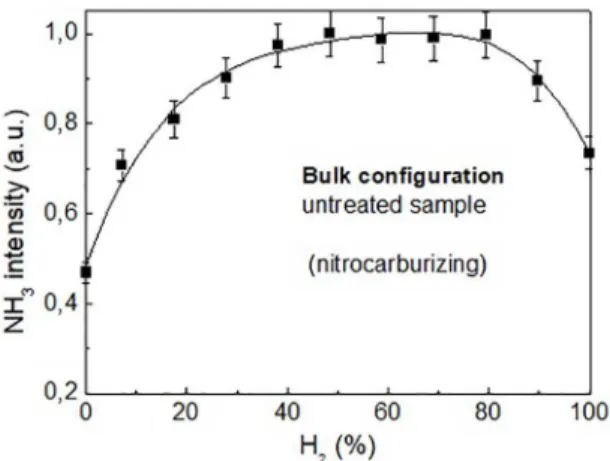
Figures 2 and 3 show the evolution of the ammonia
ion peak (NH3+) obtained for the two configurations during the increase of the hydrogen mixing ratio in the N2/H2/CH4
mixture. The amount of CH4 in the mixture was kept constant,
equal to 3 % vol, and the fraction of hydrogen was increased from zero to the maximum value allowed in the gas mixture,
when N2 decreased to 0 % vol.
As will be seen below, the results for NH3 were differed
significantly from one configuration to the other. A comparison of the results obtained with the two configuration modes allowed us to distinguish two groups of the same chemical species, one that was associated with the plasma bulk and
another associated with the substrate surface, suggesting
that the heated sample surface also influences and plays a role in the formation of ammonia.
Bulk configuration
When the bulk configuration was used with an initially untreated sample, the dependence of the NH3 intensity on the H2 volume fraction in the mixture showed a relatively
rapid increase up to around 20-30 % vol H2, followed
by a broad section exhibiting a slow increase between approximately 20-30 and 75-80% vol H2, finally decreasing
until 100 % vol H2 was achieved (Figure 2). The dispersion
of the data in Fig. 2 is small and a polynomial fit indicates a maximum trend value of approximately 70-80 % vol H2.
According to the literature13-16 on the heterogeneous ammonia
synthesis in plasma-chemical conversions containing N2 -H2 mixtures, different surfaces, including glass, iron and
steel, act as catalysts for ammonia formation, in a process that basically involves the formation of N, H, NH, NH2
and the catalyst surface. The balance of reaction equations
gives N2 + 3H2 → 2NH3 with an expected stoichiometry
N2:H2 = 1:3 (25 % N2:75 % H2) for NH3 formation through
reactions on the walls17-19. Previous results from different
authors, in different types of electrical discharges in N2-H2
mixtures yield the same stoichiometry, with slightly different profiles depending on the discharge type (e.g. Eremin et al15
in barrier discharge, Amorim et al.17 in dc glow discharge,
Uyama et al.18 in microwave plasma, or Bai et al19 in strong
electric field discharge at ambient pressure). However, as shown in Fig. 2, the observed dependence of NH3 on the H2
fraction in our methane containing mixture also displays a maximum of around 75 % vol H2, the stoichiometric value.
Moreover, the profile derived from the experimental results
from Amorim17, also in a dc glow discharge for nitriding,
and reported along with the fit of calculations11, compares
reasonably well with our plot in Figure 2.
However, we see that the first point in Fig. 2, for 0 % vol
H2, departed significantly from zero. This occurred with all the
data related to the NH3 vs. H2 measurements throughout this
work, particularly for low H2 fraction, suggesting that another
source of hydrogen may be involved in the measurements. It will be discussed in the CH4 dependence section that in
the discharge hydrogen can be easily formed by different reactions of electron impact on CH4 and by bimolecular reactions in N2-CH4 mixtures, and that this is likely to be
responsible for additional ammonia formation. This means that for low fractions of introduced hydrogen, and even for 0% vol hydrogen in the mixture, although to a lesser
extent, we have to consider its contribution to the formation
of ammonia. Furthermore, as remarked by Quandt20, after
applying hydrogen plasma cleaning in this reactor, adsorbed
H2 desorbs from the walls of the reactor and contributes to
ammonia formation at the beginning of the nitriding process. In her measurements, a minimum of approximately 30 min were necessary until the H2 level decreased significantly
before starting the measurements on nitriding.
Effects of the walls on conversion to ammonia related to the duration of the hydrogen plasma cleaning prior to
the N2-H2 discharges are discussed by Touvelle et al.14.
However, as will be shown, the results obtained regarding the surface configuration suggest the existence of a partial overlap of peaks in the bulk plot of Figure 2, indicating that
a second reaction path regarding the formation of NH3 and
possibly involving a higher consumption of nitrogen (lower
H2 fraction in the figure) might be present. As we will see
below, the use of the surface configuration yielded valuable results in support of this assumption.
Surface configuration
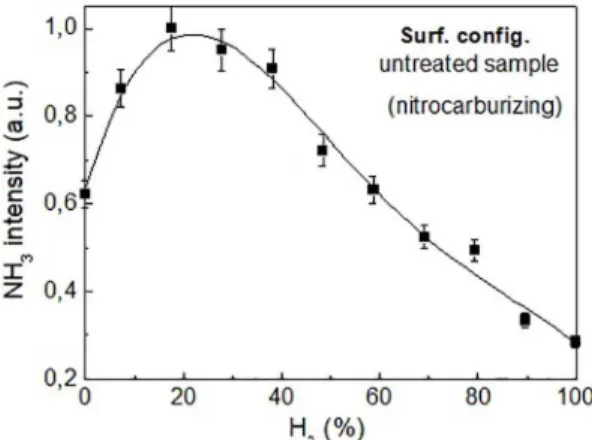
Untreated sample - The same measurements made using the bulk configuration were repeated with the surface configuration under the same conditions. As shown in Figure 3, when the chemical species were collected directly through the cathode orifice, i.e., very close to the cathode surface
chemistry region, the corresponding curve showed a unique
and sharper maximum approximately between 20 and 25 %
vol H2 (or 80-75 % vol N2). No peak corresponding to the expected stoichiometry N2:H2 = 1:3 was discerned while using
the surface configuration. The broad central section of the profile observed when the bulk configuration was used was no longer seen and ammonia formation at a much lower hydrogen concentration now clearly predominated over the expected
one corresponding to the known stoichiometry N2:H2 = 1:3,
i.e., resulting in a shift to much higher nitrogen consumption, with a corresponding volume ratio of N2:H2 ≈ 3:1.This shift
was observed whenever the surface configuration was used with an untreated sample and was attributed to the heated cathodic surface. A departure from N2:H2 stoichiometry for ammonia synthesis in N2-H2 mixtures was reported by
Eremim15 (N
2:H2=2:3) in an experiment with palladized Pd
wires wound over the inner electrode of a 500Hz wall-glass ozonizer. A tentative explanation was given on the basis
of N2+ ions being discharged on the surface to produce N
atoms, although the reason for the observed shift was not investigated.
Figure 3. Evolution of the ammonia ion peak (NH3+) obtained for the surface configuration
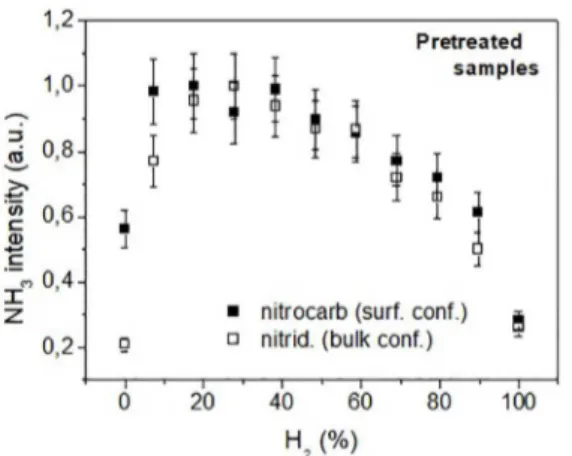
Pretreated sample - In an attempt to verify how the carbonitride layer formed during the nitrocarburizing process affected the measured ammonia profile, the same experiment
was repeated using a pretreated sample. The results are shown in Fig. 4.
When instead of an untreated sample one pretreated for two hours was used, a broad and irregular distribution was obtained. It may correspond two peaks presence. One
corresponds to the H2 mixing ratio equal to approximately
20-25 %, roughly the same value already obtained with the surface configuration for the untreated sample. The other was formed at approximately 70-80 %, the same mixing ratio
corresponding to the stoichiometric maximum observed with
the bulk configuration (Figure 2) also by using the untreated sample. Figure 4 suggests that when the surface of the sample
is pretreated, stoichiometric NH3 formation in the range of
observed in the untreated sample case, the modified surface tends to inhibit in part the synthesis of non-stoichiometric ammonia. Consequently, its intensity is reduced. Accordingly, and because in principle the synthesis of the stoichiometric ammonia (around 75 % vol H2) should not be affected by this to an important degree, both synthesis processes now
yielded comparable intensities for the configuration used. Indeed we observed that the absolute intensity of NH3 at
75 % vol H2 remained roughly the same (to within 20 %)
as that observed in the bulk configuration, as should be expected for the ammonia synthesized on the walls. Actually, given the relatively small ratio between the sample (non-stoichiometric related) and the reactor wall ((non-stoichiometric related) surfaces, the use of one or another configuration should not significantly affect the yield of the stoichiometric synthesis process. Nevertheless, it should be remembered that the present situation is physically different from that of the bulk configuration, where the cathode is far from the collecting orifice. Ultimately, the important difference lies in the fact that in the surface configuration the signal of the non-stoichiometric ammonia is enhanced, owing to the fact that this species is collected very close to the source that generates it, in practice even before it enters and effectively mixes itself into the plasma bulk space. This enhancement,
together with the fact that the aforementioned inhibition
is supposed to be partial for the sample pretreated for two hours, is probably the reason why Figure 4 still displays a reasonable yield of non-stoichiometric ammonia compared with the stoichiometric one while using a pretreated sample. As will be seen, the same behavior described for the pretreated sample in the nitrocarburizing process was also observed for the nitriding results (see Fig. 8-10, paragraph 3.2).
3.1.2 Dependence of (NH3, H2 and HCN) on CH4
The dependence of the formed ammonia was investigated
as a function of the methane mixing ratio in the N2/H2/CH4
mixture, under constant total pressure, as defined previously.
Furthermore, the same experiment, but with no addition of hydrogen to the mixture (N2-CH4 discharge), was conducted
to verify whether hydrogen generated from methane could be partially responsible for the detected ammonia. Finally,
the dependence of HCN on CH4 was also verified with both
configurations and, unlike the NH3 species, no difference
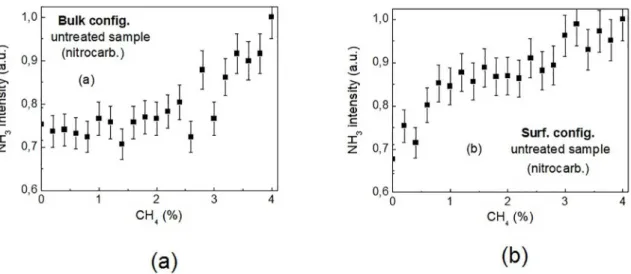
was observed in this case. i. NH3 vs. CH4
The results for the two configurations are shown in Fig. 5. The balance gas (H2) fraction in the mixture decreases as that of CH4 increases. The fraction of N2 is a constant
number (80%) and the intensity of NH3 is plotted versus [CH4]/ ([CH4] + [H2]), in %.
Once again, depending on the configuration used, the results for the ammonia formation reveal a different behavior.
In the bulk configuration, a constant region extends from zero to around 1.5-2.0 % vol CH4, followed by a continuous
increase up to 4 %. Unlike these results, when using the surface configuration an intermediary plateau is observed within approximately 1.5 and 2.5 % vol CH4, between the
initial and the end ascending parts of the curve. Except for the already observed distinct behavior of NH3 when using
one or another configuration, no conclusion could be clearly inferred from these results.
ii. H2 vs. CH4 and NH3 vs. CH4
Hydrogen can easily be formed by several dissociative ionization and dissociation reactions in methane by electron impact in the discharge, as well as by reactions with active
nitrogen12. To confirm whether hydrogen from methane
could be partially responsible for the detected ammonia,
the same experiment, but with no addition of hydrogen to the mixture (pure N2-CH4 discharge), was conducted in the
surface configuration. H2 vs. CH4 and NH3 vs. CH4 were measured in a mixture of N2 with variable CH4 (0-4 % vol).
The results are shown in Fig. 6a and 6b, respectively. Except for the beginning, close to the axis origin, where we observe a constant intensity value of up to approximately 0.3 % vol CH4, hydrogen increases linearly with CH4 up to
the maximum content (i.e. 4 % vol CH4). Accordingly, as expected, NH3 is also formed, though with a plateau less clear
than in the preceding measurements of ammonia (Fig. 5b), as shown in Figure 6b. This shows, albeit to a lesser extent,
that the contribution of hydrogen formed in the discharge
should also be taken into account in the ammonia formation
in the discharge, even when hydrogen is not introduced (pure N2-CH4 discharge). Moreover, Bai et al.21 reported the
non-catalytic synthesis of ammonia using N2-CH4 plasmas based
on a micro-gap discharge, with an average electron energy of 10 eV. A comparison of conditions in both discharges suggests that some ammonia synthesis is also possible in the present discharge.
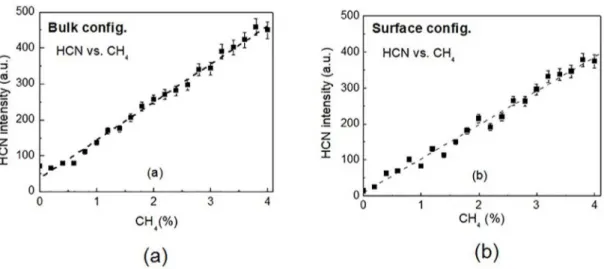
iii. HCN vs. CH4 Figure 4. Evolution of the ammonia ion peak (NH3+) obtained for
HCN is formed by fast reactions in a glow discharge
containing N2 and CH412 and was the most easily detected
species in our mass spectra. The presence of HCN together
with CH3NH2, deposited on the walls, was also confirmed
by IR spectrophotometry*. Its dependence on CH4 was also
investigated and the results are presented in Fig. 7. They are quite similar for both configurations, and no significant influence of the cathodic region is observed. This lends support to the claim that the distinct behavior observed between the results when using the two configurations is not applicable to all species detected and that in the present conditions it is believably a feature of the observed ammonia.
3.2 Nitriding
Similar and very plausibe results related to the present
nitrocarburizing ones were obtained when investigating
the nitriding of untreated sample of steel in the surface configuration, and pretreated sample of pure iron in bulk configuration. The results from the nitriding work of Szabo and Whilhelmi5 in steel will also be compared.
3.2.1 Nitriding: surface configuration - untreated
sample of steel
Using basically the same experimental system as described above, nitriding experiments with α-Fe were conducted7,22
using the surface configuration and untreated samples, under the same conditions used in the nitrocarburizing process. As
in the case of the nitrocarburizing study with as untreated
sample, when using the surface configuration a well-defined
Figure 5. Evolution of the ammonia ion peak (NH3
+) obtained as a function of the methane mixing ratio in the N
2/H2/CH4 mixture (a) Bulk configuration. and (b) Surface configuration
* According to Pintassilgo et al.12, HCN is easily deposited on the walls. Furthermore, three-body reactions involving the walls as third-body can convert HCN into H2CN.
Figure 6. (a) Evolution of the hydrogen ion peak (H2
+) obtained as a function of the methane mixing ratio in the N
2/CH4 mixture. and (b) Evolution of the ammonia ion peak (NH3
+) obtained as a function of the methane mixing ratio in the N
peak with a maximum value of around 20-30 % vol H2 was observed in the NH3 investigation. The two curves show very
similar profiles and compare very well with one another in the normalized mode, showing the same maximum value (Figure 8).
In other words, concerning the NH3 vs. H2 dependence,
no noticeable difference was discerned between the results in the nitrocarburizing or nitriding of α-Fe, in N2-H2-CH4 and N2-H2 mixtures, respectively.
3.2.2 Nitriding: bulk configuration - pretreated sample
of pure Fe
The experimental system was also used to investigate the nitriding of α-Fe, but now instead of an untreated sample and surface configuration, a pretreated sample and bulk configuration were used. The conditions used are the same of the nitrocarburizing process. Once more, the nitrocarburizing
in N2-H2-CH4 and the nitriding in N2-H2 mixtures presented
similar results concerning the dependence of the ammonia profile on the hydrogen fraction in the gas mixture. Indeed, in both experiments, the results with pretreated samples of α-Fe yielded the same trend, i.e., a broad distribution
of NH3, indicating a relatively high intensity of ammonia
formed in lower hydrogen concentrations, in addition to the stoichiometric one, around 30 % and 75 % respectively, as shown in Figure 9.
However, in the present case the bulk configuration was applied to the nitriding process, rather than the surface (as in nitrocarburizing). As noted in Section 3.1.1, the results found for the surface configuration when using a pretreated sample tend to approach those of the bulk configuration, displaying a broad distribution (Figures 2 and 4) where the two “types” of ammonia are present. Nevertheless, in the case of nitrocarburizing, more meticulous measurements were
Figure 7. Evolution of the HCN (ion peak (HCN+) obtained as a function of the methane mixing ratio in the N
2/H2/CH4 mixture (a) Bulk configuration. and (b) Surface configuration
Figure 8. Evolution of the ammonia ion peak (NH3
+) obtained for the surface configuration using an untreated sample, during nitriding
and nitrocarburizing process
made, and differences were then detected and investigated also using untreated samples.
Szabo and Wilhelmi5 also investigated the nitriding process in N2-H2 mixtures in a d.c. glow discharge, in 42CrMo4
steel, by mass spectrometry in similar conditions, although with a somewhat lower temperature (500 ºC) and higher pressure (700 Pa). As pointed out earlier6, their results tend
to support our assumption. The experimental assembly of the cathodic region seems to be equivalent to that of our surface configuration. Their measurements in the cathode molecular beam were limited to 60 % vol H2. Normalized to 1 (highest
peak intensity), to facilitate comparison** of the profile shapes, it can be seen in Fig.10 that in the common measured range and within the estimated uncertainty the curve of Szabo not only compares well with that of Egert6 (nitriding in N
2-H2
Figure 9. Evolution of the ammonia ion peak (NH3
+) obtained during nitriding (bulk configuration) and nitrocarburizing (surface configuration) process using a pretreated sample
in N2-H2-CH4 d.c. glow). Actually, Figure 10 corresponds
to the plot of Szabo’s data along with the data in Fig. 9 for the surface configuration of pretreated samples of Egert and Silva. The measurements of Szabo were performed during the nitriding treatment, which lasted for several hours. The treatment time of the cathode sample was not specified and, for our purpose, it was considered as a pretreated sample.
If we compare all the results for NH3 vs. H2 discussed
in this work, for both configurations and all the sample conditions, we find that the first part of the curve, up to approximately 40 % vol H2, is almost the same in all cases.
This corresponds to the part containing the non-stoichiometric ammonia peak. The difference in the profiles appears only
for H2 fraction values above 40 %, when the effects of the
stoichiometric ammonia begins to be significant and then introduces differences between the curves.
The existence of a second NH3 peak, at lower hydrogen
concentration, and which would be related to nitrogen consumption at the heated cathode surface during plasma nitriding or nitrocarburizing processes, was postulated by Egert et al.6 and later confirmed by Hansch et al.20 and by
Silva23. As in the nitrocarburizing process, the removal of
nitrogen from the surface, correlated to ammonia formation through a second reaction channel, would be responsible for
the observed departure from the known observed stoichiometry
for the ammonia formation. This is in agreement with Szabo and Wilhelmi5, who postulated the existence of another
reaction channel involving nitrogen removal on the hot sample surface and ammonia formation supposedly correlated to the nitriding process. In their measurements, they observed ions with m/z = 72 and 73 u among the plasma species, which
** Although they used an analogous configuration (with a cathode plate pierced by a pinhole), the comparison between these curves must be considered with some caution, since in Egert’s experiment NH3 molecules were collected and analyzed after ionization in the MS ionization chamber, whereas in the latter case they collected NH3
+ ions directly from the plasma. Therefore, we assume here that this will not invalidate a qualitative comparison
they attributed to the nitrogen-containing species FeNH2-3+,
and which would be intermediates in the formation of an unstable boundary layer of Fe2-4N as well as of NH3 at the
cathodic surface. These nitrides would be formed at the surface and ammonia would be released to the gas phase5:
Egert22 also supposedly detected a mass peak from FeNH 3 (FeNH3+) in nitriding experiments, but owing to difficulties
encountered due to its feeble intensity measured in the MS, the author could not investigate this species.
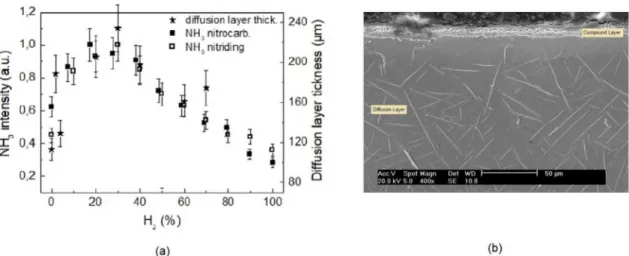
3.2.2.1 Comments on the diffusion layer thickness and
ammonia formation
In the previous short publication6 with preliminary results,
we pointed out a possible correlation between the ammonia formation and the diffusion layer thickness in the nitriding process when using the bulk configuration/pretreated sample. The maximum diffusion layer thickness is found at 70 % vol
N2 - 30 % vol H2, a value corresponding to the maximum obtained for NH3 density measured by mass spectrometry.
The measurements were made on a pretreated sample with the bulk configuration. At the time, we had not yet considered the hypothesis of the non-stoichiometric ammonia. In view of the mixture condition specified above and of the present results, it appears that the diffusion layer thickness will also show a maximum coincidence with the NH3 profiles for nitriding and nitrocarburizing shown in Figure 8 for
the surface configuration/untreated samples, and where the non-stoichiometric ammonia at 30 % vol H2 is predominant.
This supports our hypothesis, meaning that if the correlation mentioned above is to be considered valid it is very likely to be concerned with the non-stoichiometric ammonia.
We carefully reevaluated all the pertinent data originally obtained in the experiments. The results are shown in Figure 11a, where the scale of the diffusion layer thickness was adjusted for comparison of the profile maxima displayed in the figure.
The diffusion layer thickness data were averaged over 5 measurements taken at distinct points of the sample surface. Figure 11b shows the diffusion layer formed during the plasma nitriding process in a sample of sintered iron. Despite this, in a first approach, the distribution of these data points, particularly within the maximum portion of its corresponding profile, appears to display a trend similar to those of the
NH3 intensities for nitriding and nitrocarburizing when
using untreated samples. Therefore, it should be consistent with the idea of a correlation between the diffusion layer thickness and the non-stoichiometric ammonia formation.
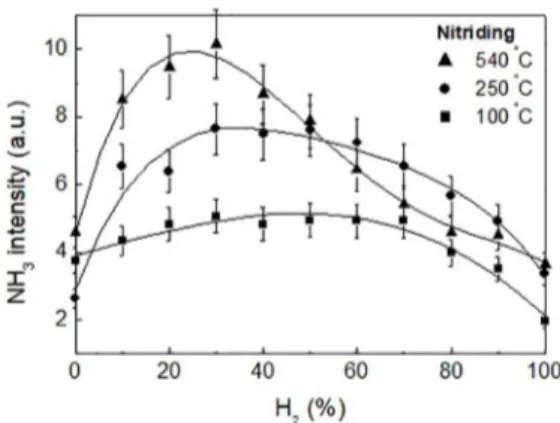
3.2.3 Temperature dependence of NH3
In the nitriding experiment (N2-H2 mixture) also measured the dependence of the ammonia formation on the H2 fraction
for three different temperatures in the steel cathode, namely 100, 250 and 540 ºC (Figure 12).
As noted in paragraph 3.2.1, surface configuration and untreated samples were used. Three distinct profiles were obtained. We clearly observed that as the temperature increased from 100 to 540ºC the ammonia maximum gradually shifted to the left, to lower hydrogen fractions in the mixture. The relative intensity of ammonia peaks also increased with the temperature. It is worth comparing these curves with the results obtained from the experiments of nitrocarburizing for different configurations and samples (bulk/untreated, surface/untreated and surface/pretreated). Indeed, at 100ºC the thermal effects of the cathode regarding surface treatment and the formation of non- stoichiometric ammonia are expected to be small or negligible. In this case, the preponderant source of ammonia is probably the heterogeneous catalysis through the reactor walls. One can see that the profile of this curve approaches that of Figure 2 for the bulk configuration with the untreated sample, also
Figure 11. Correlation between the ammonia formation and the diffusion layer thickness obtained during nitriding and nitrocarburizing process
interpreted in the nitrocarburizing as being mainly resulting from the catalytic ammonia from the reactor walls.
At 250ºC, the thermal effects of the cathode are likely to become significant and ammonia would arise from two different mechanisms, reactor walls and heated cathode. The 250ºC curve can be compared to that for the surface configuration with a pretreated sample (Fig. 4), which in our analysis represents this intermediary condition.
Finally, at 540ºC, the same temperature used for nitriding and nitrocarburizing in the surface configuration with untreated samples, the two curves (see Figure 3 and 12 at 540ºC) are very similar, indicating that the non-stoichiometric source of ammonia prevails. Once again, these curves showing the displacement of the ammonia maximum towards higher nitrogen consumption (lower hydrogen fraction) tend to
support the supposition of a second mechanism to form
ammonia. The temperature dependence of the ammonia intensity was also investigated for a given condition of the mixture, specifically 70 % vol N2-30 % vol H2. The NH3
intensity increases consistently and, as expected, the results are in agreement with those of Fig.12 for 30 % vol H2. The
temperature value found for the maximum ammonia intensity in this mixture is attained at around 400-450ºC (Figure 13).
Actually, it could correspond either to the beginning of a broad maximum (seems most likely) or to the beginning of a plateau. The lack of points above 450ºC makes it difficult to establish it. However, this maximum value is considerably higher than that measured by Botchway24 for the stoichiometric
ammonia formed by heterogeneous catalysis when using Fe surface as catalyst in N2-H2 glow discharges in similar conditions of pressure, and which was found to be around
Figure 12. Evolution of the ammonia ion peak (NH3
+) obtained during nitriding for three different temperatures in the steel cathode: 100, 250 and 540 ºC
4. Concluding Remarks
This paper is devoted to the study of ammonia synthesis during the nitrocarburizing and nitriding processes in d.c. glow discharges sustained in different N2-H2-CH4 and N2 -H2 gas mixtures, respectively, chiefly by means of mass
spectrometry. The experiments were conducted in two different configurations: one to collect and analyze species probed primarily in the bulk of the plasma, at a position distant from the heated cathodic sample, and the other to collect and analyze species probed very close to the reactive surface of the cathodic sample.
According to the literature, the NH3 synthesis in
plasma-chemical conversions containing N2-H2 mixtures results
mainly from heterogenous reactions on the reactor walls, with
an expected stoichiometry of N2:H2 = 1:3. However, when
using the surface configuration, we observed a departure from
the expected stoichiometry of ammonia formation, with a
well- defined shift towards higher nitrogen consumption, and resulting in a corresponding non-stoichiometric ratio N2:H2 ≈
3:1, in both plasma processes of this study. In this, the yield
Figure 13. Evolution dependency of the ammonia ion peak (NH3+) with the temperature of the steel cathode, during nitriding
of the ammonia synthesis observed was largely dominant over the stoichiometric one. The unexpected removal of nitrogen with such a large deviation from the equilibrium stoichiometry appears to be correlated to the ammonia synthesis through a second reaction channel occurring on the heated sample surface. The temperature dependence plots also support the connection of the non-stoichiometric ammonia synthesis with the heated sample surface, as the departure from the equilibrium stoichiometry tends to increase with the temperature, eventually attaining the non-stoichiometric profile N2:H2 ≈ 3:1 for T≈540ºC. On the other hand, unlike
what was observed in the case of the untreated sample, when the sample surface is pretreated it tends to inhibit partially the synthesis of non-stoichiometric ammonia.
Another aspect observed is that the results concerning the diffusion layer thickness point to a possible correlation between the non-stoichiometric ammonia formation and the diffusion layer thickness in the nitriding process. The maximum diffusion layer thickness was found at 70 % vol N2 - 30 %
vol H2. This value corresponds to the maximum obtained for NH3 density measured by mass spectrometry. Concerning the temperature dependence of the ammonia synthesis, it can be observed that the temperature increased from 100
to 540ºC and the ammonia maximum gradually shifted to lower hydrogen fractions in the mixture. The temperature dependence of the ammonia intensity was also investigated for a given condition of the mixture, specifically 70% vol
N2-30 % vol H2. The NH3 intensity increased consistently
and as expected, and the value found for the maximum ammonia intensity in this mixture was around 400-450ºC.
The results obtained also indicate that nitrocarburizing and nitriding processes have similar behavior concerning the non-stoichiometric ammonia formation.
These results are consistent with those of Szabo and Wilhelmi5, who postulated the existence of another reaction
channel involving nitrogen removal at the hot sample surface and ammonia formation supposedly correlated to the nitriding process.
We have described the experimental results obtained from empirical observations of the plasma treatment processes to arrive at the correlations that have been presented.
More detailed research concerning the morphological and microchemical is required to understand the physical chemistry involved.
5. Acknowledgements
results. The authors P. Egert and A. Seeber were supported by graduate grants from the CAPES (Coordination for the Improvement of Higher Education Personnel), and H.R.T. Silva by a graduate grant from the CNPq (National Council for Scientific and Technologicla Development). This work was partially supported by the Capes/Cofecub (Comité Français d'Evaluation de la Coopération Universitaire avec le Brésil) no. 233/98; and partially by Pronex (Programa de Apoio a Núcleos de Excelência)-CNPq, Brazil. We would like to express our thanks to the CAPES and CNPq for the financial support and grants.
6. REFERENCES
1. Sun Y, Bell T. A numerical model of plasma nitriding of low alloy steels. Materials Science and Engineering: A.
1997;224(1-2):33-47.
2. Edenhofer B, Gräfen W, Müller-Ziller J. Plasma-carburising - a surface heat treatment process for the new century. Surface and Coatings Technology. 2001;142-144:225-234.
3. Chen FS, Chang CN. Effect of CH4 addition on plasma nitrocarburizing of austenitic stainless steel. Surface and Coatings Technology.
2003;173(1):9-18.
4. Li S, Manory RR. Comparison of compound layer nucleation mechanisms in plasma nitriding and nitrocarburizing: the effect of CHn species. Journal of Materials Science.
1999;34(5):1045-1049.
5. Szabo A, Wilhelmi H. Mass spectrometric diagnosis of the nitriding mechanism in a d.c. glow discharge surface. Plasma Chemistry and Plasma Process. 1984;4(2):89-105.
6.. Egert P, Speller CV, Amorim J, Maliska AM. Mass spectrometric study of ammonia during the plasma nitriding process by a glow discharge. In: Proceedings of the 14th International Symposium on Plasma Chemistry; 1999 Aug 2-6; Prague, Czech Republic.
7. Quandt M, Egert P, Silva HRT, Speller CV. Investigation of ammonia formation and its involvement in the nitriding process.
In: Proceedings of the 6th Asia Pacific Conference On Plasma
Science And Technology (6th APCPST); 2002 Jul 1-4; Cheju,
South Korea.
8. Seeber A. Desenvolvimento de um sistema experimental para o estudo da interação plasma-superfície utilizando a técnica de espectrometria de massa. [Dissertation] Florianópolis: Universidade
Federal de Santa Catarina; 1997.
9. P.J. Linstrom and W.G. Mallard, Eds., NIST Chemistry WebBook, NIST Standard Reference Database Number 69, National Institute of Standards and Technology, Gaithersburg MD, 20899, doi:10.18434/ T4D303, Accessed 6 March 2017.
10. Touimi S, Jauberteau JL, Jauberteau I, Aubreton J. Plasma chemistry and diagnostic in Ar-N2-H2 microwave expanding plasma used for nitriding experiments. Journal of Physics D: Applied Physics.
2010;43(20):205203.
11. Ricard A, Gordiets BF, Pinheiro MF, Ferreira CM, Baravian G, Amorim J, et al. Diagnostic and modeling of N2-H2 discharges for iron nitriding. The European Physical Journal - Applied Physics.
1998;4(1):87-93.
12. Pintassilgo CD, Loureiro J, Cernogora G, Touzeau M. Methane decomposition and active nitrogen in a N2-CH4 glow discharge at low pressures. Plasma Sources Science and Technology.
1999;8(3):463-478.
13. Hong J, Prawer S, Murphy AB. Plasma catalysis as an alternative
route for ammonia production: status, mechanisms, and prospects for
progress. Sustainable Chemistry & Engineering. 2018;6 (1):15-31.
14. Touvelle M, Muñoz Licea JL, Venugopalan M. Plasma chemical synthesis. II. Effect of wall surface on the synthesis of ammonia.
Plasma Chemistry and Plasma Processing. 1987;7(1):101-108.
15. Eremin EN, Mal'tsev AN, Syaduk VL. Catalytic synthesis of ammonia in a barrier discharge. Russian Journal of Physical Chemistry.
1971;45(5):635-638.
16. Gordiets B, Ferreira CM, Pinheiro MJ, Ricard A. Self-consistent kinetic model of low-pressure N2-H2 flowing discharges: II. Surface processes and densities of N, H, NH3 species. Plasma Sources Science and Technology. 1998;7:379-388.
17. Amorim J, Baravian G, Sultan G. Absolute density measurements of ammonia synthesized in N2-H2 mixture discharges. Applied Physics Letters. 1996;68(14):1915-1917.
18. Uyama H, Matsumoto O. Synthesis of ammonia in high-frequency discharges. II. Synthesis of ammonia in a microwave discharge under various conditions. Plasma Chemistry and Plasma Process.
1989;9(3):421-431.
19. Bai MD, Bai XY, Zhang ZT, Bai M. Synthesis of Ammonia in a Strong Electric Field Discharge at Ambient Pressure. Plasma Chemistry and Plasma Process. 2000;20(4):512-520.
20. Quandt M. Formação de amônia durante o processo de nitretação por plasma. [Dissertation]. Florianópolis: Universidade Federal de
Santa Catarina; 2002. Available from: <http://www.tede.ufsc.br/ teses/PCEM0062.pdf>. (in Portuguese). Access in: 30/03/2017.
21. Bai MD, Zhang ZT, Bai XY, Gao H. Synthesis of Ammonia Using CH4/N2 Plasmas Based on Micro-Gap Discharge under Environmentally Friendly Condition. Plasma Chemistry and Plasma Process. 2008;28(4):405-414.
22. Ortiz PE. Estudo da nitretação por plasma: correlação plasma-superfície. [Thesis]. Florianópolis: Universidade Federal de Santa
Catarina; 2000. 148 f. Available from: https://repositorio.ufsc.br/ handle/123456789/79253 (in Portuguese). Access in: 16/03/2017.
23. Silva HRT. Estudo do processo de nitrocementação por plasma.
[Thesis]. Florianópolis: Universidade Federal de Santa Catarina; 2003. Available from: <http://www.tede.ufsc.br/teses/PCEM0069. pdf>. (in Portuguese). Access in: 16/03/2017.