HOW MUCH DEBT IS TOO MUCH DEBT?
AN EMPIRICAL ANALYSIS ON EMU COUNTRIES
Nuno Miguel Rodrigues Botelho
Dissertation submitted as partial requirement for the conferral of Master in Economics
Supervisor:
Prof. Doutora Sofia de Sousa Vale, Assistant Professor, ISCTE Business School Economics Department
Abstract
In the aftermath of the global financial crisis, and the subsequent sovereign debt crisis, the relationship between public debt and economic growth was put at the centre of economic policy discussions, specifically regarding the possible existence of a maximum public debt threshold after which economic growth would be severely impaired.
By analysing the short-run relationship between public debt and economic growth for a panel of 10 European Monetary Union (EMU) countries over a period of 22 years, from 1995 to 2016, our results suggest that, by following Reinhart and Rogoff (2010) rationale, the debt-to-GDP ratio threshold would be at 120%. Regarding the direction of causality, our results suggest that public debt causes economic growth in most of the countries analysed. However, by splitting the analysis between the pre-crisis and post-crisis periods, we found evidence that the global financial crisis had an effect in changing the causality in the debt-growth relationship. This analysis also showed that the causal relationship varies across countries. Finally, our threshold analysis provided evidence of a Laffer-curve (inverted U-shape curve) relationship between public debt and economic growth, for which we estimated a maximum public debt threshold around 86% debt-to-GDP ratio.
Considering our results and the current public debt levels, governments should pursue policies that allow the decrease of their level of indebtedness to improve economic perfor-mance.
JEL Classification: C33, E62, H63, O47
Keywords: Public debt; economic growth; Granger-causality; public debt threshold effects; panel data analysis; European countries.
Resumo
Na sequência da crise financeira global, e da subsequentemente crise das dívidas soberanas, a relação entre dívida pública e crescimento económico foi colocada no centro da discussão de políticas económicas, nomeadamente quanto à eventual existência de um nível máximo de dívida pública a partir do qual o crescimento económico seria severamente penalizado.
Ao analisar a relação de curto-prazo entre dívida pública e crescimento económico para um painel de 10 países da União Monetária Europeia (UME) durante um período de 22 anos, desde 1995 até 2016, os nossos resultados sugerem que, ao seguir o racional de Reinhart and Rogoff (2010), o rácio dívida-PIB limite seria de 120%. Relativamente à direção de causalidade, os nossos resultados sugerem que dívida pública causa crescimento económico na maioria dos países analisados. No entanto, ao segmentar a análise entre os períodos pré-crise e pós-crise, constatámos que a crise financeira global teve o efeito de alterar a causalidade na relação dívida-crescimento. Esta análise indicou também que a relação de causalidade varia entre países. Por fim, a análise de limites revelou a existência de uma relação curva-de-Laffer (Curva em forma de U invertida) entre dívida pública e crescimento económico, para a qual estimámos um limite de cerca de 86% rácio dívida-PIB.
Atendendo aos nossos resultados e aos níveis atuais de dívida pública, os governos devem conduzir políticas que permitam a redução do seu nível de endividamento de forma a melhorar o desempenho económico.
Classificação JEL: C33, E62, H63, O47
Palavras-Chave: Dívida pública; crescimento económico; causalidade de Granger; efeitos de limites de dívida pública; análise de dados em painel; países Europeus.
Acknowledgements
The love of a family is a life’s greatest blessing and I have been blessed by having such a wonderful family. Therefore, I would like to dedicate this master thesis to my mother and father for all the love, support, motivation and advice not only during the development of this research but also throughout my entire life. Thank you for everything, I owe it all to you.
To my supervisor Prof. Doutora Sofia de Sousa Vale for all the support and advice throughout the development of this research. Thank you for all your words of encouragement and guidance throughout this difficult but rewarding journey.
To all my friends that were always supportive and comprehensive of my commitment towards this research. Thank you for all the support, motivation, fun times and for under-standing the many moments that I could not be present.
Agradecimentos
O amor de família é a maior bênção da vida e eu fui abençoado ao ter uma família magnífica. Como tal, gostaria de dedicar esta tese de mestrado à minha mãe e ao meu pai por todo o amor, apoio, motivação e conselhos, não só durante o desenvolvimento desta investigação, como também durante toda a minha vida. Obrigado por tudo, eu devo tudo a vocês.
À minha orientadora Prof. Doutora Sofia de Sousa Vale por todo o apoio e conselhos durante o desenvolvimento desta investigação. Obrigado por todas as palavras de alento e orientação durante esta jornada difícil, mas gratificante.
A todos os meus amigos que sempre apoiaram e compreenderam o meu compromisso para com esta investigação. Obrigado por todo o apoio, motivação, tempos divertidos e por compreenderem os vários momentos em que não pude estar presente.
Contents
1 Introduction 1
2 Literature Review 3
2.1 Threshold Effects . . . 6
2.2 Causality . . . 11
3 Data and Methodology 14 3.1 Data . . . 14
3.1.1 Structural Considerations . . . 14
3.2 Methodology . . . 15
3.2.1 Reinhart and Rogoff (2010) Replication . . . 15
3.2.2 Causality . . . 15
3.2.3 Public Debt Thresholds . . . 17
4 Results 18 4.1 Reinhart and Rogoff (2010) Replication . . . 18
4.2 Causality . . . 20
4.2.1 Full Sample (1995-2016) Causality Analysis . . . 21
4.2.2 Pre-Crisis (1995-2006) Causality Analysis . . . 23
4.2.3 Post-Crisis (2007-2016) Causality Analysis . . . 26
4.2.4 Robustness Checks . . . 28
4.3 Public Debt Thresholds . . . 29
4.3.1 Threshold Estimation . . . 30 4.3.2 Robustness Checks . . . 30 4.4 Summary of Results . . . 32 5 Policy Implications 34 6 Concluding Remarks 37 References 42 Appendix 43
A Variables List 43
B Reinhart and Rogoff (2010) Replication 44
C Causality 44
D Public Debt Thresholds 51
List of Figures
1 Public Debt (% of GDP) from 1995 to 2016 . . . 1
2 Reinhart and Rogoff (2010) Replication Results . . . 19
3 Reinhart and Rogoff (2010) Enhanced Replication Results . . . 19
4 Public Debt evolution: Crisis’ Early Stages (1/2) . . . 35
5 Public Debt evolution: Crisis’ Early Stages (2/2) . . . 35
List of Tables
1 Public Debt⇒ Economic Growth (1995-2016): Dumitrescu and Hurlin (2012) Granger non-Causality test . . . 212 Public Debt ⇒ Economic Growth (1995-2016): Country-Specific Causality . 22 3 Economic Growth⇒ Public Debt (1995-2016): Dumitrescu and Hurlin (2012) Granger non-Causality test . . . 22
4 Economic Growth ⇒ Public Debt (1995-2016): Country-Specific Causality . 23 5 Public Debt⇒ Economic Growth (1995-2006): Dumitrescu and Hurlin (2012) Granger non-Causality test . . . 24
6 Public Debt ⇒ Economic Growth (1995-2006): Country-Specific Causality . 24 7 Economic Growth⇒ Public Debt (1995-2006): Dumitrescu and Hurlin (2012) Granger non-Causality test . . . 25
8 Economic Growth ⇒ Public Debt (1995-2006): Country-Specific Causality . 25 9 Public Debt⇒ Economic Growth (2007-2016): Dumitrescu and Hurlin (2012) Granger non-Causality test . . . 26
11 Economic Growth⇒ Public Debt (2007-2016): Dumitrescu and Hurlin (2012)
Granger non-Causality test . . . 27
12 Economic Growth ⇒ Public Debt (2007-2016): Country-Specific Causality . 27 13 Robustness Checks: Robust OLS and Fixed Effects . . . 28
14 Robustness Checks: Generalized Method of Moments . . . 29
15 Hansen (2000) Threshold Estimation . . . 30
16 Robustness Checks: Partial Derivative Approach . . . 31
17 Causality Results Full Sample: Summary . . . 32
18 Causality Results Pre-Crisis and Post-Crisis: Summary . . . 33
19 Public Debt Thresholds: Summary . . . 34
B.1 Reinhart and Rogoff (2010) Replication . . . 44
B.2 Reinhart and Rogoff (2010) Enhanced Replication . . . 44
C.1 Full Sample (1995-2016): Country-Specific Regressions (1/2) . . . 45
C.2 Full Sample (1995-2016): Country-Specific Regressions (2/2) . . . 46
C.3 Pre-Crisis (1995-2006): Country-Specific Regressions (1/2) . . . 47
C.4 Pre-Crisis (1995-2006): Country-Specific Regressions (2/2) . . . 48
C.5 Post-Crisis (2007-2016): Country-Specific Regressions (1/2) . . . 49
C.6 Post-Crisis (2007-2016): Country-Specific Regressions (2/2) . . . 50
D.1 Robustness Check: Ordinary Least Squares (OLS) . . . 51
D.2 Robustness Check: Least Squares Dummy Variables (LSDV) . . . 52
D.3 Robustness Check: Fixed Effects (FE) . . . 53
1
Introduction
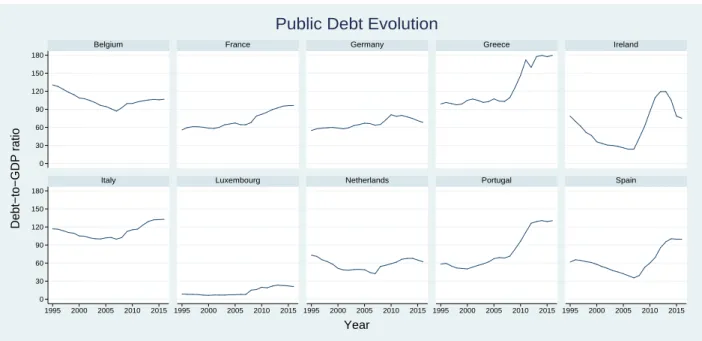
Conventional economic theory states that when an economy is depressed governments should intervene by increasing public expenditure to mitigate the negative effects of the downturn phase of the business cycle. Therefore, public debt is seen as a tool for governments to stabilize the economy and smooth business cycles (Puente-Ajovín and Sanso-Navarro, 2015). However, in the aftermath of the global financial crisis that started in 2007/2008, by ap-plying this recipe, with the implementation of stimulus packages and bailing out financial institutions, governments witnessed a sharp increase in their public debt levels (see Figure 1). 0 30 60 90 120 150 180 0 30 60 90 120 150 180 1995 2000 2005 2010 2015 1995 2000 2005 2010 2015 1995 2000 2005 2010 2015 1995 2000 2005 2010 2015 1995 2000 2005 2010 2015
Belgium France Germany Greece Ireland
Italy Luxembourg Netherlands Portugal Spain
Debt−to−GDP ratio
Year
Public Debt Evolution
Figure 1: Public Debt (% of GDP) from 1995 to 2016. Source: AMECO
With public debt levels presenting an upward trend while the economic context of the time was still unpredictable, the markets and creditors started to show confidence issues about the countries’ solvency, i.e. the countries’ ability to comply with their debt obligations, which was reflected by the higher interest rates demanded by creditors and also through lower credit ratings from the credit rating agencies. Therefore, the risk premium demanded by these economic agents dramatically increased for some European economies, e.g. Greece, Ireland, Italy, Portugal and Spain, which witnessed the steepest upward shifts in public debt after 2007 (as seen in Figure 1). This situation made more difficult for these countries to finance their economy with sustainable interest rates, which caused the need for the International Monetary Fund’s (IMF) bailouts to enter in the scene, and the global financial crisis evolved into the sovereign debt crisis in Europe. By this time, Reinhart and Rogoff (2010) had
already published their research claiming the existence of a maximum public debt threshold around 90% debt-to-GDP ratio, above which economic growth would be severely impaired, providing empirical support to the conviction that high levels of public debt were damaging to a country’s economic performance.
This research intends to shed light on the relationship between public debt and economic growth for a panel of 10 European Monetary Union (EMU) countries from 1995 to 2016. We started by replicating the work of Reinhart and Rogoff (2010) to assess whether the 90% debt-to-GDP ratio threshold holds for our dataset. Then, by following the literature about causality, we analysed the causal relationship between public debt and economic growth for the entire sample, to test whether the assumption of public debt causing economic growth was empirically valid, and also by distinguishing the periods before and after the start of the global financial crisis, to assess whether such event had an effect in changing this specific macroeconomic relationship. Finally, we used methodologies that allowed to endogenously determine public debt thresholds, such as the Hansen (2000) procedure, instead of using ad-hoc debt-to-GDP ratio ranges, similarly to Reinhart and Rogoff (2010).
Our replication exercises’ results suggest that the 90% debt-to-GDP ratio does not present a turning point for our dataset and, instead, such turning point would be at 120% debt-to-GDP ratio. The causality analysis’ results suggest that the causal relationship varies across countries and that the causality direction departed predominantly from public debt to economic growth in most of the EMU countries. Additionally, we found evidence that the global financial crisis had an effect in changing the causality in the debt-growth relationship for some of the countries analysed. Finally, our public debt threshold analysis provided evidence of a Laffer-curve type relationship between public debt and economic growth. This suggests the existence of a maximum public debt threshold, which we estimated to be at 85,67% debt-to-GDP ratio, after which additional public debt increments no longer provide a positive stimulus to economic growth.
This research contributes to the literature by integrating the analysis of three dimensions - Reinhart and Rogoff (2010) replication, causality and threshold effects analyses - of the relationship between public debt and economic growth. Additionally, these analyses were conducted upon a dataset composed by a more homogeneous set of countries within a time frame more closely related with the current economic context.
The remainder of this research is organized as follows. Section 2 provides a literature review of the most relevant and recent investigation concerning the relationship between public debt and economic growth. Section 3 presents the data and methodology used to analyse the different topics in this research. Section 4 provides the results and robustness
checks for each of the topics analysed. Section 5 draws some policy implications and Section 6 concludes this research.
2
Literature Review
The relationship between public debt (or government spending) and economic growth has been a concern for some economists for a long time. The problem of debt was first analysed by using theoretical models. However, treating debt in theoretical models may present some issues because debt can either be trivial or intractable (Cecchetti et al., 2011). In a closed economy model structure, debt would be trivial because the demand for loans would be equal to the supply of loans. Debt would be intractable because, if one considers all the factors that lead an economic agent to choose between debt and equity, the model would end up extremely complex to be treated. As a result, most of the literature follows an empirical approach.
Although the problem of debt appears to be difficult to deal with in theoretical terms, to better understand this issue, one has to be aware of the theoretical views on this matter. As such, Elmendorf and Mankiw (1999) survey, provided insights regarding two different theo-retical views on government debt: the "Conventional" view and the "Ricardian Equivalence" view. The "Conventional" view described the ideas held by most economists and politicians while the "Ricardian Equivalence" view described the ideas held by a minority of economists. According to Elmendorf and Mankiw (1999), the "Conventional" view states that the economy is Keynesian in the short-run. Therefore, if governments create a budget deficit, either by increasing government spending or reducing taxes, the economy would grow due to the positive effect on the aggregate demand. However, the same view states that the economy is "Classical" in the long-run, given that the conditions that make aggregate demand matter in the short-run, specifically sticky prices and wages, are less important in the long-run. By keeping the "Conventional" view idea that the Ricardian Equivalence condition does not hold, Elmendorf and Mankiw (1999) showed that government debt could impair economic growth in the long-run, given that the increase in private savings would not fully compensate the decrease in public savings. This situation would lead to a decrease in the national savings and, consequently, to a decrease in total investment and in the capital stock, therefore leading to a higher marginal product of capital, higher interest rates, lower labour productivity and lower wages. As a result, in the long-run, the increase in government debt leads to a crowding-out effect of private investment which negatively affects output growth.
spending has no meaningful effects on output growth. According to Elmendorf and Mankiw (1999), this theory relies on the fact that the households are sufficiently forward looking and, consequently, anticipate the future increase in taxes due to the present increase in government spending. As a result, households, even though have available a larger disposable income in the present, would not increase their consumption as a response to a tax cut. Instead, households would save the entire tax cut to fulfil the anticipation of the future tax increase. This means that the decrease in public savings would be totally compensated by the increase in private savings. Therefore, government debt has no effect in changing the economy’s path. From the Elmendorf and Mankiw (1999) survey, it is possible to understand that, theo-retically, government debt may have a positive effect in the short-run while in the long-run government debt may have a negative effect on output growth, assuming that the Ricar-dian Equivalence condition does not hold. Nevertheless, according to Panizza and Presbitero (2013), it is also possible for government debt to present short-run negative effects, if it leads the economy to a situation of uncertainty or negative expectations, either by inflation or financial repression.
These notions point towards the idea that public debt might be a good instrument to motivate growth in the short-run. However, it is an instrument that should be used with caution to not lead the economy to an uncertainty path. Therefore, to avoid such scenario, governments should aim to keep government debt at a sustainable level.
Taking this idea into consideration, the Maastricht Treaty, which established the Euro-pean Monetary Union, defined the criteria that became known as the "Maastricht Criteria" or the "Convergence Criteria". The criteria of fiscal discipline stated that for a country to be eligible to join the European Monetary Union, it should be capable to maintain its (i) deficit below 3% of GDP and (ii) the government debt-to-GDP ratio below 60%. If a country failed to comply with these two requirements, it would face an Excessive Deficit Procedure (EDP) to converge to the required levels of the public finances. Exceptionally, countries that surpassed these requirements would not face the EDP, if it was a temporary situation and the ratios were converging to the target at a sufficiently rapid pace. The fiscal discipline criteria of the Maastricht Treaty may lead to the questions of (i) how much government debt should be considered as sustainable and (ii) if the 60% government debt-to-GDP ratio present a tipping point in the relationship between public debt and economic growth. These questions became more present in the heads of researchers in more recent years, more specifically after the global financial crisis.
As it was already discussed, the "Conventional" view states that the economy is Keynesian in the short-run. Therefore, after the financial crisis, governments increased their spending
to mitigate the negative effects of the crisis. As a consequence of these stimulus packages, some European countries witnessed a sharp increase in their government debt-to-GDP ratios, between 2007 and 2011, which raised concerns around the problem of debt overhang discussed by Krugman (1988), i.e. the creditors’ belief that a given country would not be able to repay their debt. With such expectation, creditors would demand higher interest rates to provide financing to these economies which would lead their debt level to an unsustainable situation. According to Panizza and Presbitero (2013), the non-linearities and threshold effects in the relationship between public debt and economic growth may arise due to the debt overhang phenomenon.
Departing from this theoretical discussion, Reinhart and Rogoff (2010) conducted an em-pirical research on the relationship between public debt and economic growth. By analysing the median and average growth rates of 20 advanced economies from 1946 to 2009, the authors found evidence for the existence of a maximum public debt threshold at 90% debt-to-GDP ratio, after which economic growth would be severely impaired.
The conclusions drawn from this research were highly influential among politicians in the aftermath of the financial crisis by providing, according to Herndon et al. (2014), intellectual and empirical support for the application of austerity policies to decrease the high levels of government debt in certain countries. Reinhart and Rogoff (2010) was not only influential among politicians and policy making, but also among many authors by sparking a new branch of research in the economic literature, interested in testing the robustness of the exogenous thresholds defined in Reinhart and Rogoff (2010). That was what Herndon et al. (2014) and Égert (2015a,b) did. Herndon et al. (2014) followed a replication exercise while Égert (2015a,b) not only conducted a replication exercise but also put the dataset used in Reinhart and Rogoff (2010) to formal econometric procedures.
Herndon et al. (2014), by primarily focusing on the Reinhart and Rogoff (2010) sample of 20 advanced economies from 1946 to 2009 and applying the same non-parametric method-ology, did not reach the same results as Reinhart and Rogoff (2010). Herndon et al. (2014) presented three reasons for this mismatch of results in the replication exercise, namely the selective exclusion of available data, spreadsheet coding errors and the inappropriate method of weighting statistics in Reinhart and Rogoff (2010) research.
Following a different approach, Égert (2015a,b) applied the Reinhart and Rogoff (2010) dataset not only to a replication exercise, i.e. to a non-parametric analysis, but also to formal econometric procedures, to verify the existence of non-linearities and endogenous thresholds in the relationship between public debt and economic growth. Égert (2015a), by applying non-linear threshold models, found evidence for a negative non-linear relationship between
public debt and economic growth and that the negative effects of public debt on growth could emerge at much lower levels than those identified in Reinhart and Rogoff (2010), more specifically between 20% and 60% debt-to-GDP ratios. These results should be considered with caution because, according to the author, they are sensitive to changes in the data. Similarly, Égert (2015b) not only suggested that the non-linear relationship between public debt and economic growth was not very robust, but also that the negative effects of public debt on economic growth could occur at government debt levels as low as 20% of GDP.
However, by only taking into consideration the general government debt level1, the author
found evidence for the negative effect to appear at a 50% debt-to-GDP ratio threshold. Additionally, the author conducted a country-specific analysis on the debt-to-GDP ratio thresholds that suggested the existence of a large cross-country heterogeneity.
In summary, the robustness of the results presented in Reinhart and Rogoff (2010) have been challenged by the replication exercises and formal econometric procedures conducted in Herndon et al. (2014) and Égert (2015a,b), which set the 90% debt-to-GDP ratio threshold far from a stylized fact. Nevertheless, the research conducted by Reinhart and Rogoff (2010) has to be acknowledged for motivating the emergence of new branches of research in the economic literature. Besides the branch that was previously discussed, related to the authors’ interest in verifying the robustness of Reinhart and Rogoff (2010) results, other researchers focused their interest in analysing the existence of endogenous thresholds and non-linearities, and the direction of causality between public debt and economic growth for a variety of groups of countries and time periods.
2.1
Threshold Effects
In this section, we analyse the literature concerned with testing the existence of endogenous thresholds and non-linearities in the relationship between public debt and economic growth. First, we focus on the authors that analyse these matters by using large panel datasets composed by advanced and emerging economies, such as Woo and Kumar (2015), Afonso and Jalles (2013), Eberhardt and Presbitero (2013), Pescatori et al. (2014) and Eberhardt and Presbitero (2015). Then, we analyse the authors focused on a more restrict set of countries, e.g. OECD and Euro Area countries, such as Cecchetti et al. (2011), Checherita-Westphal and Rother (2012), Baum et al. (2013), Afonso and Alves (2014), Bilan and Ihnatov (2015) and Mencinger et al. (2015).
1Reinhart and Rogoff (2010) used central government debt. However, according to Égert (2015b) it is
more relevant to analyse general government debt level (consolidated debt level of the central government, social security and subnational government).
Following the publication of Reinhart and Rogoff (2010), some authors followed the trend in the economic research and started to analyse the relationship between public debt and economic growth to assess whether Reinhart and Rogoff (2010) results were robust to different methodologies, different sets of countries and different time frames of analysis.
Woo and Kumar (2015) analysed a panel of advanced and emerging economies from 1970 to 2007 by using a large variety of estimation methodologies. In their research, Woo and Ku-mar (2015) found evidence for the existence of a non-linear and negative relationship between public debt and economic growth for debt-to-GDP ratios above 90%. More specifically, that a 10 percentage points (p.p.) increase in the initial debt-to-GDP ratio slowed GDP per capita growth by 0,2 p.p. per year. The effect of public debt on economic growth was found to be smaller when only considering advanced economies, where the estimations pointed towards a negative effect of 0,15 p.p. on growth when the initial debt level increased by 10 p.p.. According to the authors, this negative effect reflected the decrease in labour productivity
growth due to lower levels of investment2 and slower capital stock growth per worker.
Afonso and Jalles (2013), by analysing a panel of 155 countries from 1970 to 2008, also found a negative association between public debt and economic growth, provided that coun-tries with debt-to-GDP ratios above 90% presented smaller growth rates than the councoun-tries that were able to keep their debt-to-GDP ratios below 30%. Contrary to Woo and Kumar (2015), this research did not found evidence for non-linearities in the relationship between debt and growth, given that the quadratic debt term was not statistically significant. In terms of public debt thresholds, Afonso and Jalles (2013), by using the Hansen (2000) threshold estimation procedure, derived endogenous thresholds of 58% and 79% for the Euro Area and emerging economies, respectively. The authors also analysed the effects of debt maturity on economic growth. By analysing short-term and long-term debt as a percentage of GDP, it was found evidence for a negative impact on GDP growth of both debt maturities, for the entire sample. However, by analysing short-term and long-term debt as a percentage of total debt, and only taking into account the OECD countries, it was found that longer debt ma-turities were associated with higher levels of growth. Such evidence suggests that, for these economies, a lower frequency of debt payments would benefit countries with difficulties in accessing the financial markets, thus supporting the current discussion of restructuring pub-lic debt in such countries. Additionally, this research supported fiscal consolidation popub-licies given that the inclusion of the budget balance in the estimation process consistently provided positive coefficients, implying that such policies promoted growth in a non-Keynesian way. Regarding the channels of transmission of fiscal consolidation policies, the authors identified a positive effect of such policies on private investment, total factor productivity and capital
stock growth.
Eberhardt and Presbitero (2013) analysed the long-run relationship between public debt and economic growth using a large panel of 105 countries from 1972 to 2009. The authors found evidence for differences in the relationship between public debt and economic growth across countries, but did not find evidence for within-country differences. Also, contrary to much of the literature, this research did not find evidence of non-linearities, given that empirical tests supported a linear specification, nor endogenous thresholds.
Pescatori et al. (2014) applied a novel empirical approach to a large dataset developed by the IMF. Similarly to Eberhardt and Presbitero (2013), the authors did not find evidence for the existence of public debt thresholds. The authors also verified that the negative effects of high levels of debt were only meaningful when only taking the short-run into consideration, given that the association between debt and growth became weaker when analysing for the long-run. Another important contribution in this research was that the relationship between debt and growth was more influenced by the trajectory of the debt-to-GDP ratio than by the debt-to-GDP ratio itself, given the evidence of countries with high but declining debt levels presenting growth paths in line with other countries. Even though the authors did not identify a particular threshold level, they found evidence for the association of large levels of debt with more volatile growth which, according to Pescatori et al. (2014), may be detrimental to a country’s economic performance.
Finally, Eberhardt and Presbitero (2015) analysed the long-run relationship between pub-lic debt and economic growth for a panel of 118 countries from 1960 to 2012. The authors found evidence, in line with most of the literature, that countries with higher debt-to-GDP ratios tend to present a weaker economic performance. Additionally, the authors support the idea that a common debt threshold for all countries is a fallacy provided that, through their research, it was found evidence for heterogeneity in the relationship between public debt and economic growth across countries.
The results obtained by these authors show a curious pattern. The research published before Herndon et al. (2014) found evidence for a more significant negative effect of public
debt on economic growth after the 90% debt-to-GDP ratio. However, the authors that
published after the Herndon et al. (2014) critique to Reinhart and Rogoff (2010), either found evidence for debt thresholds far below the 90% debt-to-GDP ratio or did not find evidence for a debt threshold at all. Still, most of the literature based on the analysis of large panel datasets found a common ground by supporting a negative relationship between public debt and economic growth. In terms of the channels through which public debt affects economic growth, there also appears to be a general consensus around private investment,
total factor productivity and capital stock growth.
Now we narrow the analysis of the literature on the authors focused in testing the existence of endogenous thresholds and non-linearities in the relationship between public debt and economic growth for smaller panels of countries.
Cecchetti et al. (2011) by analysing 18 OECD countries from 1980 to 2010 found evidence for a government debt threshold at 85% debt-to-GDP ratio. After this threshold, the authors estimated that a 10 p.p. increase in the debt-to-GDP ratio would reduce trend growth by more than 0,1 p.p.. The authors extended their research by analysing other types of debt, such as corporate and household debt, where their findings suggested thresholds of 90%
corporate debt-to-GDP ratio and 85% household debt-to-GDP ratio3.
Checherita-Westphal and Rother (2012) analysed 12 Euro Area countries from 1970 to 2008 and found evidence for a concave relationship (inverted U-shape curve) between pub-lic debt and economic growth. This non-linear relationship had a turning point between 90%-100% debt-to-GDP ratios, on average, for the 12 countries in the sample. However, the confidence intervals suggested that debt thresholds could go as low as 70% debt-to-GDP ratio. Similarly to Woo and Kumar (2015), the authors follow different approaches to miti-gate endogeneity problems such as the use of 1-year and 5-year forward growth rates, trend GDP growth rates and instrumental variables estimation processes. Regarding the channels through which public debt was found to have a non-linear impact on economic growth, the authors identified private savings and total factor productivity. These channels are in line with those found in Woo and Kumar (2015), given that lower private savings may lead to lower investment levels. With less investment, it would be expected to witness a decrease in the capital stock growth and, consequently, lower productivity levels. As a result, this may end up decreasing the disposable income in the economy and negatively affecting growth.
Baum et al. (2013) analysed 12 Euro Area countries from 1990 to 2010. By using a dynamic threshold panel methodology, the authors were able to analyse the relationship between public debt and economic growth on the short-run, contrary to the previous studies that focus on the long-run relationship. The authors found evidence that the short-run impact of debt on GDP growth was positive, which is in accordance to the economic theory. However, this positive effect tends to zero and loses its statistical significance for debt-to-GDP ratios above 67%. Additionally, for debt-to-GDP ratios above 95%, the authors found evidence that further increases in the debt-to-GDP ratio would lead to a weaker economic performance. The confidence intervals showed that the lower threshold could be as low as 63% debt-to-GDP ratio while the upper threshold could be as high as 100% debt-to-GDP ratio. Baum et al.
(2013) also identified pressures in the long-term interest rate when public debt-to-GDP ratio surpassed 70%, hinting for a possible crowding-out effect of private investment at this level. Similarly to Afonso and Jalles (2013), this research supports fiscal consolidation policies for highly indebted economies because, according to Baum et al. (2013), the positive short-run effect of additional debt on growth may decrease drastically and even become negative for high initial debt levels.
Afonso and Alves (2014) analysed the effect of public debt on economic growth for 14 Eu-ropean countries from 1970 to 2012. In line with the previous works, Afonso and Alves (2014) provided evidence for a negative relationship between public debt and economic growth, both in the short-run and long-run. Additionally, when the effects of debt-to-GDP ratio and debt service were compared, the authors found evidence that the debt service variables had a more detrimental effect on economic growth. Regarding the possible existence of debt thresholds and non-linearities, the authors provided evidence for a Laffer-curve relationship between debt and growth with a threshold of 75% and 74% for annual and 5-year average growth rates, respectively.
Bilan and Ihnatov (2015) analysed 33 European countries from 1990 to 2011. The results provided evidence for the existence of a non-linear relationship between public debt and economic growth, i.e. a Laffer-curve relationship, with a maximum debt threshold at 94% debt-to-GDP ratio, for the whole sample. However, when the sample was split between developing and developed European countries, the authors found evidence that a common debt threshold for all countries was a fallacy. In this regard, the authors identified two different ranges of thresholds, more specifically a 40%-50% debt-to-GDP ratio for the set of developing European countries and a 70%-80% debt-to-GDP ratio for the set of developed European countries. According to Bilan and Ihnatov (2015), debt effects, after this threshold, were expected to be negative due to higher interest rates, fear of debt unsustainability and of fiscal consolidation measures.
Finally, Mencinger et al. (2015) analysed the short-run relationship between public debt
and economic growth in a panel of 36 countries4. The time period of analysis was not the
same for all countries in the sample. More specifically, the analysis on advanced economies covered the period from 1980 to 2010 while for emerging economies it was only covered the period from 1995 to 2010. In order to study the debt-growth relationship, the authors used a generalized economic growth model augmented with a debt variable and, through their analysis, they found evidence for the existence of a non-linear relationship, i.e. a Laffer-curve relationship. The authors found evidence that advanced economies tend to have less
restrictive thresholds given that, for this panel, the threshold for advanced economies ranged between 90% and 94% debt-to-GDP ratios while for emerging economies the threshold ranged between 44% and 45% debt-to-GDP ratios.
This set of literature is also in line with most of the existent literature, by supporting a negative relationship between public debt and economic growth. In terms of debt thresholds, the evidence point towards a debt threshold for the whole sample of countries that, on aver-age, ranges between 63%-100% debt-to-GDP ratios. However, when distinguishing between advanced and emerging economies in these sets of countries, a common evidence found in the literature was that emerging economies faced more restrict debt thresholds than advanced economies. More specifically, emerging economies present a tipping point in the debt-growth relationship between 40%-50% debt-to-GDP ratios while the one for advanced economies ranges between 70%-94% debt-to-GDP ratios. Regarding the channels through which public debt affects economic growth, this set of literature point towards private savings and total factor productivity, in line with those identified in the first part. Additionally, Bilan and Ihnatov (2015) identified other channels such as higher interest rates and the fear of debt unsustainability which would lead to the application of fiscal consolidation policies.
2.2
Causality
Another important branch in the literature is related with causality. All the previous em-pirical works analysed departed from the assumption that the causality direction went from public debt to economic growth. Most of the literature support this assumption by referring to the negative correlation between public debt and economic growth. However, correlation does not necessarily imply a causal relationship between two variables. Therefore, discussion on this assumption arose given that it is also reasonable to assume that the causality direction might also go from economic growth to public debt. A clear example of such idea is related to the automatic stabilizers (Panizza and Presbitero, 2014; Gómez-Puig and Sosvilla-Rivero, 2015). When the economy is depressed, the unemployment level tends to increase, the level of consumption is lower and, consequently, governments witness lower levels of revenue. In such scenario and in countries with large welfare systems, the automatic stabilizers’ effects kick in, i.e. unemployment and other social security benefits are needed by more people, and governments need to accommodate such needs. Therefore, if governments face lower levels of revenue when the economy is depressed and the financing needs increase due to the automatic stabilizers, the only path available for governments to accommodate such expenses might be through public debt.
the literature focused on public debt thresholds. Nevertheless, some authors already turned their attention on this particular topic by employing formal econometric procedures to assess the causality direction on a variety of groups of countries and time periods.
Panizza and Presbitero (2014) analysed a sample of OECD countries5 by using an
instru-mental variable approach, capturing the valuation effects caused by the interaction between foreign currency debt and exchange rate volatility. The authors did not find evidence sup-porting the causality direction from public debt to economic growth. Also, the authors did not find evidence that high public debt levels negatively affect future growth in advanced economies. Nonetheless, such results may be, according to Panizza and Presbitero (2014), due to the fact the countries’ public debt levels were still below the country-specific debt thresholds and also due to the fact that, in the time period of analysis, the countries in the sample could use their own central banks, e.g. through debt monetization or competitive devaluation policies, to solve their debt problems. Given their results, they argued that the negative relationship between public debt and economic growth, found in most of the liter-ature, should not be used as a justification for fiscal consolidation policies, as there was not found evidence for the causal effect to depart from public debt to economic growth.
Donayre and Taivan (2017) analysed the country-specific causal relationship between public debt and economic growth in a sample of 20 OECD countries from 1970 to 2009. The authors’ research was based on canonical cointegrating regressions, which allowed for the possibility of stochastic cointegrating vectors, and then used Granger-causality and VAR econometric tests to make inference about the direction of causality. According to the authors, this methodology allowed them to address the issue of the possible existence of a dynamic relationship between public debt and economic growth that was not addressed by most of the empirical research on the debt-growth nexus. Through this research, Donayre and Taivan (2017) found evidence that modern welfare states face periods of low growth following increases in the debt-to-GDP ratio. However, when analysing more traditional welfare states and welfare states with larger governments, i.e. with larger levels of public expenditure, the authors found evidence supporting a bi-directional causality. Such evidence point towards the importance of a country-specific analysis on the debt-growth nexus and that homogeneous fiscal consolidation policies throughout the Euro Area may not be the appropriate route to pursue to achieve more growth. Therefore, according to Donayre and Taivan (2017), it cannot be inferred that larger levels of public debt will severely impair growth in all countries.
Puente-Ajovín and Sanso-Navarro (2015), following a Granger-causality approach, anal-ysed a sample of 16 OECD countries from 1980 to 2009. The authors not only
ered government debt but also household and non-financial corporate debt. To control for the cross-country heterogeneity and cross-sectional dependence, a panel bootstrap Granger-causality test was applied. From this analysis, the authors found evidence that public debt did not Granger-cause economic growth and also that non-financial private debt, e.g. house-hold debt, did not Granger-cause economic growth. This research’s results pointed towards a causality direction from economic growth to public debt. Therefore, such results did not provide intellectual support for the application of fiscal consolidation policies which find justification on the assumption that public debt causes economic growth.
Gómez-Puig and Sosvilla-Rivero (2015) analysed the bi-directional causal relationship be-tween public debt and economic growth in a sample of 11 European Monetary Union coun-tries from 1980 to 2013. The authors followed a Granger-causality approach and endogenous breakpoint tests to address the possible heterogeneity in the bi-directional causality. Ac-cording to Gómez-Puig and Sosvilla-Rivero (2015), such methodology not only considers the cross-country differences but also the differences over time, addressing the dynamic nature of the relationship between public debt and economic growth, in line with Donayre and Taivan (2017). Similarly to Panizza and Presbitero (2014) and Puente-Ajovín and Sanso-Navarro (2015), this research did not provide evidence for a negative causation between public debt and economic growth up to 2009. After detecting an endogenous breakpoint between 2007 and 2009, the authors found evidence for a negative Granger-causality effect between public debt and economic growth for some of the countries analysed.
Finally, Ferreira (2016) analysed a sample of 28 European Union countries from 2001 to 2012 and, to study the period after the financial crisis, from 2007 to 2012. Following a Granger-causality approach, the author analysed the causal relationship between three dif-ferent debt categories - public debt, foreign debt and private debt - and economic growth. Through this approach, Ferreira (2016) found evidence for a statistically significant bi-directional Granger-causality relationship between public debt and economic growth, at least in the short-run. The results also provided evidence for a negative and statistically stronger causal relationship from economic growth to public debt in both panels, i.e. for the 2001-2012 panel and for the post-crisis panel (2007-2001-2012). Regarding the other types of debt, the results obtained were not statistically strong. Nevertheless, the estimation results point to-wards a positive bi-directional causal relationship between foreign debt and economic growth. Regarding private debt it was found evidence for a bi-directional causal relationship, more specifically, that private debt has a negative impact on economic growth and economic growth positively affects private debt.
The conclusions drawn by this set of empirical research do not provide consensual results. Some authors either support both directions of causality or no causal relationship at all
between public debt and economic growth.
In summary, even though the literature found a common ground in supporting a negative relationship between public debt and economic growth, it is possible to conclude that there is no common agreement regarding the other main topics of discussion related with the relationship between public debt and economic growth, such as public debt thresholds and causality direction.
3
Data and Methodology
3.1
Data
We used annual data to analyse the relationship between public debt and economic growth for a panel of 10 European Monetary Union (EMU) countries that signed the Maastricht treaty in 1992 and have the Euro as their official currency. Within this set of countries we have Belgium, France, Germany, Greece, Ireland, Italy, Luxembourg, Netherlands, Portugal and Spain. All the variables used in this research were collected from the European Commission’s Annual Macro-Economic database (AMECO) from 1995 to 2016, providing 22 observations per country and giving a total of 220 observations for our dataset. The dependent variable is the real Gross Domestic Product (GDP) annual growth rate and the independent variable of interest is public debt (as % of GDP), i.e. the debt-to-GDP ratio. In terms of control variables, we used those that have been consistently used throughout the debt-growth litera-ture, such as the logarithm of real GDP per capita, trade openess (as % of GDP), population growth, capital stock (as % of GDP), budget balance (as % of GDP) and debt service (as % of GDP).
3.1.1 Structural Considerations
We used several criteria to select the countries and time-frame under analysis. First, to avoid mismeasurement issues and the usage of different methodologies to develop the statistics, we collected our data from a single database (AMECO). Second, the 10 EMU countries that signed the Maastricht treaty were chosen to mitigate country heterogeneity in terms of pol-icy and economic tools available, i.e. after signing this treaty these countries could no longer take advantage of isolated monetary policies, such as debt monetization or competitive deval-uations to boost growth. Finally, the time-frame chosen to develop our research, from 1995 to 2016, was based on four factors, more specifically the i) ESA 2010 statistical framework for which the data available on the AMECO database only goes back to 1995, ii) the data
is more closely related with the current economic environment, iii) this shorter time-frame of analysis allows to avoid possible sources of bias that large historical datasets cannot, such as, for example, war periods, different political regimes and country-specific monetary policy and iv) this period covers the process of the EMU preparation and implementation.
3.2
Methodology
In this research, we analysed three different topics regarding the relationship between public debt and economic growth. We started by replicating the work of Reinhart and Rogoff (2010) to assess whether the 90% debt-to-GDP ratio, presented as a tipping point in their research, holds with our data. Then, we analysed the causal relationship between public debt and economic growth, given that most of the literature departs from the assumption of public debt causing economic growth without clearly testing such hypothesis. Finally, we employed different methodologies that allowed to endogenously estimate a maximum public debt threshold in a panel framework.
3.2.1 Reinhart and Rogoff (2010) Replication
As it was previously referred, by analysing 20 advanced countries from 1946 to 2009, Reinhart and Rogoff (2010) concluded with their research that there was a negative correlation between public debt and economic growth with a maximum public debt threshold around 90% debt-to-GDP ratio.
To verify if this threshold holds in our sample6, we conducted a replication exercise7, while
avoiding the methodological mistakes pointed out by Herndon et al. (2014), that consisted in analysing the average and median growth rates of the countries in our dataset within the debt-to-GDP ratio ranges defined in Reinhart and Rogoff (2010). Then, by pursuing the same methodology, we extended the analysis by including two additional debt-to-GDP ratio ranges, the 90%-120% and +120%.
3.2.2 Causality
Most of the literature supports their research on the assumption that public debt causes economic growth, by referring to the negative correlation that exists between both variables. However, given that correlation does not necessarily imply a causal relationship, our definition
6Belgium, France, Germany, Greece, Ireland, Italy, Luxembourg, Netherlands, Portugal and Spain from
1995 to 2016.
of causality follows the one of Granger (1969), i.e. that a variable X is said to cause Y if by including the past information of the variable X we can better predict the current value of Y (Ferreira, 2016).
Therefore, to analyse the causal relationship between public debt and economic growth, we followed Ferreira (2016) and Gómez-Puig and Sosvilla-Rivero (2015) in terms of the
model structure, and used the Dumitrescu and Hurlin (2012)8 Granger non-causality test
to draw conclusions regarding the causal relationship between these two variables in a panel framework. Furthermore, we not only analysed the full sample causality (1995-2016) but also extended the analysis by studying the causal relationship between public debt and economic growth for the pre-crisis (1995-2006) and post-crisis (2007-2016) periods.
The Dumitrescu and Hurlin (2012) Granger non-causality test allows to assess whether variable X does not Granger-cause variable Y or if variable X Granger-cause variable Y for at least one country, the null and alternative hypotheses, respectively.
H0 : X does not Granger-cause Y
H1 : X Granger-cause Y for at least one country
As one can clearly verify, if we do not reject the null hypothesis the conclusion is straight-forward. However, if we reject the null, we conclude that variable X Granger-cause variable Y for at least one country. This is a drawback of the test because it does not allow to know for which country or countries it is possible to verify the causal relationship under analysis. Therefore, it was needed to conduct country-specific regressions to identify the country or
countries for which the causal relationship under analysis was verified9.
By using STATA, we conducted the referred test on the following equations:
Yi,t = K ∑ k=1 βYYi,t−k+ K ∑ k=1 βXXi,t−k + µi,t (1) Xi,t = K ∑ k=1 βYYi,t−k+ K ∑ k=1 βXXi,t−k + µi,t (2)
where Y = real GDP annual growth rate; X = debt-to-GDP ratio annual growth rate; i = 1, . . . , N countries; t = 1, . . . , T years; k = 1, . . . , K lags and µ is the error term.
Additionally, we conducted several robustness checks, based on Ferreira (2016)
method-8This test’s routine is available on STATA with the name "xtgcause".
ology, by regressing equations (1) and (2) with other estimators, such as the robust Ordinary Least Squares (OLS) estimator, Fixed Effects (FE) estimator to account for country hetero-geneity and the Generalized Method of Moments (GMM) estimator to account for potential endogeneity. These regressions allow to test if the current value of variable Y significantly depends on the past information of variable X and if the current value of variable X sig-nificantly depends on the past information of variable Y. Then, by following the causality definition of Granger (1969), these regressions allow to infer about the direction of causality between variables X and Y. Specifically, if lagged X is statistically significant in explaining Y, X is said to Granger-cause Y, and if lagged Y is statistically significant in explaining X, Y is said to Granger-cause X.
3.2.3 Public Debt Thresholds
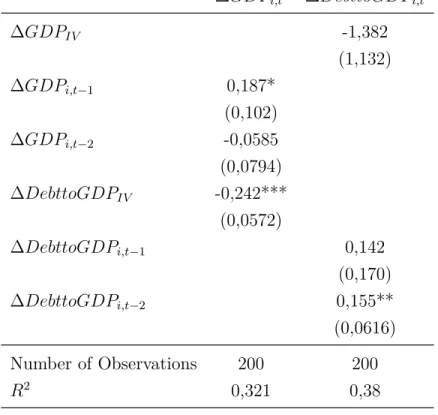
As our last topic of interest, we analysed the short-run relationship between public debt and economic growth, where we also included a squared debt-to-GDP ratio term to test for a Laffer-curve type relationship between these two variables. Our model specification was the following:
Yi,t = β0+ β1Xi,t+ β2Xi,t2 +
∑
βjZi,t + µi,t (3)
where Y = real GDP annual growth rate; X = debt-to-GDP ratio; Z = set of control variables consistently used throughout the literature; i = 1, . . . , N countries; t = 1, . . . , T years and µ is the error term.
To estimate the maximum public debt threshold of equation (3), we used the Hansen
(2000)10 endogenous threshold estimation procedure for which our threshold variable was
the debt-to-GDP ratio. Additionally, we complemented this analysis with several robustness checks, by regressing equation (3) with other estimators, such as the Ordinary Least Squares (OLS) estimator, Least Squares Dummy Variables (LSDV) and Fixed Effects (FE) estimators to account for country heterogeneity, and Generalized Method of Moments (GMM) estimator to account for potential endogeneity. After estimating a statistically significant model for each of the referred estimators, we estimated the maximum public debt threshold following a partial derivative approach, similarly to Bilan and Ihnatov (2015) and Afonso and Alves (2014):
10
This test’s routine for STATA is available on http://www.ssc.wisc.edu/~bhansen/progs/ecnmt_00. html.
∂Yi,t ∂Xi,t = β1+ 2β2Xi,t = 0 (4) ⇔ Xi,t = −β1 2β2 (5)
4
Results
In this section we provide the results for each of the topics under analysis regarding the relationship between public debt and economic growth. First, we analyse our replication exercise of Reinhart and Rogoff (2010), then the causal relationship between public debt and economic growth and finally the public debt thresholds. To conclude this section we provide a summary of the main findings from this research.
4.1
Reinhart and Rogoff (2010) Replication
We conducted this replication exercise to assess whether the results and conclusions drawn in Reinhart and Rogoff (2010) research hold with our dataset. An important aspect of this replication exercise was that we addressed the methodological mistakes that were exposed by Herndon et al. (2014).
Even though our dataset differs significantly from the one used in Herndon et al. (2014) and Égert (2015a,b), both in terms of countries and time-frame covered, our main conclusions from the replication exercise are quite similar. First, we found evidence supporting the existence of a negative correlation between public debt and economic growth, as supported by most of the literature, within our dataset. Second, we did not find evidence of average negative economic growth for debt-to-GDP ratios above 90% (see Figure 2).
Figure 2: Reinhart and Rogoff (2010) replication results. Source: Authors’ calcu-lations
Given that our previous results provided evidence of a negative correlation between public debt and economic growth, we enhanced the replication exercise, by adding two additional debt-to-GDP ratio ranges, to assess whether there was in our data a larger debt-to-GDP ratio range for which we could find evidence of average negative growth.
Figure 3: Reinhart and Rogoff (2010) enhanced replication results. Source: Au-thors’ calculations
By including these two additional debt-to-GDP ratio ranges, the 90%-120% and +120%, we still verified the negative correlation between the two variables and we also found evidence of average negative economic growth for debt-to-GDP ratios above 120% (see Figure 3). Therefore, by following Reinhart and Rogoff (2010) rationale, we can claim with our research that the 120% debt-to-GDP ratio presents a turning point in the relationship between public debt and economic growth for the countries analysed in our sample. This result was largely influenced by Greece’s poor economic performance during the years within the +120% debt-to-GDP ratio range, specifically from 2009 to 2016.
Nevertheless, we were not tempted to make such claim based on a methodological ap-proach with such rigid assumptions. More specifically, Reinhart and Rogoff (2010) methodol-ogy departs from the assumption that the causality direction in the debt-growth relationship goes from public debt to economic growth without testing such hypothesis. Additionally, the thresholds presented by their research appear in the form of ad-hoc debt-to-GDP ratio ranges. Therefore, to provide more meaningful results, we conducted further analyses to assess the causality direction between public debt and economic growth and also applied different methodologies to endogenously determine public debt thresholds.
4.2
Causality
Most of the literature on the debt-growth nexus departs from the assumption of public debt causing economic growth, by referring to the negative correlation between both variables, without clearly testing such hypothesis. In this section, we not only analysed the causal relationship for the whole sample period but also for the pre-crisis and post-crisis periods, to assess whether the financial crisis had an effect in changing the causal relationship between the two variables.
To empirically test the causal relationship between public debt and economic growth in a panel framework, we used the Dumitrescu and Hurlin (2012) Granger non-causality test which allows to conclude whether there is no causal relationship or if the causal relation-ship holds for at least one country. However, as it was previously referred, this alternative hypothesis presents a drawback because it does not allow to infer for which countries the causal relationship holds. Therefore, we conducted country-specific regressions to address this drawback.
Following the model specification of Ferreira (2016) and Gómez-Puig and Sosvilla-Rivero (2015), we applied the referred test on equations (6) and (7) for three different time frames, more specifically i) from 1995 to 2016, the full sample period, ii) from 1995 to 2006, the pre-crisis period, and iii) from 2007 to 2016, the post-crisis period:
∆GDPi,t =β1∆GDPi,t−1+ β2∆GDPi,t−2+ β3∆DebttoGDPi,t−1
+ β4∆DebttoGDPi,t−2+ µi,t
(6)
∆DebttoGDPi,t =β1∆GDPi,t−1+ β2∆GDPi,t−2+ β3∆DebttoGDPi,t−1
+ β4∆DebttoGDPi,t−2+ µi,t
(7)
4.2.1 Full Sample (1995-2016) Causality Analysis
We start by studying the causal relationship between public debt and economic growth for the entire sample. By applying the Dumitrescu and Hurlin (2012) Granger non-causality test on equation (6), we verified that the p-values of both test statistics were below the significance level of 1%, rejecting the null hypothesis, and therefore suggesting that public debt Granger-cause economic growth for at least one country (see Table 1).
Table 1. Public Debt ⇒ Economic Growth (1995-2016): Dumitrescu and Hurlin
(2012) Granger non-Causality test
Lag order 2
Average Wald statistic 7,0988
Average Z statistic 8,0620 (P-value = 0,0000)
Average Z-tilde statistic 5,8953 (P-value = 0,0000)
Number of observations 200
However, as it was previously discussed, by rejecting the null hypothesis we cannot infer for which countries such causal relationship holds. To address this matter, we conducted
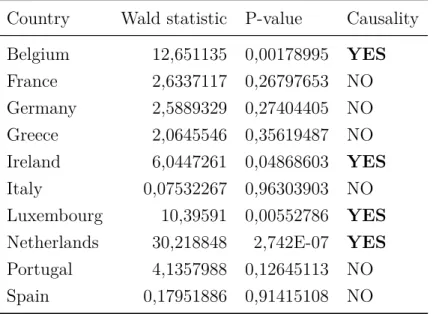
country-specific regressions11 and we found evidence that a causal relationship departing
from public debt to economic growth only holds for Belgium, Ireland, Luxembourg and Netherlands (see Table 2).
Table 2. Public Debt ⇒ Economic Growth (1995-2016): Country-Specific Causal-ity
Country Wald statistic P-value Causality
Belgium 12,651135 0,00178995 YES France 2,6337117 0,26797653 NO Germany 2,5889329 0,27404405 NO Greece 2,0645546 0,35619487 NO Ireland 6,0447261 0,04868603 YES Italy 0,07532267 0,96303903 NO Luxembourg 10,39591 0,00552786 YES
Netherlands 30,218848 2,742E-07 YES
Portugal 4,1357988 0,12645113 NO
Spain 0,17951886 0,91415108 NO
By applying the Dumitrescu and Hurlin (2012) Granger non-causality test on equation (7) to analyse the reverse causality, our results suggest that economic growth did not Granger-cause public debt, given that the p-values of both test statistics were above the significance level of 10%, therefore not rejecting the null hypothesis (see Table 3).
Table 3. Economic Growth ⇒ Public Debt (1995-2016): Dumitrescu and Hurlin
(2012) Granger non-Causality test
Lag order 2
Average Wald statistic 2,4599
Average Z statistic 0,7272 (P-value = 0,4671)
Average Z-tilde statistic 0,2357 (P-value = 0,8136)
Number of observations 200
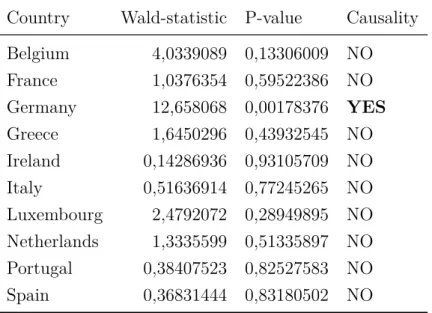
On the other hand, our country-specific regressions12 provided evidence that this causal
relationship holds for Germany. However, for the majority of the countries considered, this causal relationship did not hold (see Table 4).
Table 4. Economic Growth ⇒ Public Debt (1995-2016): Country-Specific Causal-ity
Country Wald-statistic P-value Causality
Belgium 4,0339089 0,13306009 NO France 1,0376354 0,59522386 NO Germany 12,658068 0,00178376 YES Greece 1,6450296 0,43932545 NO Ireland 0,14286936 0,93105709 NO Italy 0,51636914 0,77245265 NO Luxembourg 2,4792072 0,28949895 NO Netherlands 1,3335599 0,51335897 NO Portugal 0,38407523 0,82527583 NO Spain 0,36831444 0,83180502 NO
In summary, these results suggest that, from 1995 to 2016, there was predominantly a one-way causal relationship departing from public debt to economic growth. Our country-specific regressions for this period suggest that in Belgium, Ireland, Luxembourg and Netherlands public debt cause economic growth while in Germany economic growth Granger-cause public debt.
4.2.2 Pre-Crisis (1995-2006) Causality Analysis
We now focus our analysis on the period from 1995 to 2006, which represents the pre-crisis period.
By applying the Dumitrescu and Hurlin (2012) Granger non-causality test on equation (6), we verified that the p-values of both test statistics were above the significance level of 1%, not rejecting the null hypothesis, and therefore suggesting that public debt did not Granger-cause economic growth in our panel during the pre-crisis period. However, the average Z-statistic may provide ambiguous conclusions depending on the significance level considered (see table 5).
Table 5. Public Debt ⇒ Economic Growth (1995-2006): Dumitrescu and Hurlin (2012) Granger non-Causality test
Lag order 2
Average Wald-statistic 3,2415
Average Z statistic 1,9630 (P-value = 0,0496)
Average Z-tilde statistic 0,3264 (P-value = 0,7441)
Number of observations 100
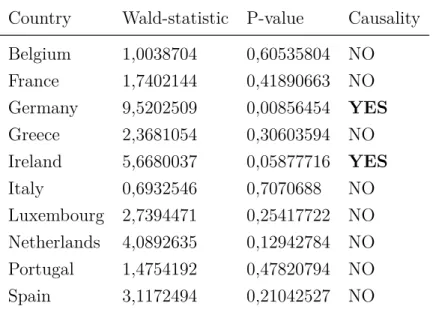
Therefore, we conducted the country-specific regressions13 which allowed to assess that
this causal relationship only hold for Germany and Ireland during the pre-crisis period (see Table 6).
Table 6. Public Debt ⇒ Economic Growth (1995-2006): Country-Specific
Causal-ity
Country Wald-statistic P-value Causality
Belgium 1,0038704 0,60535804 NO France 1,7402144 0,41890663 NO Germany 9,5202509 0,00856454 YES Greece 2,3681054 0,30603594 NO Ireland 5,6680037 0,05877716 YES Italy 0,6932546 0,7070688 NO Luxembourg 2,7394471 0,25417722 NO Netherlands 4,0892635 0,12942784 NO Portugal 1,4754192 0,47820794 NO Spain 3,1172494 0,21042527 NO
To infer about the reverse causality during the pre-crisis period, we applied the Du-mitrescu and Hurlin (2012) Granger non-causality test on equation (7) and verified that the p-values of both test statistics were below the significance level of 1%, rejecting the null hypothesis, and therefore suggesting that economic growth Granger-cause public debt on at least one country (see Table 7).
Table 7. Economic Growth ⇒ Public Debt (1995-2006): Dumitrescu and Hurlin (2012) Granger non-Causality test
Lag order 2
Average Wald-statistic 9,1376
Average Z statistic 11,2856 (P-value = 0,0000)
Average Z-tilde statistic 4,6858 (P-value = 0,0000)
Number of observations 100
To assess for which countries such causal relationship holds, we conducted country-specific
regressions14 which allowed to conclude that economic growth Granger-cause public debt in
Germany, Greece, Ireland, Italy and Netherlands (see Table 8).
Table 8. Economic Growth ⇒ Public Debt (1995-2006): Country-Specific
Causal-ity
Country Wald-statistic P-value Causality
Belgium 0,54653446 0,76088943 NO
France 0,78192901 0,67640417 NO
Germany 8,6987519 0,01291487 YES
Greece 4,8653124 0,0878033 YES
Ireland 38,611765 4,126E-09 YES
Italy 4,8099862 0,09026612 YES
Luxembourg 0,38585835 0,82454037 NO
Netherlands 29,725766 3,509E-07 YES
Portugal 2,9162274 0,23267475 NO
Spain 0,03399233 0,98314746 NO
In summary, the analysis to the pre-crisis period, from 1995 to 2006, provided evidence that the causal relationship departed predominantly from economic growth to public debt. Additionally, the country-specific regressions allowed to conclude that, during this period, such causal relationship holds for Greece, Italy and Netherlands, while Germany and Ireland presented a bi-directional causal relationship between public debt and economic growth.
4.2.3 Post-Crisis (2007-2016) Causality Analysis
In this section we turn our focus to the period from 2007 to 2016, which represents the post-crisis period.
By applying the Dumitrescu and Hurlin (2012) Granger non-causality test on equation (6) the conclusions drawn were ambiguous, given that the results lead to different conclusions
depending on the test statistic considered, i.e. the average Z statistic rejected the null
hypothesis while the average Z-tilde statistic did not (see Table 9).
Table 9. Public Debt ⇒ Economic Growth (2007-2016): Dumitrescu and Hurlin
(2012) Granger non-Causality test
Lag order 2
Average Wald-statistic 7,1778
Average Z statistic 8,1869 (P-value = 0,0000)
Average Z-tilde statistic 1,6311 (P-value = 0,1029)
Number of observations 80
Therefore, we conducted country-specific regressions15 which showed that public debt
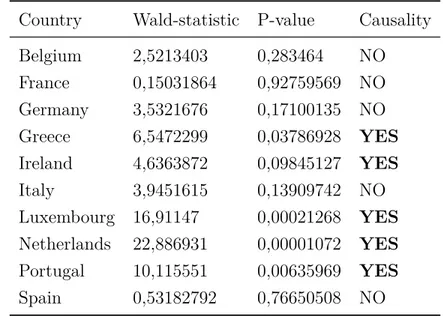
Granger-cause economic growth in Greece, Ireland, Luxembourg, Netherlands and Portugal (see Table 10).
Table 10. Public Debt ⇒ Economic Growth (2007-2016): Country-Specific
Causal-ity
Country Wald-statistic P-value Causality
Belgium 2,5213403 0,283464 NO France 0,15031864 0,92759569 NO Germany 3,5321676 0,17100135 NO Greece 6,5472299 0,03786928 YES Ireland 4,6363872 0,09845127 YES Italy 3,9451615 0,13909742 NO Luxembourg 16,91147 0,00021268 YES Netherlands 22,886931 0,00001072 YES Portugal 10,115551 0,00635969 YES Spain 0,53182792 0,76650508 NO
Regarding the reverse causality, we applied the Dumitrescu and Hurlin (2012) Granger non-causality test on equation (7) and, similarly to the previous results, the conclusions drawn were ambiguous, provided that, depending on the test statistic considered we would arrive to different conclusions (see Table 11).
Table 11. Economic Growth ⇒ Public Debt (2007-2016): Dumitrescu and Hurlin
(2012) Granger non-Causality test
Lag order 2
Average Wald-statistic 3,8679
Average Z statistic 2,9535 (P-value = 0,0031)
Average Z-tilde statistic 0,2268 (P-value = 0,8206)
Number of observations 80
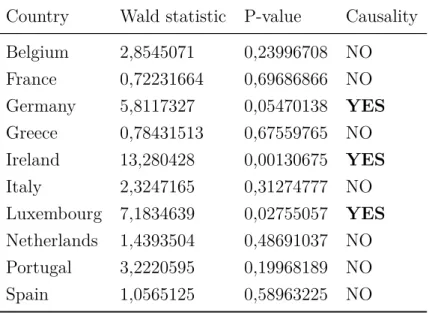
Nevertheless, our country-specific regressions16 showed that economic growth
Granger-cause public debt in Germany, Ireland and Luxembourg (see Table 12).
Table 12. Economic Growth⇒ Public Debt (2007-2016): Country-Specific
Causal-ity
Country Wald statistic P-value Causality
Belgium 2,8545071 0,23996708 NO France 0,72231664 0,69686866 NO Germany 5,8117327 0,05470138 YES Greece 0,78431513 0,67559765 NO Ireland 13,280428 0,00130675 YES Italy 2,3247165 0,31274777 NO Luxembourg 7,1834639 0,02755057 YES Netherlands 1,4393504 0,48691037 NO Portugal 3,2220595 0,19968189 NO Spain 1,0565125 0,58963225 NO
In summary, the analysis to the post-crisis period, from 2007 to 2016, provided evidence that the causal relationship departed predominantly from public debt to economic growth. Additionally, the country-specific regressions allowed to conclude that, during this period,