Ricardo Vieites Salgado Alves Gomes
Unified Motor Drive and Battery Charger for
Electric Vehicles
Ricardo Vieites Salgado Alves Gomes
Unified Mo
tor Dr
iv
e and Batter
y Char
ger for Electr
ic V
ehicles
Dissertação de Mestrado
Ciclo de Estudos Integrados Conducentes ao Grau de
Mestre em Engenharia Eletrónica Industrial e Computadores
Trabalho efectuado sob a orientação do
Professor Doutor João Luiz Afonso
Ricardo Vieites Salgado Alves Gomes
Unified Motor Drive and Battery Charger for
Electric Vehicles
Acknowledgements
The development of the work presented in this document would not have been possible without the support and contribution of some people, to whom I convey my most sincere thanks.
First of all, I would like to thank Doctor João Luiz Afonso, for believe in my capabilities and providing me the opportunity to work under his supervision.
To all researchers, MSc and PhD students of the Group of Energy and Power Electronics (GEPE), for the respect, friendship and good work environment provided.
A special thanks to the PhD student Delfim Pedrosa, my supervisor in the laboratory of the GEPE, for all the support and collaboration, which resulted in an important contribute to the development of this MSc. Thesis.
To my parents and sister, for the patience and comprehension during this hard-working year and by the fact that I have been more absent and did not always give them the attention that they deserve, especially during the writing of this document.
To my closest friends Dalila Abreu, Paulo Vicente, Rui Saraiva and Ângela Loureiro for all the support and friendship provided, with a special thanks to Paulo Vicente for the help provided in the revision of this document.
I would also like to honor the memory of my colleague Emanuel Ribeiro that, despite no longer being among us, helped motivate me as an example of dedication, especially during the more difficult moments lived in this year.
Unified Motor Drive and Battery Charger
for Electric Vehicles
Nowadays, Electric Vehicles are emerging as the most sustainable alternative to support the expected rise in the number of vehicles in circulation around the world, and to reduce the impact of the transportation sector on the environment. However, this is a technology that still has some limitations that restrict its mainstream adoption.
Typically, an Electric Vehicle has a motor drive system and an on-board battery charger that allows charging its battery pack almost anywhere, as long as there is an electrical outlet available. However, this is usually a low-power charger in order to optimize the space and weight on-board the vehicle. As a result, this type of charging typically takes a couple of hours.
The purpose of this MSc. Thesis was the development of a unified power electronics converter, capable of performing the roles of drive the electrical machine of an Electric Vehicle and also charging its battery pack, so as to optimize the space and weight of the power electronics components on-board the vehicle while also providing a faster charging operation.
The first part of this MSc. Thesis consisted in the study of the state of art of the unified hardware solutions proposed, based on the use of the power electronics components of the motor drive system during the battery charging operation, since both operation modes cannot be performed simultaneously, except for regenerative breaking. Also the respective control algorithms that allow perform each operation mode, according with the solution proposed, were studied.
The second part consisted in simulating the proposed unified solution and implementing a proof-of-concept prototype. In the proposed solution the battery charger is based on the use of a three-phase Voltage Source Inverter and the windings of a Brushless DC machine. With respect to the control algorithms, for the motor drive mode the Field-Oriented Control was chosen, while for the battery charging mode two control algorithms were chosen (one for single-phase charging and the other for three-phase charging), based on the Model Predictive Control.
The obtained results validate the proposed solution. However, in the case of the electrical machine used in this MSc. Thesis, the values of the inductances of its windings compromise its use as an input filter.
Keywords: Electric Vehicles, On-Board Battery Charger, Unified Solution, Field-Oriented Control, Model Predictive Control
Solução Unificada para Tração e Carregamento das
Baterias em Veículos Elétricos
Atualmente os Veículos Elétricos surgem como a alternativa mais sustentável perante o aumento expectável do número de veículos em circulação no mundo e por forma a reduzir o impacto ambiental do sector do transporte. Contudo, esta é ainda uma tecnologia com algumas limitações, que ainda não permitiram a sua aquisição em maior escala.
Tipicamente um Veículo Elétrico possui um sistema de tração e um sistema de carregamento, que permite carregar as suas baterias em praticamente qualquer local, desde que haja disponível uma tomada ligada à rede elétrica. No entanto, este sistema de carregamento tem normalmente uma potência instalada baixa, por forma a otimizar o espaço e peso ocupados no interior do veículo. Como resultado, este tipo de carregamento demora tipicamente algumas horas.
Esta Dissertação de Mestrado teve como objetivo o desenvolvimento de um conversor unificado, capaz de controlar a máquina elétrica usada para a tração de um Veículo Elétrico e de carregar as suas baterias, permitindo otimizar ainda mais o espaço e peso ocupados pelos componentes de eletrónica de potência instalados no veículo e possibilitar ainda carregamentos mais rápidos.
A primeira parte desta Dissertação consistiu num estudo do estado da arte de sistemas de hardware unificados, baseados na utilização dos componentes de eletrónica de potência do sistema de tração durante o modo de carregamento das baterias, tendo em conta que as duas operações não podem ser realizadas em simultâneo, exceto para travagem regenerativa. Também foram estudados os algoritmos de controlo que permitem executar cada uma das operações, de acordo com a topologia proposta.
A segunda parte consistiu na simulação da solução proposta e na implementação de um protótipo para demonstração da funcionalidade. Nesta solução proposta, o sistema de carregamento baseia-se na utilização de um inversor trifásico do tipo Voltage Source
Inverter e dos enrolamentos de uma máquina elétrica do tipo Brushless DC. Em relação
aos algoritmos de controlo, para o modo de tração foi selecionado o Controlo por Orientação de Campo (Field-Oriented Control), enquanto que para o modo de carregamento foram selecionados dois algoritmos (um para carregamento monofásico e outro para trifásico), baseados no Controlo Preditivo (Model Predictive Control).
Os resultados obtidos permitiram validar a solução proposta. Contudo, os baixos valores de indutância da máquina elétrica usada comprometem o seu uso como filtro de entrada.
Palavras-Chave: Veículos Elétricos, Sistema de Carregamento, Sistema Unificado, Controlo por Orientação de Campo, Controlo Preditivo
Contents
Acknowledgements... v
List of Figures ... xiii
List of Tables ... xxi
Abbreviations ... xxiii
Chapter 1 Introduction ... 1
1.1. General Motivations... 1
1.2. Electric Vehicle ... 2
Understanding the Concept of Electric Vehicle ... 3
Brief History and Actual State ... 3
Motor Drive... 7
Battery Charger ... 9
1.3. Problem Statement ... 12
1.4. Main Goals ... 13
1.5. Relevant Contributions... 14
1.6. Outline of this MSc. Thesis ... 16
Chapter 2 Unified Topologies for Motor Drive and Battery Charging ... 17
2.1. Introduction ... 17
2.2. Non-Isolated Battery Charger ... 19
Level 1 – Using the Power Electronics Converters of the Motor Drive System ... 19
Level 2 – Using the Power Electronics Converters and the Electrical Machine of the Motor Drive System... 23
2.3. Isolated Battery Charger... 34
2.4. Proposed Solution ... 37
2.5. Conclusions ... 38
Chapter 3 Control Algorithms for Motor Drive and Battery Charging ... 41
3.1. Introduction ... 41
3.2. Motor Drive ... 41
Field-Oriented Control ... 42
Direct Torque Control ... 52
3.3. Battery Charging ... 54
Direct Current Control Based on Synchronous Reference Frame ... 55
Direct Power Control Based on Model Predictive Control ... 62
3.4. Control Algorithms for the Bidirectional DC-DC Converter... 70
Motor Drive... 70
Battery Charging ... 71
3.5. Conclusions ... 74
Chapter 4 Simulations of the Proposed Solution ... 75
4.1. Introduction ... 75
4.2. Electrical Machine ... 76
4.3. Dynamical Model of a Li-Ion (LiFePO4) Battery ... 80
4.4. Simulations in Motor Drive Mode ... 84
Proposed Control Algorithm ... 84
Operating without Load ... 86
Operating with Nominal Load (80 Nm) ... 89
4.5. Simulations in the Fast Charging Mode ... 92
Proposed Control Algorithm ... 94
Grid-to-Vehicle Operation ... 97
Grid-to-Vehicle Operation with a Pre-Charge Circuit ... 105
Grid-to-Vehicle Operation with Reactive Power Compensation ... 107
Vehicle-to-Grid Operation ... 108
4.6. Simulations in the Slow Charging Mode ... 110
Proposed Control Algorithm ... 111
Phase-Locked Loop System ... 112
Grid-to-Vehicle Operation ... 114
Vehicle-to-Grid Operation ... 117
4.7. Simulations of the Bidirectional DC-DC Converter... 118
Motor Drive and Battery Charging (Vehicle-to-Grid) Modes ... 118
4.8. Conclusions ... 121
Chapter 5 Implementation of the Control System and the Power Stage of a Proof-of-Concept Prototype ... 123 5.1. Introduction ... 123 5.2. Control System ... 124 Voltage Sensors ... 127 Current Sensors ... 128 Signal Conditioning ... 129
Digital Signal Controller ... 130
Control Driver of the Insulated Gate Bipolar Transistors ... 131
Control Board for the Pre-Charge Circuit... 132
Position Sensor ... 132
Interface Board for the Position Sensor ... 133
Torque Reference ... 133
Human–Machine Interface ... 134
5.3. Power Stage ... 134
Three-Phase Voltage Source Inverter... 135
DC-Bus ... 136
Sources and Auxiliary Loads ... 137
Extra Inductor Filter ... 138
Resistances of the Pre-Charge Circuit ... 138
5.4. Final Result ... 139
5.5. Conclusions ... 140
Chapter 6 Experimental Results ... 141
6.1. Introduction ... 141
6.2. Motor Drive Mode ... 141
6.3. Slow Charging Mode ... 142
6.4. Conclusions ... 145
Chapter 7 Conclusions ... 147
7.1. Main achievements ... 147
7.2. Future Work ... 149
References ... 151
Appendix A Estimative of the Maximum Distortion Value of the Stator Inductances in a Synchronous Machine with Salient Poles ... 163
List of Figures
Figure 1.1 – World population prospects between 2014 and 2050, according to estimates provided by the United Nations [1], considering the scenario of no-change in the behavior of the
evolution estimated between 1950 and 2010... 1
Figure 1.2 – Renault ZOE (gently provided by Renault Portugal). ... 4
Figure 1.3 – Nissan Leaf (gently provided by Nissan Portugal). ... 4
Figure 1.4 – Smart Fortwo Electric-Drive (gently provided by Mercedes-Benz Portugal). ... 5
Figure 1.5 – Statistical data of the market of Electric Vehicles (EV) in Portugal (gently provided by ACAP): (a) Car sales per type of vehicle in Portugal during 2014; (b) Total of Battery Electric Vehicles (BEVs) sold in Portugal during the last years; (c) Light duty BEVs sold in Portugal during 2014. ... 6
Figure 1.6 – Comparison of the specific energy of the commercially available batteries with the fuel used for propel vehicles with ICE (sources: [16], [24]). ... 7
Figure 1.7 – Typical electric propulsion system of an EV, using an AC three-phase electrical machine (based on [27]). ... 8
Figure 1.8 – Ideal performance characteristics for vehicle traction purposes (adapted from [38]). ... 9
Figure 1.9 – Charging socket and connector used in the Volkswagen e-Up! (gently provided by Volkswagen Portugal – Siva). ... 9
Figure 1.10 – Public off-board charging stations in Portugal: (a) Slow charging station in Azurém (Guimarães), with an installed power of 3.68 kW [49]; (b) Fast charging station in the service station of the freeway A5 (Oeiras), with an installed power of 55 kW [49] (gently provided by Galp Energia [Manuel Aguiar, Balcão Digital Galp Energia]). ... 10
Figure 1.11 – Charging of a Renault ZOE, using a dedicated EV supply equipment installed (gently provided by Renault Portugal). ... 11
Figure 1.12 – Power electronics components typically installed on-board of an EV and some examples of sources for the battery charging operation. ... 13
Figure 1.13 – Carro Elétrico Plug-In da Universidade do Minho (CEPIUM), the EV developed in the University of Minho: (a) Overview; (b) Power electronics converters and control system implemented under the hood. ... 14
Figure 1.14 – Potentialities of converting vehicles, using a unified motor drive and battery charger: (a): Considering a vehicle with ICE; (b) Considering an EV with a low-power on-board battery charger; (c) Considering an EV without on-board battery charger. ... 16
Figure 2.1 – Typical hardware topology of the motor drive system of an EV. ... 17
Figure 2.2 – Diagram, synthesizing the reported unified topologies studied in this MSc. Thesis. ... 19
Figure 2.3 – Three-phase three-wire boost AC-DC converter (adapted from [60]). ... 20
Figure 2.4 – Unified topology with non-isolated battery charger, discussed in [46], based on using three additional filter inductors and three relays contacts. ... 20
Figure 2.5 – Unified topology with non-isolated battery charger, discussed in [31], combining the features of DC-DC bidirectional converter for motor drive and AC-DC converter for on-board battery charging. ... 22
Figure 2.6 – Unified topology with non-isolated battery charger, discussed in [66], based on using two stator windings as filter inductors for slow charging. ... 25
Figure 2.7 – Equivalent circuit for the battery charging mode of the unified topology with non-isolated battery charger, discussed in [19], based on using all the stator windings as filter inductors for fast charging. ... 26
Figure 2.8 – Unified topology with non-isolated battery charger, discussed in [46], providing fast charging and adapted to electrical machines wye-connected without the neutral point accessible. ... 28
Figure 2.9 – Unified topology with non-isolated battery charger, discussed in [57], based on using a split-windings Permanent Magnet Synchronous Machine (PMSM): (a) Proposed hardware topology; (b) Equivalent circuit for motor drive; (c) Equivalent circuit for battery charging. ... 29 Figure 2.10 – Unified topology with non-isolated battery charger, discussed in [45], based on the
grid connection through the neutral point of the electrical machine. ... 31 Figure 2.11 – Equivalent circuit of the set composed by the windings of the electrical machine and
the three-phase Voltage Source Inverter (VSI) during the battery charging mode, corresponding to a Step-Up (Boost) DC-DC converter (adapted from [72]). ... 31 Figure 2.12 – Unified topology with non-isolated battery charger, discussed in [50], based on the
grid connection through the middle points of the stator windings. ... 33 Figure 2.13 – Unified topology with isolated battery charger, discussed in [61], based on using a
wound-rotor induction machine. ... 35 Figure 2.14 – Unified topology with isolated battery charger, discussed in [41], based on using a
split-windings PMSM: (a) Equivalent circuit for motor drive; (b) Equivalent circuit for battery charging. ... 36 Figure 2.15 – Unified motor drive and battery charger for EVs proposed in this MSc. Thesis. ... 38 Figure 3.1 – Block diagram of the Field-Oriented Control (FOC), described by Pedrosa et al.
(adapted from [69]). ... 43 Figure 3.2 – Block diagram of the Proportional Integral (PI) controller, used in this MSc. Thesis
(adapted from [52]). ... 43 Figure 3.3 – Transformation of the stator currents from the a-b-c coordinate system into the α-β
coordinate system, using the Clarke transform (adapted from [82])... 44 Figure 3.4 – Transformation of the stator currents from the stationary reference frame α-β coordinate
system into the rotating reference frame d-q coordinate system, using the Park transform (adapted from [82]). ... 45 Figure 3.5 – Space Vector of Vref in the α-β plan (adapted from [69]). ... 47
Figure 3.6 – Examples of gate signals obtained through the comparison of variables the ta, tb and tc
with a triangular-wave: (a) Considering Vref placed in sector I; (a) Considering Vref placed in
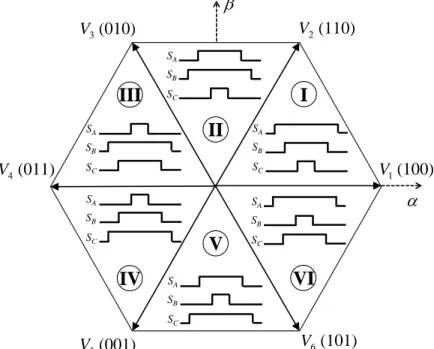
sector III. ... 50 Figure 3.7 – Space Vector Pulse Width Modulation (SVPWM) pattern, according to the sector where
Vref is placed, known as the hexagon of the SVPWM (adapted from [82]). ... 50
Figure 3.8 – Gate signals applied to the power semiconductors of the three-phase VSI, considering an ideal switching behavior. ... 51 Figure 3.9 – Block diagram of the Direct Torque Control (DTC) (adapted from [59], [77], [83]). ... 52 Figure 3.10 – Equivalent circuit of the first stage of the unified topology proposed in this MSc.
Thesis, for the fast charging mode, through an AC three-phase grid supply. ... 55 Figure 3.11 – Block diagram of the Direct Current Control based on Synchronous Reference Frame
(DCC-SRF) (adapted from [39]). ... 56 Figure 3.12 – Block diagram of the Direct Current Control based on Synchronous Reference Frame
(DCC-SRF), changed for attenuate the disturbances due to the use of the windings of a PMSM as filter inductors (adapted from [19]). ... 58 Figure 3.13 – Block diagram of the typical structure of a Phase-Locked-Loop (PLL) system (adapted
from [93]). ... 59 Figure 3.14 – Block diagram of a basic single-phase PLL system (adapted from [93]). ... 60 Figure 3.15 – Block diagram of a single-phase Enhanced Phase-Locked-Loop (EPLL) system
proposed by Karimi-Ghartemani et al. (adapted from [92], [95]). ... 60 Figure 3.16 – Diagram block of three-phase PLL system: (a) q-PLL (adapted from [97]); (b) Basic
SRF-PLL (adapted from [101]). ... 61 Figure 3.17 – Block diagram of a direct current control based on Model Predictive Control (MPC),
Figure 3.18 – Operation principle of the Finite Control Set Model Predictive Control (FCS-MPC) (adapted from [104])... 63 Figure 3.19 – Block diagram of the Direct Power Control based on Model Predictive Control
(DPC-MPC) (based on [109]). ... 67 Figure 3.20 – Equivalent circuit of the unified topology proposed in this MSc. Thesis, for the slow
charging mode, through an AC single-phase grid supply. ... 68 Figure 3.21 – Block diagram for the reference current, proposed to use in the MPC, for the slow
charging mode (adapted from [52]). ... 69 Figure 3.22 – Block diagram for the reference current, proposed to use in the MPC, for the
Vehicle-to-Grid (V2G) operation during the slow charging mode (based on [52]). ... 70 Figure 3.23 – Bidirectional DC-DC converter included in the unified topology proposed in this MSc.
Thesis. ... 70 Figure 3.24 – Equivalent circuit of the bidirectional DC-DC converter operating as a Step-Up
(Boost) DC-DC converter. ... 71 Figure 3.25 – Block diagram of the control algorithm proposed for the bidirectional DC-DC
converter, during the motor drive mode (adapted from [52]). ... 71 Figure 3.26 – Equivalent circuit of the bidirectional DC-DC converter operating as Step-Down
(Buck) DC-DC converter. ... 72 Figure 3.27 – Battery charging comprising two steps: constant-current and constant-voltage (adapted
from [111])... 72 Figure 3.28 –Block diagram of the control algorithm proposed for the bidirectional DC-DC
converter, during the Vehicle-to-Grid (V2G) mode (adapted from [52])... 73 Figure 3.29 – Block diagram of the additional control algorithm proposed for the bidirectional
DC-DC converter during the Vehicle-to-Grid (V2G), through a single-phase connection to the electrical grid (adapted from [52]). ... 73 Figure 4.1 – Brushless DC (BLDC) machine used in this MSc. Thesis (source: Golden Motors). ... 76 Figure 4.2 – Configuration of the stator windings and accessible terminals of the BLDC machine
HPM-20KW. ... 77
Figure 4.3 – Modified configuration of the stator windings and accessible terminals implemented in the BLDC machine HPM-20KW, for maximizing the values of its inductances. ... 77 Figure 4.4 – Setup of the experimental tests performed for obtain the parameters Vpk / krpm and
VRMS / krpm of the BLDC machine used in this MSc. Thesis. ... 78
Figure 4.5 – Experimental results of the voltages vab, vbc and vca (20 V/div) at the terminals of the
BLDC machine, operating as a generator with a rotor speed of 1000 rpm. ... 79 Figure 4.6 – Dynamical model of a li-ion (LiFePO4) battery, proposed by Tremblay et al. in [115]. ... 80 Figure 4.7 – Simulation model of the model of the battery, developed in the software PSIM: (a)
Electrical circuit; (b) Dynamical Model. ... 82 Figure 4.8 – Block representation of the dynamical model of the battery developed in the software
PSIM. ... 83
Figure 4.9 – Simulation results of the voltage at the terminals of the battery pack, connecting the dynamic model of the battery developed to a pure resistive load of 2 Ω, considering that the battery pack is initially full charged. ... 84 Figure 4.10 – Block diagram of the FOC proposed in this MSc. Thesis. ... 85 Figure 4.11 – Simulation model of the power electronics circuit, including the mechanical
components and the sensor blocks, developed in the software PSIM, for the motor drive mode. ... 85 Figure 4.12 – Simulation model of the control system responsible for implementing the FOC,
Figure 4.13 – Simulation results of the torque reference (Tref) and torque (T) produced by the BLDC
machine, during the motor drive mode operating without mechanical load. ... 87 Figure 4.14 – Simulation results of the stator d-q axis reference current iq_ref and the current iq, during
the motor drive mode operating without mechanical load. ... 88 Figure 4.15 – Simulation results of the speed curve, during the motor drive mode operating without
mechanical load. ... 88 Figure 4.16 – Simulation results of the voltages and currents on the BLDC machine, during the
motor drive mode operating without mechanical load: (a) vab, vbc and vca; (b) ia, ib and ic. (The
voltages were filtered through a low-pass filter with a cut-off frequency of 500 Hz). ... 89 Figure 4.17 – Simulation results of the torque reference (Tref) and torque (T) produced by the BLDC
machine, during the motor drive mode operating with nominal load. ... 90 Figure 4.18 – Simulation results of the stator d-q axis reference current iq_ref and the current iq, during
the motor drive mode operating with nominal load. ... 91 Figure 4.19 – Simulation results of the speed curve, during the motor drive mode operating with
nominal load. ... 91 Figure 4.20 – Simulation results of the voltages and currents on the BLDC machine, during the
motor drive mode operating with nominal load: (a) vab, vbc and vca; (b) ia, ib and ic. (The voltages
were filtered through a low-pass filter at 500 Hz). ... 92 Figure 4.21 – Block diagram of the modified DPC-MPC proposed in this MSc. Thesis, for the fast
charging mode... 94 Figure 4.22 – Exchange of the p-q powers in an installation where the chargers of the EVs are used
as reactive power compensators, a feature provided by the control algorithm of the fast charging mode proposed in this MSc. Thesis. ... 96 Figure 4.23 – Flowchart of the proposed modified DPC-MPC, for the fast charging mode... 97 Figure 4.24 – Simulation model of the power electronics circuit, developed in the software PSIM,
for the fast charging mode. ... 98 Figure 4.25 – Simulation model of the control system responsible for implementing the DPC-MPC,
developed in the software PSIM, for the fast charging mode. ... 98 Figure 4.26 – Simulation results of the instantaneous p-q powers (in steady-state), during the fast
charging mode (G2V operation). ... 99 Figure 4.27 – Simulation results of the input voltages and currents, during the fast charging mode
(G2V operation): (a) va, vb and vc; (b) ia, ib and ic. ... 100
Figure 4.28 – Modified simulation model of the power electronics circuit, developed in the software
PSIM, for the fast charging mode with an extra input filter. ... 101
Figure 4.29 – Simulation results of the instantaneous p-q powers (in steady-state), during the fast charging mode (G2V operation) with an extra inductor filter. ... 102 Figure 4.30 – Simulation results of the input voltages and currents, during the fast charging mode
(G2V operation), with an extra inductor filter. ... 103 Figure 4.31 – Harmonic spectrum of the waveform of the current ia, obtained in the simulations of
the fast charging mode (G2V operation), with an extra inductor filter, in comparison with the limits established by the standard IEC 61000-3-4. ... 103 Figure 4.32 – Simulation results of the voltage at the terminals of the DC-bus, during the fast
charging mode (G2V operation), with an extra inductor filter. ... 104 Figure 4.33 – Simulation results of the input currents (during the transitory regime), during the fast
charging mode (G2V operation), considering that the output filter capacitor is fully discharged. ... 104 Figure 4.34 – Modified simulation model of the power electronics circuit, developed in the software
PSIM, for the fast charging mode with an extra input filter and a pre-charge circuit. ... 105
Figure 4.35 – Modified simulation model of the control system responsible for implementing the DPC-MPC, developed in the software PSIM, for the fast charging mode with a pre-charge circuit. ... 106
Figure 4.36 – Simulation results of the input currents, during the fast charging mode (G2V operation), with a pre-charge circuit. ... 106 Figure 4.37 – Simulation results of the voltage at the terminals of the DC-bus, during the fast
charging mode (G2V operation), with a pre-charge circuit. ... 107 Figure 4.38 – Simulation results of the instantaneous p-q powers (in steady-state), during the fast
charging mode (G2V operation with reactive power compensation). ... 108 Figure 4.39 – Simulation results of the input voltage va and current ia, during the fast charging mode
(G2V operation with reactive power compensation). ... 108 Figure 4.40 – Simulation results of the instantaneous p-q powers (in steady-state), during the fast
charging mode (V2G operation). ... 109 Figure 4.41 – Simulation results of the input voltage va and current ia, ), during the fast charging
mode (V2G operation). ... 109 Figure 4.42 – Harmonic spectrum of the waveform of the injected current ia, obtained in the
simulations of the fast charging mode (V2G operation), with an extra inductor filter. ... 110 Figure 4.43 – Block diagram of the Direct Current Control based on Model Predictive Control
(DCC-MPC) proposed in this MSc. Thesis, for the slow battery charge mode. ... 111 Figure 4.44 – PLL system proposed in this MSc. Thesis, for the slow charging mode. ... 112 Figure 4.45 – Simulation results of the input voltage vs and respective pllunit signal, obtained by the
PLL system. ... 113 Figure 4.46 – Harmonic spectrum of the waveform of the pllunit signal, obtained in the simulations
of the PLL system, in comparison with the voltage vs. ... 113
Figure 4.47 – Simulation model of the power electronics circuit, developed in the software PSIM, for the slow charging mode. ... 114 Figure 4.48 – Simulation model of the control system responsible for implementing the DCC-MPC,
developed in the software PSIM, for the slow charging mode. ... 114 Figure 4.49 – Simulation results of the input voltage vs and current is, during the slow charging mode
(G2V operation), with an extra inductor filter. ... 116 Figure 4.50 – Harmonic spectrum of the waveform of the current is, obtained in the simulations of
the slow charging mode (G2V operation), with an extra inductor filter, in comparison with the limits established by the standard IEC 61000-3-2. ... 116 Figure 4.51 – Simulation results of the voltage of the DC-bus VDC, during the slow charging mode
(G2V operation), with an extra inductor filter. ... 117 Figure 4.52 – Simulation results of the input voltage vs and current is, during the slow charging mode
(V2G operation), with an extra inductor filter. ... 117 Figure 4.53 – Harmonic spectrum of the waveform of the injected current is, obtained in the
simulations of the slow charging mode (V2G operation), with an extra inductor filter. ... 118 Figure 4.54 – Simulation model of the power electronics circuit, developed in the software PSIM,
for the motor drive mode of the bidirectional DC-DC converter of the proposed unified topology. ... 119 Figure 4.55 – Simulation results of the DC-bus voltage, during the motor drive mode. ... 119 Figure 4.56 – Simulation results of the voltage of the battery pack, during the motor drive mode (the
PSIM_time_step parameter was adjusted for providing a fast dynamic behavior of the battery
pack). ... 120 Figure 4.57 – Simulation results of the current flowing through the battery pack, during the
constant-current mode of the battery charging. ... 120 Figure 4.58 – Simulation results of the voltage at the terminals of the battery pack, during the
constant-current mode of the battery charging (the PSIM_time_step parameter was adjusted for providing a fast dynamic behavior of the battery pack). ... 121 Figure 5.1 – Topology of the proof-of-concept prototype implemented in this MSc. Thesis. ... 123
Figure 5.2 – Finite-state machine of the control system implemented in this MSc. Thesis. ... 125
Figure 5.3 – Diagram describing the proof-of concept prototype and its main components for the implementation of the digital control system proposed in this MSc. Thesis. ... 126
Figure 5.4 – Implemented circuit for the measuring the voltage, using the sensor CYHVS5-25A (adapted from [118]). ... 127
Figure 5.5 – Printed Circuit Board (PCB) developed in the GEPE for the measuring the voltage, using the sensor CYHVS5-25A. ... 127
Figure 5.6 – Implemented circuit for the measuring the current, using the sensor LA 200-P (adapted from [119]). ... 129
Figure 5.7 – PCB developed in the GEPE for the measuring of the current, using the sensor LA 200-P. ... 129
Figure 5.8 – PCB developed in the GEPE for the signal conditioning. ... 130
Figure 5.9 – ControlCARD provided by Texas Instruments to interface with the DSC TMS320F28335... 131
Figure 5.10 – Docking station developed in the GEPE providing an easier and more robust interface with the peripherals of the DSC. ... 131
Figure 5.11 – PCB developed in the GEPE for the control of the drive of the IGBTs. ... 132
Figure 5.12 – PCB developed in the GEPE for control the actuation of the pre-charge circuit. ... 132
Figure 5.13 – Position sensor (RMB28SC from RLS), mounted on the electrical machine. ... 133
Figure 5.14 – PCB developed in the GEPE for interface between the position sensor with the DSC. ... 133
Figure 5.15 – Electronic accelerator pedal used for setting the torque reference in the motor drive mode. ... 134
Figure 5.16 – Human-Machine Interface (HMI), developed in the GEPE, used to provide an easier interface with the control system... 134
Figure 5.17 – IGBT module SKM300GB126D from Semikron (adapted from [122]): (a) Module; (b) Respective pinout. ... 135
Figure 5.18 – PCB developed in the GEPE for the protection of the gates of each module of IGBTs. ... 136
Figure 5.19 – PCB developed in the GEPE for the driver circuit of the IGBTs. ... 136
Figure 5.20 – DC-bus implemented, composed by a pack of capacitors resulting in a total capacity of 10 mF and a maximum voltage of 450 V. ... 137
Figure 5.21 – PCB developed in the GEPE for the protection of the DC-bus. ... 137
Figure 5.22 – Transformers used to reduce the levels of the voltages supplied by the electrical grid. ... 138
Figure 5.23 – Inductor used to implement the extra input filter of proof-of-concept prototype. ... 138
Figure 5.24 – Resistances used for the pre-charge circuit (each one with a resistance value of 100 Ω ±5%, 50 W)... 139
Figure 5.25 – Final result of the implementation of the proof-of-concept prototype. ... 139
Figure 6.1 – Experimental setup of the proof-of-concept prototype implemented in this MSc. Thesis (for the motor drive mode)... 141
Figure 6.2 – Experimental results of the voltages (20 V/div) and currents (2 A/div) of the BLDC machine, during the motor drive mode, operating without mechanical load... 142
Figure 6.3 – Experimental results of the voltage (20 V/div) and current (5 A/div) of the DC-bus, during the motor drive mode, operating without mechanical load. ... 142
Figure 6.4 – Experimental results of the source voltage vs (20 V/div) and respective obtained PLL signal (1 V/div), obtained during the transitory regime in the slow charging mode. ... 143 Figure 6.5 – Experimental results of the source voltage vs (40 V/div) and respective obtained PLL
and the voltage at the terminals of the DC-bus (20 V/div), during the slow charging mode with
VDC_ref = 80 V. ... 144
Figure 6.6 – Harmonic spectrum of the current consumed for the slow charging mode with VDC_ref =
80 V. ... 144 Figure 6.7 – Experimental results of the source voltage vs (20 V/div) and respective obtained PLL
signal (1 V/div), the current consumed is (2 A/div) and its respective reference is_ref (2 A/div)
and the voltage at the terminals of the DC-bus (20 V/div), during the slow charging mode with
VDC_ref = 110 V. ... 145
Figure 6.8 – Harmonic spectrum of the current consumed for the slow charging mode with
VDC_ref = 110 V. ... 145
Figure 7.1 – Proposed solution for a unified motor drive and battery charger, considering an EV with the BLDC machine used in this MSc. Thesis. ... 150
List of Tables
Table 1.1 – EV charging power levels (adapted from [12]). ... 11 Table 2.1 – Allowed switching states for the power semiconductors of a VSI (adapted from [59]). ... 18 Table 3.1 – Identification of the sector where Vref is placed, according to the value of N. ... 47
Table 3.2 – Attribution of the values of t1 and t2, according to the sector where Vref is placed. ... 48
Table 3.3 – Attribution of the ta, tb and tc values, according to the sector where Vref is placed. ... 49
Table 3.4 – Typical look-up table used in the DTC (adapted from [77]). ... 53 Table 3.5 – Voltage vin, according to the switching states of the three-phase AC-DC converter
(adapted from [105])... 65 Table 3.6 – Voltage vin, according to the switching states of the equivalent single-phase AC-DC
converter. ... 69 Table 4.1 – Main characteristics of the BLDC machine (HPM-20KW), used in this MSc. Thesis. ... 76 Table 4.2 – Results of the measurements of the values of inductance and resistance of the windings
of the BLDC machine used in this MSc. Thesis (with the proposed modified configuration). The values of the inductances were measured for a frequency of 20 kHz. ... 78 Table 4.3 – Values of the parameters used in the module of the BLDC machine provided by the
software PSIM, for the simulations of the proposed topology... 79 Table 4.4 – Variables and parameters of the proposed dynamical model of a li-ion (LiFePO4) battery.
... 81 Table 4.5 – Parameters of the model of the li-ion battery developed in the software PSIM, used in
the simulations of the bidirectional DC-DC converter... 83 Table 4.6 – Limits for harmonic content emissions for equipment with RMS input current greater
than 16 A (per phase) (source: IEC 61000-3-4, for simplified connection of equipment [stage 1]). ... 93 Table 4.7 – Parameters used in the simulation of the fast charging operation in the G2V mode. ... 99 Table 4.8 – Main relevant characteristics of the currents obtained in the simulation of the fast
charging operation in the G2V mode. ... 100 Table 4.9 –Additional parameters of the simulations for the fast charging mode in the G2V mode
with an extra inductor filter. ... 102 Table 4.10 – Main relevant characteristics of the currents obtained in the simulations of the fast
charging operation in the G2V mode, with an extra inductor filter. ... 103 Table 4.11 – Limits for emissions of harmonic content for class A equipment with input RMS
currents less than 16 A per phase (source: IEC 61000-3-2). ... 111 Table 4.12 – Parameters used in the simulation of the fast charging operation in the G2V mode. ... 115 Table 4.13 – Parameters of the circuit used in the simulations of the DC-DC converter for the motor
drive mode. ... 119 Table 5.1 – Flags responsible for the transition of states in the finite-state machine of the control
system implemented in this MSc. Thesis. ... 125 Table 5.2 – Main characteristics of the TMS320F28335 (source: [121]) ... 130
Abbreviations
AC Alternating Current
ACAP Associação Automóvel de Portugal
ADC Analog to Digital Converter
BEV Battery Electric Vehicle
BLDC Brushless DC
CCS-MPC Continuous Control Set Model Predictive Control
CEPIUM Carro Elétrico Plug-In da Universidade do Minho
DC Direct Current
DCC-SRF Direct Current Control based on Synchronous Reference Frame
DPC-MPC Direct Power Control based on Model Predictive Control
DSC Digital Signal Controller
DTC Direct Torque Control
EMF Electromotive Force
EPLL Enhanced Phase-Locked Loop
ESR Equivalent Series Resistance
EU European Union
EV Electric Vehicle
FCEV Fuel-Cell Electric Vehicle
FCS-MPC Finite Control Set Model Predictive Control
FOC Field-Oriented Control
G2V Grid-to-Vehicle
GEPE Group of Energy and Power Electronics
GHG Greenhouse Gases
ICE Internal Combustion Engine
IDE Integrated Development Environment
IEEE Institute of Electrical and Electronics Engineers
IGBT Insulated Gate Bipolar Transistor
ISR Interrupt Service Routine
IWC Infrastructure Working Council
LF Loop Filter
MOSFET Metal Oxide Semiconductor Field Effect Transistor
MPC Model Predictive Control
PCB Printed Circuit Board
PD Phase Detector
PFC Power Factor Correction
PHEV Plug-In Hybrid Electric Vehicle
PI Proportional Integral
PLL Phase-Locked Loop
PMSM Permanent Magnet Synchronous Machine
PWM Pulse Width Modulation
RMS Root Mean Square
SAE Society of Automotive Engineers
SPI Serial Peripheral Interface
SPWM Sinusoidal Pulse Width Modulation
SRF Synchronous Reference Frame
SRM Switched Reluctance Machine
SSI Synchronous Serial Interface
SVPWM Space Vector Pulse Width Modulation
USA United States of America
V2G Vehicle-to-Grid
VCO Voltage-Controlled Oscillator
Chapter 1
Introduction
1.1. General Motivations
According to the World Population Prospects: The 2012 Revision [1], published by the United Nations, at 2050 there should exist about 10.21 billion persons all over the world. This represents an increase of 40.8%, comparatively to the value of 7.25 billion estimated for 2014 (Figure 1.1).
Figure 1.1 – World population prospects between 2014 and 2050, according to estimates provided by the United Nations [1], considering the scenario of no-change in the behavior of the evolution estimated between 1950 and 2010.
Related to this expected world population increase is the number of vehicles in circulation. According to the Energy Technology Perspectives 2014 [2], published by the
International Energy Agency, in 2050 the number of light duty vehicles in circulation on
the planet will be around 2000 million. This represents an increase of 900 million (81.8%), with respect to nowadays. These predictions are incompatible with the actual scenario of large-scale use of conventional vehicles with Internal Combustion Engine (ICE) [3], [4]. 0 2 4 6 8 10 T ot al p op ul at io n of b ot h se xe s (b il li on s) Year
World Population Prospects
On one hand, the fuel used for propel vehicles with ICE comes from oil resources, constituting a nonrenewable source of energy. Thus, an increase in the number of those vehicles leads to an increase on the fuel consumption and hence its availability can become compromised [3], [5].
One the other hand, the environmental concerns are growing around the world [6]. The vehicles with ICE are contributing to global warming, as result of the greenhouse gases (GHG) emitted (mainly carbon dioxide [CO2]). Nevertheless, this vehicles also
contribute to the degradation of the air quality, especially in densely populated urban areas. This is caused by the exhaust fumes, containing toxic gases to human health, such
as nitrogen oxides (NOx), carbon monoxides (CO), and unburned hydrocarbons (HC) [3],
[5], [7], [8].
The fossil fuels dependence of nonproducing countries has also contributed to the search for alternatives to the use of vehicles with ICE [9].
Nowadays, the Electric Vehicle (EV) is emerging as the most sustainable alternative to support this expected rise in the number of vehicles in circulation, and to reduce the impact of the transportation sector on the environment [3], [10].
Despite contribute significantly to reduce the local air and noise pollution, the EVs do not ensure by themselves the reduction of the GHG emissions. Their contribution to that reduction is also dependent on the generation processes used to produce the electricity to charge their battery pack [9], [11]. Thus, it is also necessary promoting an electric energy generation based on energy sources with less impact on the environment, such as renewable energy sources [10], [11].
In [11], Doucette et al. concluded that in China and India, unless the power
generation changes to processes with less CO2 impact, the replacement of vehicles with
ICE by EVs will not be able to reduce significantly the global pollution levels of those countries [10].
1.2. Electric Vehicle
In this section is introduced the concept of EV and its derivative concepts reported in the literature. Further is presented a brief description of the evolution of the EV from the beginning until nowadays, focusing on its position relatively to the vehicles with ICE. With respect to nowadays, the recent evolution of the market of EVs in Portugal is analyzed. Finally are described the main power electronics components of an EV, comprising the motor drive and the battery charger.
Understanding the Concept of Electric Vehicle
The EV is mentioned in [3] as being a road vehicle with electrical propulsion. Taking into account this assumption, there are currently a wide range of different types of EVs such as Battery Electric Vehicles (BEVs), Hybrid Electric Vehicles (HEVs), Plug-In Hybrid Electric Vehicles (PHEVs) and Fuel-Cell Electric Vehicles (FCEVs) [3], [8]. A BEV, also mentioned as pure EV [8], consists of an EV with only electric propulsion and whose energy is stored in a battery pack that is charged through the electrical grid, using a plug-in connector [8], [12].
A HEV is a vehicle that combines electric and ICE propulsion [3]. The battery pack installed on-board the HEVs is typically recharged by means of the ICE or through regenerative energy (i.e., without interacting with the electrical grid). There is also a different type of HEV known as PHEV, which results from a HEV having more electric range [13], due to the capability of the battery pack be charged from the electrical grid, using a plug-in connection, such as the BEVs [8], [14].
Finally, FCEVs are EVs that use a battery pack [15], but also fuel cells in order to produce electrical energy from hydrogen [14]. This technology has a long-term potential, but is stills at an early stage of development [3].
The focus of this MSc. Thesis are the BEVs and thus, from now on in this document, the concept of EV will be referred to BEVs. This, however, does not invalidate that the solution proposed in this MSc. Thesis could it be applied to other types of EVs such as the PHEVs, since they are also charged by means of a connection to the electrical grid.
Brief History and Actual State
The invention of the EV dates from 1834 [8], but it was in the late of the 19th century that it began to be widely used, thanks to the mass production of batteries. The vehicles with ICE at that time were unreliable, since they were usually associated with a bad characteristic odor and the requirement of manual starting of the motor [3], [16].
Later, developments were done in ICEs, such as the arrival of the starter system in 1911. These innovations, along with the limitations of the batteries of EVs and the low oil price at that time, led to a reversal of roles. As a result, in the early 20th century, the vehicles with ICE came to be seen as a better option, leading to the decline of the EVs [16].
Although renegaded to a smaller place, the investigation on EVs was never totally ruled out. In the 1970s some countries revived their interest in EVs, motivated by the energy crisis of 1973 [8], [17].
Nowadays, the EVs are emerging again [18]. This occurs after a period of disappointment for their mass-commercialization around the 1990s [18], as result of the still limited state of development of this technology, particularly with regard to the batteries. However, the developments in this technology, make the modern EV a new technology, totally different from the classic EVs [3].
Recently most well-known manufacturers of vehicles with ICE build their own models of EVs [19]. The Renault ZOE (Figure 1.2) and the Nissan Leaf (Figure 1.3) are some examples. Besides, they also developed EV versions of their well-known ICE-vehicle models, such as the Smart Fortwo Electric-Drive (Figure 1.4) and the Volkswagen
e-Golf.
However, the EVs still have a very low market share comparatively to the ICE ones [18].
Figure 1.2 – Renault ZOE (gently provided by Renault Portugal).
Figure 1.4 – Smart Fortwo Electric-Drive (gently provided by Mercedes-Benz Portugal).
Analyzing the Portuguese Market of Electric Vehicles
According to statistical data gently provided by the Portuguese Automobile Association (ACAP), the Portuguese market of EVs (considering BEVs, PHEVs and HEVs), represented only 1.31% of the vehicle sales during 2014 [Figure 1.5 (a)].
In 2010 the first BEV was sold in Portugal, while the peak in the sales of BEVs occurred during 2014, with a total of 216 BEVs sold [Figure 1.5 (b)]. This can be considered a good signal, especially after a fall period due to the European economic crisis. The most sold light duty BEVs in Portugal during 2014 are presented in Figure 1.5 (c).
Car Sales Per Type of Vehicle in Portugal During 2014
(a) Gasoline: 22.55% Diesel: 75.63% HEV: 1.12% PHEV: 0.06% BEV: 0.13% Liquefied Petroleum Gas
+ Biodiesel + ... : 0.51% Others: 0.70%
Total of BEVs Sold in Portugal During the Last Years
Light Duty BEVs Sold in Portugal During 2014
Figure 1.5 – Statistical data of the market of Electric Vehicles (EV) in Portugal (gently provided by ACAP): (a) Car sales per type of vehicle in Portugal during 2014; (b) Total of Battery Electric Vehicles (BEVs) sold in Portugal during the last years; (c) Light duty BEVs sold in Portugal during 2014.
The EVs have to increase their market representation and become widely used in order to have a significant impact on the environment [19]. Thus, there still important developments required in order to make the EV a strong alternative to the vehicles with ICE [20], [21].
The energy storage capacity and the time required for the charging process are, together with the cost of purchasing, the main limitations that contribute to the less attractiveness of the EVs [20], [21].
The energy storage system of an EV represents a significant part of its total cost, comparatively to a vehicle with ICE. Increase the range of an EV entails significant costs, due to the battery pack but also eventually other required changes in the hardware. Contrarily, in a vehicle with ICE the increase of its range typically only requires enlarging the fuel tank, which represents no significant added cost, considering the total cost of the vehicle [22].
The electric propulsion is more efficient than using an ICE, whose set composed by the ICE, gearbox and transmission system has an efficiency typically around 20% [16], [23]. Thus, an EV typically requires less energy stored than a vehicle with ICE. Besides that, an EV requires significantly less maintenance and repair than vehicles with ICE [3], [22].
However, as presented in Figure 1.6, the amount of specific energy (i.e., the energy stored per kilogram), of the fuel used to propel vehicles with ICE is typically around 9000 Wh/kg [16], while the specific energy of the a li-ion battery, a technology widely
0 18 208 81 193 216 2009 2010 2011 2012 2013 2014 U ni ts s ol d Year 60 59 34 18 10 3 3 1 1 U ni ts s ol d BEV models (c) (b)
used in commercially available BEVs [23], is around 90 Wh/kg [3], [24], representing only 1% of the specific energy of the fuel used in vehicles with ICE.
Figure 1.6 – Comparison of the specific energy of the commercially available batteries with the fuel used for propel vehicles with ICE (sources: [16], [24]).
Another drawback in the use of batteries is its limited life cycle [23] and thus they have to be replaced after a time period.
However, new battery technologies continue to be developed, stimulated by the competition for the development and mass commercialization of BEVs [18].
Motor Drive
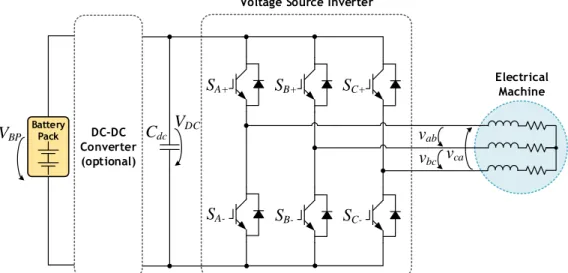
The motor drive system is the core of the electric propulsion system [3], [5], [25], whose typical configuration is described in Figure 1.7. Its typical configuration comprises a three-phase Voltage Source Inverter (VSI) and a wye-connected three-phase AC electrical machine [20], [26].
An additional power stage comprising a bidirectional DC-DC converter is also considered in some cases [15], [21], [27]–[30]. This converter, placed between the battery pack and the DC-bus of the VSI (Figure 1.7), allows reducing the level of the voltage required at the terminals of the battery pack [31]. The transmission and differential systems can also be considered optional [3], taking into account that the electric propulsion system can be motor-in-wheel, i.e., with electrical machine directly coupled to the traction wheels.
30 Wh/kg 50 Wh/kg 65 Wh/kg 90 Wh/kg 100 Wh/kg 230 Wh/kg 9000 Wh/kg 0 1000 2000 3000 4000 5000 6000 7000 8000 9000 Lead Acid NiCad NiMH Li-Ion Zebra Zinc-Air Fuel for ICEs
Specific Energy B atte ry Te ch no lo gy
Comparison of the Specific Energy of the Commercially Available Batteries with the Fuel Used in Vehicles with ICE
Figure 1.7 – Typical electric propulsion system of an EV, using an AC three-phase electrical machine (based on [27]).
There are motor drive systems with the additional feature of exploiting the energy released during downhill or breaking. This technology is known as regenerative braking [3]. It is responsible for converting kinetic energy, during breaking or downhill driving, to electric energy [32] that is used to recharge the battery pack of the EV, using the electrical machine as a generator [3], [32], [33]. Hence, this feature allows increasing the EV’s range (typically between 8% and 25% [34]). For provide more efficient energy recover during those transient moments, the battery of the EV is usually used in conjunction with other energy storage systems, such as flywheels or ultracapacitors [3], [35], [36].
DC machines have been traditionally applied to EVs [3], [25]. They used to be preferred due to their torque-speed characteristic that fits with the ideal performance requirements for traction purposes, presented in Figure 1.8, and their simplicity on the speed control strategies [3], [25]. However, the use of DC machines requires periodic maintenance due to their commutators and brushes [25]. Thus, technological developments have led to commutatorless electrical machines becoming more preferable. Besides their performance, they have typically higher efficiency and reliability, higher power density, lower operating cost and practically a maintenance-free operation [3], [37].
Transmission and Differential
Control System
Break Accelerator Mechanical link
Control Signal Power link Battery Pack DC-DC Converter Electrical Machine DC-AC Converter (Inverter)
Figure 1.8 – Ideal performance characteristics for vehicle traction purposes (adapted from [38]).
Battery Charger
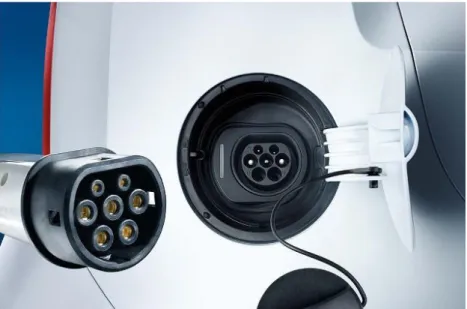
Batteries are the most common source of energy for EVs [14]. Therefore, were developed charging systems in order to provide the power supply, usually from the electrical grid, to charge its battery pack by means of a charging socket and a connector [39]. In Figure 1.9 is presented an example of a charging socket and connector used in the Volkswagen e-Up!.
Figure 1.9 – Charging socket and connector used in the Volkswagen e-Up! (gently provided by Volkswagen
Portugal – Siva).
International organizations such as the Institute of Electrical and Electronics Engineers (IEEE), the Society of Automotive Engineers (SAE) and the Infrastructure Working Council (IWC) are responsible for develop standards and codes for the utility/costumer charger interface [12].
An EV has typically two types of battery charging: on-board and off-board (or standalone) charging system [40]–[42].
Power
Torque
The on-board charging system is installed inside the vehicle and thus the cost, weight and space minimization are the main requirements considered [6], [43]. Hence, this system is commonly implemented using low-power converters [6], [43] (typically around 3 kW [26], [41]). Commercially available on-board chargers have a typical power density of approximately 0.6 kW/kg and a weight of 6.2 kg [31]. Hence, the charging has a typical duration of a few hours [44]. Unlike the off-board type, the on-board charging can be done in practically any location, as long as there is an electrical network outlet available [12], [26], [41], for level 1 (slow) charging [40]. Thus, this type of charging contributes to increase acceptance of EVs [45] and to reduce the cost of the infrastructure network for public charging [46], [47].
On the other hand, the off-board charging system uses power electronics converters built-in charging stations, with similar aspect to those used to refuel vehicles with ICEs [30], [46]. This system access directly the DC-bus of the battery pack [48]. Since it is not implemented inside the vehicle, it has lower restrictions than the on-board type. Thus, it is typically composed by higher power electronics converters, allowing thus to perform battery charging with a typically duration of less than 1 hour [44]. In Figure 1.10 two public off-board charging stations in Portugal are presented.
(a) (b)
Figure 1.10 – Public off-board charging stations in Portugal: (a) Slow charging station in Azurém (Guimarães), with an installed power of 3.68 kW [49]; (b) Fast charging station in the service station of the freeway A5 (Oeiras), with an installed power of 55 kW [49] (gently provided by Galp Energia [Manuel Aguiar, Balcão Digital Galp Energia]).
There is also a middle-term charging system, provided by some manufactures of EVs that consists of installing a dedicated supply equipment (commercially known as
“wallbox” [50]), that allows for higher charging power using the on-board battery charging system. One example is the supply equipment provided by Renault (Figure 1.11) that can be installed in the garage for charging at home the Renault ZOE.
Figure 1.11 – Charging of a Renault ZOE, using a dedicated EV supply equipment installed (gently provided by Renault Portugal).
The main charging power levels, respective charger location and other relevant characteristics, applied to the European Union (EU) and United States of America (USA), are summarized in Table 1.1.
Table 1.1 – EV charging power levels (adapted from [12]).
Power Level Types
Charger
Location Typical Use
Energy Supply Interface Expected Power Level Charging Time Vehicle Technology Level 1 (Opportunity) 230 V (EU) 120 V (USA) On-board (single-phase) Charging at home or office Convenience outlet 1.4 kW (12 A) 1.9 kW (20 A) 4-11 h 11-36 h PHEVs (5-15 kWh) EVs (16-50 kWh) Level 2 (Primary) 400 V (EU) 240 V (USA) On-board (single-phase or 3-phase) Charging at private or public outlets Dedicated EV supply equipment 4 kW (17 A) 8 kW (32 A) 19.2 kW (80 A) 1-4 h 2-6 h 2-3 h PHEVs (5-15 kWh) EVs (16-30 kWh) EVs (3-50 kWh) Level 3 (Fast) or 208-600 V Off-board (3-phase) Commercial, like fuel stations for ICE vehicles Dedicated EV supply equipment 50 kW 100 kW 24 min – 1 h 12-30 min EVs (20-50 kWh) Legend: - AC; - DC
The on-board charging system operates with an alternating current (AC). Thus, the charging system can be conductive or inductive. In a conductive charging system the power is transferred directly through metal contacts between the connectors, while in an
inductive charging system the power is transferred magnetically, offering thus more safety [12], [30]. In this MSc. Thesis only conductive on-board charging systems are considered.
A bidirectional power flow capability is also a relevant feature for a battery charger of an EV, since it provides some additional features [51], [52]. In addition to the normal battery charging process, known as Grid-to-Vehicle (G2V) operation mode, it also supports energy injection back to the electrical grid, known as Vehicle-to-Grid (V2G) operation mode, contributing thus to the development of the Smart Grids [12], [52]. Nevertheless, a bidirectional battery charger can also be used to supply home loads during power outages or to supply loads in places without connection to the power grid, known as Grid-to-Home (G2H) operation mode [52].
The battery charging of an EV is typically done by means of an electrical grid connection. Thus, foreseeing the growth of the popularity of the EVs in the near future [30], it must be considered their impact on the power quality of the electrical grid.
The typical configuration of a battery charger consists of an AC–DC converter [53]. This converter imposes a minimum voltage level for the battery pack, related with the peak of the grid voltage [52]. This restriction can be surpassed by placing a DC-DC converter between the DC-bus of the converter and the battery pack, such as for the motor drive system. On the other hand, using two power-stages helps fulfilling the requirements for a proper battery charging. In the first stage, composed by the AC-DC converter, it is ensured sinusoidal current consumption with unitary power factor, while in the second stage, composed by the DC-DC converter, the current and the voltage applied to the battery pack is controlled, according to the battery charging algorithm [52].
The focus of this MSc. Thesis is the battery charging using the power electronics on-board the vehicle. Thus, only two types of battery charging are considered: fast charging, by means of a three-phase grid connection, and slow charging, by means of a single-phase grid connection.
Typically, the EVs have also a small battery pack for feed auxiliary loads such as lights or air conditioning. Thus, the battery pack responsible for feeding the motor drive of the EV is frequently mentioned in the literature as traction battery [54], [55]. For simplifying, in this MSc. Thesis, the traction battery is simply referred as battery pack.
1.3. Problem Statement
Actually, the battery charger is one of the main technical and economical weaknesses of the EVs [56].
The on-board battery charging system is easier and convenient to use. However, the time required to the battery charging operation is still considerably higher than the time required using an off-board charging system or the time required to refuel the fuel tank of a vehicle with ICE [41], [56].
The typical electric device arrangement in an EV (presented in Figure 1.12) comprises two separate circuits for the motor drive and the on-board charger [30], [31].
During the charging process the vehicle is parked and so it is possible to use some of the hardware components of the motor drive system for the on-board battery charging. This is what is referred in this MSc. Thesis as a unified motor drive and battery charger. As a result, this integration process allows reducing the cost, weight and space occupied by the power electronics components inside the vehicle [6], [43].
Figure 1.12 – Power electronics components typically installed on-board of an EV and some examples of sources for the battery charging operation.
1.4. Main Goals
The purpose of this MSc. Thesis is the development of a unified power electronics converter, capable of performing the roles of drive the electrical machine of an EV and also charging its battery pack, so as to optimize the space and weight of the power electronics components on-board the vehicle.
Electrical Machine Transmission and Differential AC-DC Converter Fast Charging Station Charging Station Battery Pack DC-AC Converter (Inverter) Mechanical link Power link DC-DC Converter
The unified converter has to be capable of drive the electrical machine of the vehicle and respond appropriately to the control actions performed by the user.
On the other hand, the battery charger should operate efficiently, with unity power factor and consuming currents with low harmonic content, in order to promote the power quality of the electrical grid. It also has to be capable of deliver back the energy stored in the battery pack to the electrical grid, operating in the V2G mode.
1.5. Relevant Contributions
This MSc. Thesis was developed in the Group of Energy and Power Electronics (GEPE), in the University of Minho. This is a research group whose main field of action is the application of power electronics to energy systems.
The electric mobility is one of the main research themes that the GEPE has been working during the last years, developing electronic power systems for EVs. An example is the project CEPIUM (Plug-In EV of the University of Minho, from the Portuguese
Carro Elétrico Plug-In da Universidade do Minho), presented in Figure 1.13. It consisted
in the conversion of a vehicle with ICE (a Volkswagen Polo 1.0L) into an EV.
Hence, first of all, this MSc. Thesis contributes to enhance the know-how of the GEPE, regarding to the electric mobility, potentiating the development of new solutions in this area.
Figure 1.13 – Carro Elétrico Plug-In da Universidade do Minho (CEPIUM), the EV developed in the University of Minho: (a) Overview; (b) Power electronics converters and control system implemented under the hood.
A unified solution based on the use of the power electronics components typically installed on the motor drive system of an EV contributes to potentiate a widely adoption of this solution.
Using the high power electronics components installed on the motor drive system for the battery charging operation allows for faster charging times, by means of a three-phase grid connection. Hence companies or even individuals having three-three-phase installations could charge their fleet of electric vehicles fast, in their own facilities and without the need of extra equipment.
One concern in this MSc. Thesis was to develop a solution that contributes to potentiate the conversion of vehicles with ICE [Figure 1.14 (a)]. A unified hardware could it simplify the conversion process, offering more advantages to their users such as less space required for the power electronics and a high-power battery charger.
On the other hand, a unified solution potentiates that an EV with a low power on-board charger installed could it be converted into an EV with a high-power on-on-board charger that occupies less space [Figure 1.14 (b)]. Such free space could it be used to install more battery cells, allowing for an increase of the vehicles’ range.
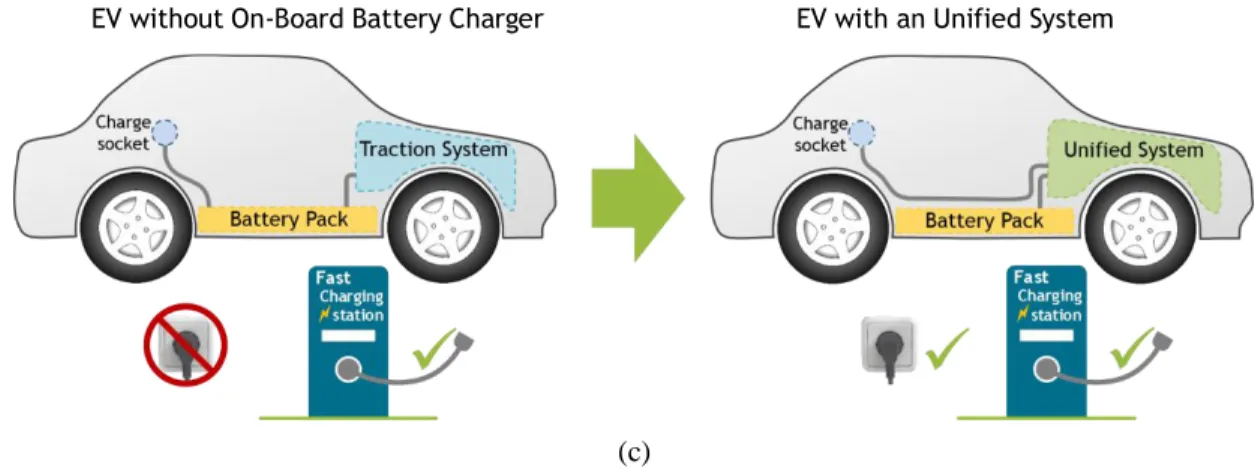
Also the case of having an EV with no on-board charger installed can be considered. This vehicle can only be charged by means of a fast charging station. Thus, converting it into an EV with a unified hardware [Figure 1.14 (c)] provides on-board battery charging without requiring practically no extra space (e.g., the case of a HEV converted into a PHEV, providing thus more electric range).
Vehicle with ICE EV with an Unified System
(a)
EV with Low-Power On-Board Battery Charger EV with an Unified System, Providing High-Power On-board Battery Charging
EV without On-Board Battery Charger EV with an Unified System
(c)
Figure 1.14 – Potentialities of converting vehicles, using a unified motor drive and battery charger: (a): Considering a vehicle with ICE; (b) Considering an EV with a low-power on-board battery charger; (c) Considering an EV without on-board battery charger.
1.6. Outline of this MSc. Thesis
The other chapters of this MSc. Thesis are structured as follows:
In Chapter 2 the main relevant unified hardware topologies reported in the
literature that integrate the functions of motor drive and battery charging are presented and discussed, as well as the unified solution proposed in this MSc. Thesis.
In Chapter 3 the main reported control algorithms for the battery charging
and the motor drive modes that are compatible with the unified solution proposed are presented and discussed.
In Chapter 4 the main obtained simulation results of the proposed unified
solution are described. There are also presented the proposed control algorithms for the battery charging and the motor drive modes.
In Chapter 5 the implementation of the power stage and the control system
of a proof-of-concept prototype of the proposed unified solution is described.
In Chapter 6 the main obtained experimental results from the proof-of-concept prototype implemented are presented.
Finally, in Chapter 7 the main achievements of this MSc. Thesis are


![Figure 2.13 – Unified topology with isolated battery charger, discussed in [61], based on using a wound- wound-rotor induction machine.](https://thumb-eu.123doks.com/thumbv2/123dok_br/17375901.798255/63.893.153.784.495.720/figure-unified-topology-isolated-battery-charger-discussed-induction.webp)
![Figure 2.14 – Unified topology with isolated battery charger, discussed in [41], based on using a split- split-windings PMSM: (a) Equivalent circuit for motor drive; (b) Equivalent circuit for battery charging](https://thumb-eu.123doks.com/thumbv2/123dok_br/17375901.798255/64.893.124.729.389.924/unified-topology-isolated-discussed-windings-equivalent-equivalent-charging.webp)
![Figure 3.17 – Block diagram of a direct current control based on Model Predictive Control (MPC), using SVPWM (based on [108])](https://thumb-eu.123doks.com/thumbv2/123dok_br/17375901.798255/90.893.132.719.713.1021/figure-block-diagram-direct-current-control-predictive-control.webp)
