UNIVERSIDADE DE LISBOA
FACULDADE DE CIÊNCIAS
DEPARTAMENTO DE FÍSICA
Data Mining applied to Neurorehabilitation Data
Maria Salomé Coimbra Carmelo
Mestrado Integrado em Engenharia Biomédica e Biofísica
Perfil de Engenharia Clínica e Instrumentação Médica
Dissertação orientada por:
Paloma Chausa, Grupo de Bioingeniería y Telemedicina, Universidad Politécnica de
Madrid, Madrid, España
Prof. Dr. Nuno Matela, Instituto de Biofísica e Engenharia Biomédica, Universidade de
Lisboa, Lisboa, Portugal
“A felicidade pode ser encontrada, mesmo nos momentos mais sombrios, se alguém se lembrar apenas de acender a luz.”
“Happiness can be found, even in the darkest of times, if one only remembers to turn on the light.”
Acknowledgments
I would first like to thank to my external supervisor, Paloma Chausa. This report is being delivered in the first place because you accepted me to work with you. I felt a huge support during the whole internship and I am very grateful for everything.
Ao meu supervisor interno, o Professor Nuno Matela, queria agradecer não só pelo apoio, pela disponibilidade e pela compreensão (especialmente na fase final) como por, principalmente, ter aceitado ser meu orientador e mostrar logo de início entusiasmo pelo tema em que ia fazer a minha investigação. Um gigante obrigada.
También quería dar las gracias a todas las otras personas de GBT que me han acompañado los siete meses que estuve haciendo las practicas. A Profesor Enrique y a Profesora Elena les agradezco por su apoyo. A mis compañeros en la oficina, a los dos Joses, a Gemma, a Nacho, a Sandra, a Ana, a Estefanía, a Elisa: gracias por las charlas en los desayunos, pelas risas en las comidas, por todo el apoyo, que ha sido fundamental.
I want to thank to Prof. Dra. Ernestina Menasalvas for her availability and to Juan Tuñas for showing me the wonders of SPSS.
Quería hacer un agradecimiento muy especial, de todo corazón, a mis dos jefes de proyecto en Abassy, Marta y Leuvys. Si no fuera por vuestra bondad, nunca habría entregado esta tesis dentro del plazo.
A las dos personas que más me hicieron sentir que había elegido bien el sitio para hacer mis prácticas, Clara y Nacho, muchas gracias por vuestra amistad y por haberme integrado con tanta facilidad.
Às minhas duas meninas, Rita e Margarida, bem-dito seja o dia em que perguntei se alguém queria vir comigo passear. Obrigada pelas escapadinhas, pelas palhaçadas e por me terem feito aproveitar muito melhor o Erasmus. Tenho imensas saudades vossas! Também ao grupinho de portugueses que conheci logo no início da minha estadia: à Vânia, ao Paulo e à Joana, deram-me a motivação que precisava para começar bem a minha viagem, obrigada.
Às doze pessoas que me fizeram sentir em casa todo o tempo em que estive fora: Mariana, Inêses, Ritas, Tatiana, Tomás, Marta, Francisca, Filipe, Tânia, obrigada por tudo. Um obrigada extra às três que me deram abrigo nas suas respetivas cidades para que eu pudesse aproveitar para cumprir este sonho que tenho de viajar e conhecer coisas novas.
Queria agradecer, com especial carinho, a toda a minha família próxima pelas palavras de apoio constantes, incluindo ao Acácio, pelo carinho desde o primeiro dia e por tomar tão bem conta de um dos diamantes da minha vida. Claro que esta família não poderia deixar de incluir também os meus três amigos de quatro patas que com as suas brincadeiras me impediram de passar um único dia sem rir. À minha irmã, Madalena, obrigada por não me deixares esquecer que o amor deve ultrapassar todas as barreiras. Por nunca abdicares das coisas em que acreditas e por teres sido e continuares a ser o primeiro número na minha lista de contactos.
Aos meus pais, quero não só agradecer-vos como dedicar-vos este trabalho. Tudo o que sou, tanto a nível pessoal como profissional, é graças a vocês e só espero um dia poder recompensar-vos. Mãe, o teu apoio sempre incondicional, a tua alegria imensa, a forma linda como encaras a vida, tudo isso me deu forças para nunca desistir. És o meu ídolo a seguir. Pai, obrigada por nunca deixares de acreditar que eu sou capaz, por estares sempre presente quando preciso e por teres sempre uma palavra para me dar. És o meu porto de abrigo. Nunca existirão palavras suficientes neste mundo para vos agradecer.
Resumo
Apesar de não serem a principal causa de morte no Mundo, as lesões cerebrais são talvez a principal razão de existirem tantos casos de pessoas que veem a sua vida quotidiana afetada. Tal acontece devido a grandes dificuldades cognitivas que podem ser derivadas de um acidente de automóvel, de uma queda, da presença de um tumor, de um acidente vascular cerebral, da exposição a substâncias tóxicas ou de uma outra qualquer situação que tenha envolvido uma lesão do cérebro. De entre este tipo de lesões podem considerar-se aquelas que são provenientes de traumas por forças externas, ou seja, as chamadas lesões cerebrais traumáticas ou traumatismos crânio-encefálicos. É precisamente em pessoas que sofreram uma lesão desse tipo que se foca este estudo. Em pessoas que, depois dessas lesões, foram sujeitas a um tratamento de neuro reabilitação. Este tratamento, baseado na realização de tarefas especialmente desenhadas para estimular a reorganização das ligações neuronais, permite que os doentes tenham a possibilidade de voltar a conseguir realizar tarefas do dia-a-dia com a menor dificuldade possível. O objetivo da realização destas tarefas é a estimulação da capacidade de plasticidade cerebral, responsável pelo desenvolvimento das conexões sinápticas desde o nascimento e que permite ao cérebro voltar a estabelecer o seu funcionamento normal depois de uma lesão. Naturalmente, o grau de afetação de uma pessoa depende do tipo de lesão e tem uma grande influência não só no tempo de recuperação física e mental, como também no seu estado final.
O estudo documentado neste relatório de estágio constitui um meio para atingir um objetivo comum a outros trabalhos de investigação nesta área; pretende-se que os tratamentos de neuro reabilitação possam vir a ser personalizados para cada paciente, para que a sua recuperação seja otimizada. A ideia é que, conhecendo alguns dos dados pessoais de um doente, considerando informação sobre o seu estado inicial e através dos resultados de testes realizados, seja possível associá-lo a um determinado perfil disfuncional, de características bastante específicas, para o terapeuta poder adaptar o seu tratamento. O Institut Guttmann, em Barcelona, foi o primeiro hospital espanhol a prestar cuidados a doentes de lesões medulares. Hoje em dia, um dos seus muitos projetos chama-se GNPT Guttmann NeuroPersonalTrainer e leva a casa dos seus doentes uma plataforma que lhes permite realizar as tarefas definidas pelos terapeutas, no âmbito dos seus tratamentos de neuro reabilitação. Dados desses doentes, incluindo informação démica e resultados de testes realizados antes e depois dos tratamentos, foram cedidos pelo Institut Guttmann ao Grupo de Biomédica e Telemedicina (GBT) sob a forma de bases de dados. Através da sua análise e utilizando ferramentas de Data Mining foi possível obter perfis gerais de disfunção cognitiva e descrever a evolução desses perfis, o principal objetivo desta dissertação. Encontrar padrões em grandes volumes de dados é a principal função de um processo de Data Mining, tratando o assunto de forma muito genérica. Na verdade, é este o conceito utilizado quando são abordados temas de extração de conhecimento a partir de grandes quantidades de dados. Há diversas técnicas que o permitem fazer, que utilizam algoritmos baseados em funções estatísticas e redes neuronais e que têm vindo a ser melhoradas ao longo dos últimos anos, desde que surgiu a primeira necessidade de lidar com grandes conjuntos de elementos. O propósito é sempre o mesmo: que a análise feita a partir destas técnicas permita converter a informação oculta dos dados em informação que pode ser depois utilizada para caracterizar populações, tomar decisões ou para validar resultados. Neste caso, foram utilizados algoritmos de Clustering, um método de Data Mining que permite obter grupos de elementos semelhantes entre si, os clusters, considerando as características de cada um destes elementos. Dados de 698 doentes que sofreram um traumatismo craniano e cuja informação disponível nas bases de dados fornecidas pelo Institut Guttmann satisfazia todas as condições necessárias para serem considerados no estudo, foram integrados num Data Warehouse - um depósito de armazenamento de
dados - e depois estruturados. A partir de funções criadas em SQL - a principal linguagem de consultas e organização de bases de dados relacionais - foram obtidas as pontuações correspondentes aos testes realizados pelos doentes, antes do início do tratamento e depois de este ser terminado. Estes testes visaram avaliar, utilizando cinco diferentes níveis de pontuação correspondentes a cada grau de afetação (0 para sem afetação, 1 para afetação suave, 2 para afetação moderada, 3 para afetação severa e 4 para afetação aguda), três funções estritamente relacionadas com o nível cognitivo, a atenção, a memória e algumas funções executivas. As pontuações obtidas para cada uma das funções constituem uma média ponderada da pontuação cada uma das subfunções (atenção dividida, atenção seletiva, memória de trabalho, entre outras), calculadas por pelo menos um dos 24 itens de avaliação a que cada pessoa foi sujeita. De seguida, foram determinados os grupos iniciais e finais, recorrendo a uma ferramenta muito útil para encontrar correlações em grandes conjuntos de dados, o software SPSS. Para determinar a constituição dos clusters iniciais foi aplicado um algoritmo de Clustering designado K-means e, para os finais, um outro denominado TwoStep. A principal característica desta técnica descritiva de Data Mining é a utilização da distância como medida de verificação da proximidade entre dois elementos de um cluster. Os seus algoritmos diferem no tipo de dados a que se aplicam e também na forma como calculam os agrupamentos de elementos. Para cada um dos clusters, e de acordo com cada uma das funções, foi observada a distribuição das pontuações, através de gráficos de barras. Foram também confrontados ambos os conjuntos de clusters para se poder interpretar a relação entre eles.
Os clusters, que neste contexto correspondem a perfis de afetação cognitiva, foram validados, e concluiu-se que permitem descrever bem a população em estudo. Por um lado, os seis clusters iniciais determinados representam de uma forma fiel, e com muito sentido do ponto de vista clínico, os conjuntos de pessoas com características suficientemente definidas que os distinguem entre si. Já os três clusters finais, usados para retratar a população no final do tratamento e analisar as evoluções dos pacientes, retratam perfis bastante opostos, o que permitiu, de certa forma interpretar com maior facilidade para que pacientes o efeito da neuro-reabilitação foi mais ou menos positivo.
Alguns estudos citados no estado de arte revelaram que algumas variáveis são suscetíveis de influenciar o estado final de um doente. Aproveitando a existência de dados suficientes para tal, foi observado se, tendo em conta os clusters finais, se poderia fazer alguma inferência sobre o efeito de algumas das variáveis – incluindo a idade, o nível de estudos, o intervalo de tempo entre a lesão e o início do tratamento e a sua duração – em cada um destes. No final, considerando apenas as pontuações dos testes em cada função, antes e depois dos tratamentos, foram analisados e interpretados, recorrendo a gráficos, os desenvolvimentos e a evolução global de cada doente. Como desenvolvimentos possíveis, foram tidos em conta os casos em que houve melhorias, agravamentos e também os casos em que os doentes mantiveram o seu estado. Fazendo uso da informação sobre a forma como evoluíram os pacientes, foi possível verificar se, de facto, utilizando apenas os valores das pontuações obtidas nos testes, se poderia ou não confirmar que outras variáveis poderiam ter efeitos na determinação do estado final de um paciente. Os gráficos obtidos demonstraram que há diferenças muito subtis considerando algumas das variáveis, principalmente entre os dos doentes que melhoraram e os dos doentes que viram a sua condição agravada. Concluiu-se que o facto de os clusters agruparem pessoas com tipos de evolução diferentes levou a que o efeito de outras variáveis se mostrasse muito disperso.
O tipo de investigação sugerido para futuros desenvolvimentos inclui: (i) o estudo das outras hipóteses de perfis apresentados pelo software usado (SPSS); (ii) considerar os diferentes aspetos das funções avaliadas a um nível mais detalhado; (iii) ter em conta outras variáveis com possíveis efeitos no estado final de um doente.
Abstract
Although they are not the leading cause of death in the world, brain injuries are perhaps the main reason why there are so many cases of people who see their daily lives affected. This is due to the major cognitive difficulties that appear after brain lesion. Brain injuries include those that are derived from traumas due to external forces – the traumatic brain injuries. This study is focused in people who, after these injuries, were subjected to a neuro rehabilitation treatment. The treatment, based on tasks specially designed to stimulate the reorganization of neural connections, allows patients to regain their abilities to perform their everyday tasks with the least possible difficulty. These tasks aim to stimulate the brain plasticity capacity, responsible for the development of synaptic connections which allows the brain to re-establish its normal functioning after an injury.
The study documented in this internship report constitutes another step for a major goal, common to other studies in this area: that neuro rehabilitation treatments can be personalized for each patient, so that their recovery is optimized. Knowing some of the personal data of a patient, considering information about their initial state and through the results of tests performed, it is possible to assign a person to a certain dysfunctional profile, with specific characteristics and for the therapist to adapt treatment. One of his many projects of the Institut Guttmann (IG) is called GNPT Guttmann NeuroPersonalTrainer and brings into its patients’ home a platform that allows them to perform the tasks set by the therapists in the context of their neurorehabilitation treatments. Data from these patients, including clinical information and test results performed before and after the treatment, were provided by the IG to the Biomedical and Telemedicine Group (GBT) as databases. Through its analysis and using Data Mining techniques it was possible to obtain general profiles of cognitive dysfunction and to characterize the evolution of these profiles, the objective of this work.
Finding patterns and extracting knowledge from large volumes of data are the main functions of a Data Mining process. An analysis performed using these techniques enables the conversion of information hidden in data into information that can later be used to make decisions or to validate results. In this case, Clustering algorithms, which build groups of elements with the similar characteristics called clusters, were used. Also, data from 698 patients who suffered brain trauma and whose information available in the databases provided by the IG satisfied all the conditions considered necessary were integrated into a Data Warehouse and then structured. The scores corresponding to the tests performed before and after the treatment were calculated, for each patient. These tests aimed to evaluate, using five different punctuation levels corresponding to each degree of affectation, three functions strictly related to cognitive level: attention, memory and some executive functions (cognitive processes necessary for the cognitive control of behavior).
The initial and final clusters, representing patients’ profiles, were determined, using the SPSS software. The distribution of the scores over the clusters was observed through bar graphs. Both groups of clusters were also confronted to interpret the relationship between them. The clusters, which in this context correspond to profiles of cognitive affectation, were validated, and it was concluded that, at this moment, they represent well the state of patients under study. As some variables, like age and study level, are likely to influence the final state of a patient, it was observed if, given the final clusters, some inference could be made about the effect of those variables. No valuable conclusions were taken from this part. Also, considering the tests scores, patients’ evolution was identified as improvements, aggravations and cases where the conditions is maintained. Using that information, conclusions were extracted, regarding the population and the variables effect. The plots obtained allowed us to correctly describe the patients’ evolution and also to see if the variables considered were good descriptors of that evolution. A simple interpretation from of the facts allows to conclude that the calculated are good general, but not perfect descriptors of the population. The type of research suggested for future developments includes: (i) the study of the other hypothesis of profiles presented by the Data Mining software; (ii) consider the different aspects of the functions evaluated at a more detailed level; (iii) take into account other variables with possible effects on describing the final state of a patient.
Contents
Acknowledgments ... i
Resumo ... ii
Abstract ... iv
List of Figures ... vii
List of Tables ... ix
List of Abbreviations ... x
Preface ... 1
1
Introduction ... 2
2
Background ... 3
2.1 Brain Injury ... 3 2.2 Neurorehabilitation ... 4 2.2.1 Cognitive Functions ... 42.3 The Cognitio Project ... 5
2.4 The Guttmann, NeuroPersonalTrainer® (GNPT) ... 6
2.5 The Intelligent Therapy Assistant (ITA) algorithm ... 7
2.6 Data Mining applied to Neurorehabilitation ... 8
2.6.1 Clustering techniques ... 10
2.6.1.1 Clustering algorithms ... 11
2.6.1.2 Clustering and segmentation ... 13
2.7 Related work: DM techniques in Brain Injury outcome prediction ... 13
2.7.1 Influence of other variables in BI outcome prediction ... 16
2.7.2 Data Mining techniques used for other diseases or conditions ... 16
3
Materials and Methods ... 19
3.1 Data Sources ... 19
3.1.1 Guttmann Clinical Database ... 19
3.1.2 Guttmann NeuroPersonalTrainer Database ... 19
3.2 Software (MySQL, R, SPSS) ... 20
3.3 CRISP-DM Methodology ... 20
3.3.1 Data Understanding ... 21
3.3.1.1 The Clinical Process ... 21
3.3.1.2 Neuropsychological Assessment ... 21
3.3.2 Data Preparation ... 23
3.3.2.1 ETL: Integration Procedure ... 24
3.3.2.2 The Data Warehouse ... 24
3.3.2.3 Getting the Pre and Post test scores ... 25
3.3.3 Data Analysis ... 27
3.3.3.1 Finding Cognitive Profiles ... 27
4
Results ... 32
4.1 Finding the Initial and Final Cognitive Profiles ... 32
4.2 Distribution of tests scores by the Initial and Final Profiles ... 42
4.3 Relation between the Initial and Final Profiles ... 45
4.4 Influence of other variables in the evolution of a patient ... 47
4.5 Improvement, Worsening and Maintenance ... 50
4.5.1 Factors that may influence the type of evolution ... 52
6
Conclusion and Future Work ... 60
7
References ... 61
Appendix ... 65
List of Figures
Figure 2.1 - The Rehabilitation Process followed by the Guttmann, NeuroPersonalTrainer, taken from [15] ... 7 Figure 2.2 - The process of attribution of a cognitive profile to a patient. Taken from [15] ... 8 Figure 2.3 – Examples of partitioned Clustering (on the left) and hierarchical Clustering (on the right)
[22] ... 10 Figure 2.4 - Schematic representation of the steps taken by a k-Means algorithm ... 11 Figure 2.5 – Schematic representation of a Cluster Feature Tree, taken from [27]. ... 12 Figure 2.6 - Schematic representation of the steps taken by an agglomerative hierarchical clustering
method. ... 12 Figure 2.7 - Predictive decision tree model used in [36] showing GCS as the best predictor for 1 month after injury ... 15 Figure 2.8 - Algorithm used for learning the conditional probabilities and for the prediction of the
patient’s label. Figure taken from [37] ... 15 Figure 2.9 - Comparison of the accuracy between three classifier methods: Naïve Bayes, Decision
Trees and Average k-Nearest Neighbor for a different number of attributes (12 and 13). Graphic taken from [42] ... 17 Figure 2.10 - The Maitreya Framework used in the study carried out in [46] ... 18 Figure 3.1 - Schematic representation of a common CRISP-DM flow ... 20 Figure 3.2 - Schematic representation of the clinical process flow which ends with the computation of
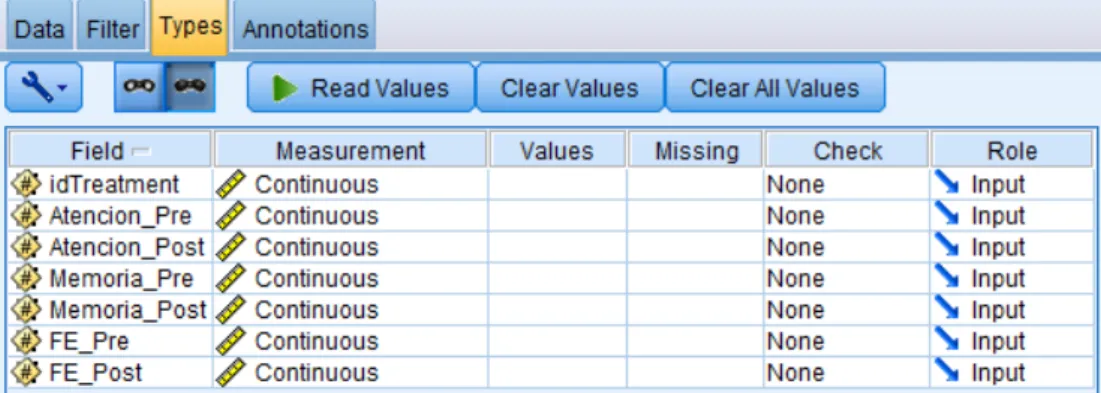
the global improvement level. ... 21 Figure 3.3 - Screenshot of the MySQL Workbench with all the tables displayed on the left and
showing the kind of data contained in one table (administrative_data) ... 25 Figure 3.4 - Screenshot of an Excel file containing all the scores, for each treatment, for each pre and
post function. ... 27 Figure 3.5 – Screenshot of the IBM SPSS Modeler’s initial Stream ... 28 Figure 3.6 - Example of how to start building a flow in IBM SPSS Modeler with a Source and Type
node ... 28 Figure 3.7 - Screenshot of the box where it is possible to edit all the parameters from the source data 29 Figure 3.8 - Screenshot of the box where it is possible to edit all the parameters related to the type and
format of the source data. ... 29 Figure 3.9 – Screenshot of the box to select the models to be used by SPSS to determine the best
clusters for the source’s data ... 30 Figure 3.10 – Screenshot of the box used to set more specific parameters for the Kohnonen node, like
the size of the two-dimensional output map. ... 30 Figure 4.1 - Screenshot of the box used to select which one of the calculated SPSS models shall be
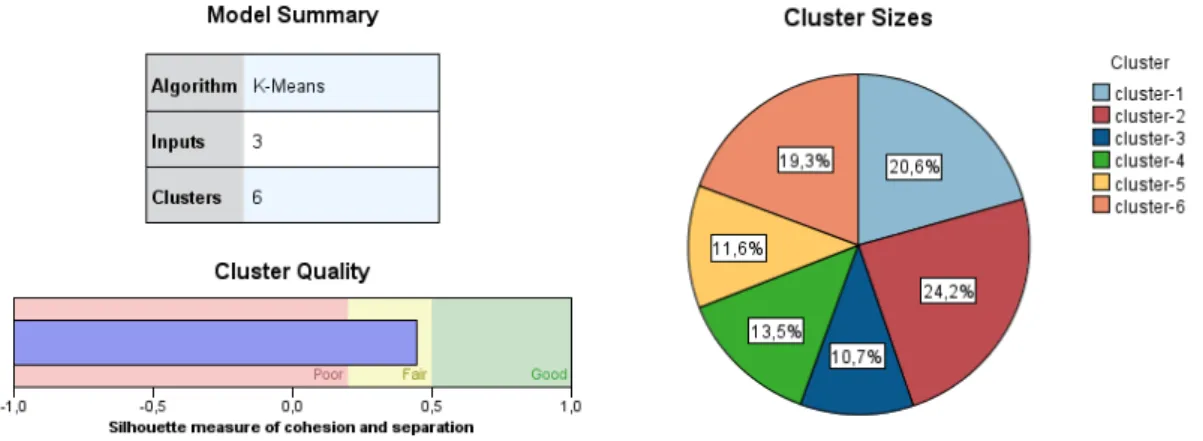
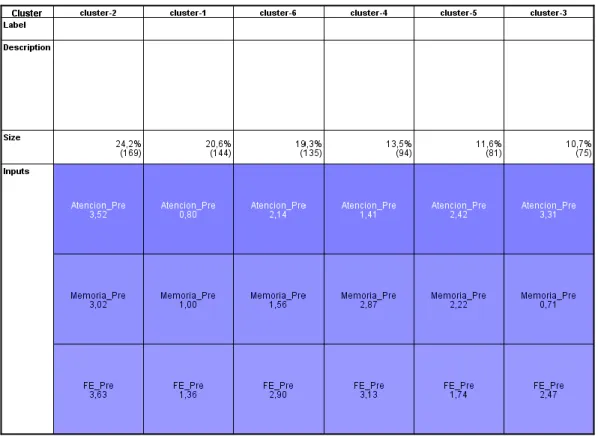
used to build the initial clusters, containing information about each one of them. ... 33 Figure 4.2 - Graphics showing the characteristics of the chosen k-Means model with 6 clusters ... 33 Figure 4.3 - Information about each one of the six clusters regarding the Predictor importance for
every input ... 34 Figure 4.4 - Example of a cell distribution plot where it is possible to look at the distribution of the
scores over the Attention function and compare it with the distribution over the entire cluster. . 35 Figure 4.5 - Screenshot of a table provided by SPSS that shows the assignation of the initial clusters
for each treatment, according to each function. ... 35 Figure 4.6 - Cell distribution plots displaying the distribution of the patients over the scores for
Attention (on top), Memory (in the middle) and Execute Functions (bottom for each cluster). .. 36 Figure 4.7 - Screenshot of the box used to select which one of the calculated SPSS models shall be
used to build the final clusters, containing information about each one of them. ... 38 Figure 4.8 - Graphics showing the characteristics of the chosen TwoStep model with 3 clusters ... 38 Figure 4.9 - Information about each one of the three clusters regarding the Predictor importance for
Figure 4.10 - Table provided by SPSS that shows the assignation of the final clusters for each
treatment, according to each function ... 39
Figure 4.11 - Cell distribution plots displaying the distribution of the scores for Attention (on top), Memory (in the middle) and Execute Functions (bottom). ... 40
Figure 4.12 - Resultant table from the exclusive selection of the patients belonging to initial cluster 1. ... 41
Figure 4.13 - SPSS flow used to obtain the histograms for each function, considering only the patients from the initial cluster 1 ... 42
Figure 4.14 - Histograms showing the number of patients for each score and Post function, for cluster 1 ... 42
Figure 4.15 - Distribution of the scores obtained in the Attention Post function over the initial clusters ... 43
Figure 4.16 - Distribution of the scores obtained in the Memory Post function over the initial clusters ... 43
Figure 4.17 - Distribution of the scores obtained in the E.F Post function over the initial clusters ... 44
Figure 4.18 - Distribution of the scores obtained in the Attention Pre function over the final clusters 44 Figure 4.19 - Distribution of the scores obtained in the Memory Pre function over the final clusters . 44 Figure 4.20 - Distribution of the scores obtained in the Executive Pre functions over the final clusters ... 45
Figure 4.21 - Distribution graphic of the final profiles (3) by the initial profiles (6) ... 46
Figure 4.22 - Distribution of the gender, considering the initial (left) and final (right) clusters ... 47
Figure 4.23 - Distribution of the age classes of the patients over the final clusters ... 48
Figure 4.24 - Distribution of the studies of the patients over the final cluster ... 48
Figure 4.25 - Distribution of the break classes of the patients over the final clusters ... 49
Figure 4.26 - Distribution of the number of tasks of performed patients over the final clusters ... 49
Figure 4.27 - Distribution of the duration of the patient’s treatment over the final clusters ... 50
Figure 4.28 - Excel file showing by colors, the patients from cluster 1 who improved, who got worse or did not evolve, in each of the functions. ... 50
Figure 4.29 - Excel file showing some of the patients who improved and their correspondent initial and final scores and clusters ... 51
Figure 4.30 - Excel file showing some of the patients who got worse and their correspondent initial and final scores and clusters. ... 51
Figure 4.31 - Excel file showing some of the patients who did not show evolution and their correspondent initial and final scores and clusters. ... 52
Figure 4.32 - Histograms crossing the variables Age, Study level and Gender, using data from the patients who had a global improvement of 1. ... 52
Figure 4.33 - Histograms crossing the variables Age, Study level and Gender, using data from the patients who had a global improvement of 2. ... 53
Figure 4.34 - Histograms crossing the variables Age, Study level and Gender, using data from the patients who had a global improvement of 3. ... 53
Figure 4.35 - Histograms showing the distribution of people according to the time they took to start the treatment after the lesion (in days), for each of the three evolution types. ... 54
Figure 4.36 - Histograms showing the distribution of people according to duration of their treatment (in days), for each of the three evolution types. ... 54
Figure 4.37 - Histograms showing the distribution of people according to the number of tasks they performed in their treatment, for each of the three evolution types. ... 55
Figure 5.1 – Schematic representation of the initial clusters and final clusters and the relation between all of them ... 57
List of Tables
Table 3.1 - Representation of the possible results for the global evolution of a patient considering the evolution in each one of the functions. ... 23 Table 3.2 – Simple representation of the table called “tests_results”, with information about the
treatment, the test and the normalized result obtained. ... 26 Table 4.1 - Schematic colored representation of the score’s distribution over each one of the 6 profiles, for each function ... 36 Table 4.2 - Schematic colored representation of the score’s distribution over each one of the 6 profiles, for each function ... 40
List of Abbreviations
ABI Acquired Brain Injury
AD Alzheimer’s Disease
AKNN Average k-Nearest Neighbor
BI Brain Injury
BN Bayesian Network
BM Bayesian Method
BB.DD Database
CART Classification and Regression Tree
CFT Cluster Feature Tree
CHCT Canadian head CT
CLARA Clustering LARge Applications
CLARANS Clustering LARge ApplicatioNS
CPXR Contrast Pattern Aided Regression
CT Computerized Tomography
DM Data Mining
DW Data Warehouse
DT Decision Trees
EM Expectation-Maximization
ESKD End Stage Kidney Disease
ETL Extract, Transform, Load
ICF International Classification of Functioning, Disability and
Health
IG Institut Guttmann
ITA Intelligent Therapy Assistant
GA Genetic Algorithm
GCS Glasgow Coma Scale
GNPT Guttmann NeuroPersonalTrainer
KDD Knowledge Discovery in Databases
MEG Magnetoencephalography
MRI Magnetic Resonance Imaging
NN Neural Networks
PAM Partitioning Around Medoids
QEEG Quantitative Analysis of the Electroencephalography
RF Random Forest
SFP Simple Feature Picker
SVM Support Vector Machine
TIRP Time Intervals Related Patterns
Preface
The Grupo de Bioingeniería y Telemedicina, or GBT, as an abbreviation, is a research group of the Universidad Politécnica de Madrid (UPM) founded in 1983 and it is the largest telemedicine research center in Spain. The main common aim of the research works carried out in this group is the technological development regarding bioengineering, what includes the application of information and communication technologies in the biomedicine field. This group is also responsible for the coordination of the Biomedical Engineering Degree at ETSIT (Escuela Técnica Superior de Ingenieros de Telecomunicación), the school from UPM where it is headquartered, in Ciudad Universitaria.
The GBT staff is constituted by over 50 members that include not only professors but doctors, pre-doctoral candidates, assistant researchers and graduate students as well. Almost all of them have a strong background in telecommunication engineering. The group itself maintains partnerships with several sectors, hospitals, clinical institutions and other groups in the area of information and communication technology applied to medicine, what benefits the research.
The GBT’s research lines encompass biomedical imaging, diabetes technology, telemedicine and intelligent devices, surgical simulation, planning and image guided surgery, knowledge management and data mining and neurorehabilitation engineering. The proposed work of this dissertation, done in this institution, involves mainly the last two research lines. [1]
The external supervisor of this project was Paloma Chausa, an investigator from the GBT group and the internal supervisor was Prof. Dr. Nuno Matela from Instituto de Biofísica e Engenharia Biomédica, Universidade de Lisboa, Portugal. For purposes of the data-mining application techniques using SPSS, the help of two researchers from the CBT (Centro de Tecnología Biomédica), who are also part of the MiDaS (Minería de Datos y Simulación) research group: Prof. Dra Ernestina Menasalvas and his student in Data Analytics, Juan Tuñas.
1 Introduction
Acquired brain injuries are very often a major cause of death. They can happen due to traumatic (a car accident, a fall, a very hard concussion) or non-traumatic events (stroke, anoxia). When the person does not die after such kind of an event, it is very much possible that that person will end up with very severe consequences, mental and physical that will affect a big part of his or her life. People who have suffered from these events are expected to go under a neurorehabilitation treatment, to do the possible to go back to their healthiest state. Most commonly, this includes performing tasks that will require the activation and exercise of their brain functions. Some people are not too much affected but there might be people who completely lose their cognitive functions, including their Attention or Memory levels which may decrease significantly or even almost disappear. A person’s affectation degree after an accident depends mainly on its severity level. On the other hand, a better or worse response to the treatment depends on that person’s age, gender, study level, antecessors, amongst others. Even the time that passes between the day of the injury and starting the treatment or between the day the treatment starts and its ending might have an influence on the final state of the person. It is because of this that it makes sense that the treatment should be personalized in order to obtain the best improvement possible.
This brings us to the main objective of this study: to obtain dysfunctional profiles to characterize the population at the beginning and at the end of the treatment. This is done by extracting information from tests that evaluate three main cognitive functions (Attention, Memory and five Executive Functions), performed before the treatment starts and after the treatment ends. A comparison between the distributions of the two populations allows an analysis of the patient’s evolution. After this process is clinically validated, the profiles can be used to customize the therapy. A second analysis was designed to assess the effects of other variables on the evolution and final state of a patient. At the end, the global improvement of the patients, considering only their scores in the assessments, is to be calculated.
To reach our main objective, Data Mining (DM) was used. This tool is used whenever one wants to extract knowledge in a large set of data. As DM is used in this study, a technical objective had to be defined. This brings us to the definition of our DM purpose: to get clusters of patients based in the level of the score tests in three cognitive functions that are considered to be the most important when assessing the patient’s state after a brain injury. By using DM, it was also possible to extend the study to access what could be the influence of other variables (age, gender, study level, interval between injury and starting the treatment, duration of the treatment and the number of tasks) in the evolution of a patient. The data from the patients used in this study had to be prepared and shaped so that data mining techniques could be applied and also for the extraction of the final graphics and results. In this document, it is described, step-by-step, how every stage was taken care of. The work here documented is based on data provided by the Institut Guttmann and on the platform they built, together with the GBT, called GNPT Guttmann, NeuropersonalTrainer (described later in this report). Although this dissertation focus on the application of data mining techniques in Neurorehabilitation data, these techniques have also been applied to other diseases, with the same or different approaches. In the Background section, a brief summary of the investigation which has been done in all of these fields is presented, in order to clarify a little bit more the purpose of this Master dissertation work.
2 Background
2.1 Brain Injury
Acquired Brain Injury (ABI) is the global expression used to define one of the most common neurological disorders and it includes all types of brain injuries occurred after birth. ABI may cause multiple temporary or permanent impairments which can be cognitive, physical, emotional or behavioral, in that way leading to a decrease in life quality of the people who suffer from this condition or even to death. It can be caused by either traumatic or non-traumatic events. In the first group, traumatic forces to the head are the main reasons while in the second group the factors are mostly related to illness. These include infections (meningitis or encephalitis triggered by inflammations of the brain), anoxia or hypoxia (due to smoke or carbon monoxide inhalation, exposure to high altitudes, asphyxiation, near drowning, drugs or alcohol abuse, exposure to toxic substances, anaesthetic mishaps and severe asthma or heart attacks), stroke and brain aneurisms, hemorrhages or tumors. [2] [3] [4] ABI is not a genetic or congenital condition and cannot be considered as a degenerative brain condition like Alzheimer’s or Parkinson’s Disease or even Multiple Sclerosis although these diseases may eventually lead to ABI.
Traumatic Brain Injury (TBI) is a type of acquired brain injury and is a consequence of the action of external physical forces [5]. TBI is associated with several symptoms and disabilities that might be experienced right after the injury or only appear weeks after the event and that may lead to long term incapacities or even death. The predominant causes for this condition have a strong relation with age. For young people, it is known that the most effective causes are motor vehicle crashes (which include autos, trucks, motorcycles, bicycles and pedestrians hit by vehicles) and for older people, falls are the main reason. Other causes include sports, firearms and cutting objects. Studies showed that the range of people that are most susceptible to suffer from TBI is between 15 and 24 years old or people with more than 65 years. [6]
Traumatic injuries can occur through two different mechanisms: open head injuries and closed head injuries. Open head injuries consider damages caused by the perforation of the skull by an object. The object may end up getting in contact with the brain directly or cause a piece of bone from the skull to penetrate it. Closed head injuries are the most frequent ones: they do not involve the crushing of the skull and include acceleration followed by deceleration injuries, where the brain still has a forward momentum when it is forced to stop, then hitting the inner surface of the skull. [7] This happens in motor vehicle accidents, falls and in any cases where there is a violent shaking of the head. [8] What aggravates even more the closed head injury picture is that in these cases it is possible that a bleeding or a swelling may occur which increases the intracranial pressure and promotes an injury of the brain cells.
TBI, in almost all the cases, affects abilities, namely cognitive functions that include attention, memory, communication, processing and understanding of information and many others. In a TBI event it is possible that only one region get affected but it is also possible that the injury is spread to other areas of the brain and most times, the nature of the injury is indefinite. Depending on the region of the injury, the brain functions affected may vary. For example, frontal lobes are responsible for consciousness and emotions and so, if the injury happens in that area, there will possibly be problems regarding attention, feelings control and language expression. Also, occipital lobes are totally related to vision, so if the injury happens to be there, the person might as well have problems with locating objects, writing and reading or even episodes of hallucinations. Although sometimes an injury only affects one step of an
activity which takes place in a determined region in the brain, as there is an interrelation between brain functions, it is not always possible to identify the nature of the injury and what is going to be the accurate prognosis for several months or years. [9]
2.2 Neurorehabilitation
If a person who suffers a brain injury does not end up with the worst prognostic, at least an initial treatment is needed. There are some cases when it needs to be surgical, but there are also cases where the treatment serves to help the person restore their daily life. Neurorehabilitation is a medical process which helps the recovery from a nervous system injury and to minimize the side effects from that same injury. This includes cognitive rehabilitation, in which the goal is to reduce the cognitive deficits associated with a brain injury event. The severity degree of a TBI is a signal of short and long-term prognosis. After injuries, in a primary phase the brain might restore the connections by itself – it undergoes through spontaneous recovery. However, there are connections that are not able to go back to their normal state and there is almost always a partial or complete loss of functions. In case of partial loss of brain functions, a training induced rehabilitation is necessary and it has an optimized effect if it has an intensive character, if it is done in the right time after the injury and if the exercises chosen by the therapist are the right ones to stimulate the specific harmed regions of the brain. [10] In rehabilitation, health service professionals work together with brain injury patients to circumvent the fact that there is still no surgical or pharmacological treatment to restore the lost functions and still try to provide them a better life quality. This is only achievable due to an intrinsic property of the nervous system called plasticity. Due to this plastic nature, the brain is able to generate new connections or to modify the existing ones. [11] The reorganization of the neural pathways also lays on the same basic neurobiological processes responsible for the initial behaviors acquired and that means those rearrangements may produce adaptive but also maladaptive responses, which can happen with a higher probability than in a normal brain. Besides that, the great number of heterogeneous injuries and deficits makes it necessary to invest in a customized neurorehabilitation treatment.
2.2.1 Cognitive Functions
Similar to what has been considered in other studies, there are three main functions that Guttmann Institute considers when performing the assessment of a patient’s improvement level. Those include
Attention that can be sustained, selective or divided, Memory that can be either verbal/visual or working
memory and the Executive Functions, divided in five subfunctions, being that planification, inhibition, flexibility, sequencing and categorization. For the final purposes of this work, only the three main functions were the ones considered, although the next step will be to perform the studies considering also the subfunctions. The fact is that each one of the subfunctions considers a different aspect of the main ones and enables a more personalized study of the affectation levels.
Concerning Attention, the sustained attention is about keeping a stable response during an unstopping and repetitive ability, which means, keep the focus in a task for a continuous period without being distracted, for example, keeping focused during a long meeting. Selective attention refers to selecting which tasks to pay attention to. Conscientious act of focusing and avoid distractions from stimulus not only external, as noises, but also unnecessary thoughts. Example: focus on the teacher’s voice in a room full of noisy people. Divided attention requires a simultaneous answering to multiple tasks. When one
needs to process two or more responses or react to two or more different requests at the same time, divided attention is used. For example: check email while participating on a meeting and drive while listening to music or talking and so on. Truth is, what a person does is rapidly alternate between tasks, given the impression of doing them simultaneously.
Having a good visual or verbal memory implies making an immediate recall of the characteristics of a given object (or form) or verbal terms (words), respectively. After being presented to visual or verbal information, the person remembers that specific information in short or long term. For example: telling someone about a conversation call that happened just a few seconds before or remembering a movie. Working memory is the kind of memory used when it is needed to store a determined amount of information, related to a certain topic, for as long as it is needed. This includes writing a master dissertation, studying for a test or remembering to take out the garbage in the morning.
Regarding the Executive functions, there are a lot of theories about which are the ones that should be considered. In this study five were contemplated and they include Planification, Inhibition, Flexibility, Sequencing and Categorization. Planification, highly connected with organization, is the capacity of coordinating thoughts in order to achieve a goal. An example would be to plan a vacation week. Inhibition relates to the ability of resisting to impulses or controlling responses. This happens, for example, when a person tries to stop biting the nails in a stressful situation. Having cognitive Flexibility, which also has a relation with creativity, means to be willing to accept different ideas. For example, when composing music. Sequencing is about the capacity of following or arranging a set of tasks in order. This may happen when someone is learning a new idiom, one of the main tasks is to learn the order of the spoken language. At last, Categorization is the aptitude to find similarities and differences in things, putting them in different groups accordingly to those disparities. For instance, babies are highly motivated to place different toys, considering their shape, into boxes.
2.3 The Cognitio Project
An already concluded project, conducted by the GBT center, the Instituto de Investigación de Inteligencia Artificial del CSIC and the Hospital de Neurorehabilitación Institut Guttmann (IG) in Barcelona, called the COGNITIO project, was focused on the optimization of cognitive rehabilitation in traumatic brain injury. The research works done were based in the fact that a patient-personalized treatment, with constant monitoring and based on clinical assessments, has better effects than a general treatment. The four main objectives of this project included research regarding the physio-pathological mechanisms involved in ABI cognitive rehabilitation, development of new neuro-image techniques to classify and categorize structural injuries from ABI and automatic learning techniques, and to also use knowledge inference, data mining and multi-parametric analysis for optimization of treatments. This work is included in the last objective. Also, it is very common for cognitive and structural disability profiles to be missing. For that reason, one of the first aims has been to propose a cognitive dysfunctional profile based on neuropsychological knowledge and medical imaging studies. Thus, in [12] an ABI dysfunctional profile containing theoretical, structural and neuropsychological information taken from neuroanatomical structures, cognitive functions, neuropsychological assessment data and medical imaging is generated. The authors present a conceptual framework to define the profile and use a KERM (Knowledge Elicitation and Representation Model) system to gather patients’ information based on theoretical models and a priori knowledge regarding cognitive processes. Both the framework and this system favor the improvement of personalized treatments and, they also contribute to provide a better body of ABI neurorehabilitation knowledge. The COGNITIO project was carried out from 2013 to 2015
and it was highly involved with the development of the Guttmann, NeuroPersonalTrainer® platform, presented in the next section.
2.4 The Guttmann, NeuroPersonalTrainer® (GNPT)
The Guttmann, NeuroPersonalTrainer® (GNPT) was developed by a research team from the Guttmann Institute and the GBT and it is the second generation of an already existing tele-rehabilitation platform called PREVIRNEC. GNPT is, by definition, a telemedicine cognitive rehabilitation platform that provides neurorehabilitation services to people who suffered from ABI. It comprises a web application for therapists, who use it to plan and configure the treatments and another application, for patients, who are this way capable of executing the tasks assigned by the therapists and then send back the results to the server once they have finished the set [13]. It was built based on the patients and therapists needs and it came out as a result of a translational research and transfer of technology process in the ICT (Information and Communication Technology) field [14]. The traditional rehabilitation process depends on several factors, namely, it requires a neuropsychologist to supervise the procedures continuously and the patients are needed to go to the clinical center and perform the tasks and tests. The characteristics of the platform are exposed in [11] where the platform developers also established a comparison between this platform and the traditional rehabilitation system. Thus, although the target of this platform are the people with cognitive impairment after ABI, GNPT has also been used in patients with cognitive impairment due to aging or dementia or even in children with disorders of cognitive development. The platform helps the therapists to configure and schedule personalized rehabilitation sessions, to continuously monitor the patient’s performance in tasks and to take decisions having into account the information gathered by a decision support system, this way improving treatment’s effectiveness. Even better, the fact that it is a telemedicine platform, allows the therapists to readjust the treatments even if the patients are at home or at daily centers and not only in neurorehabilitation centers. The patients can even perform all the tasks requested by their therapists in an asynchronously way. In other words, there is not a need for the therapist to be present when the patient performs the exercises. The results are recorded by the platform and the therapist can have access to them later.
The GNPT starts with the assignment of a therapist to a patient. The therapist is responsible for performing a battery of initial tests to assess three cognitive functions: attention, memory and executive functions. The tests items are normalized onto the International Classification of Functioning, Disability and Health (ICF) which allows comparisons with other results and are then stored in the system as Pre tests. The patient’s cognitive profile is computed using these tests, recurring to Data Mining clustering and there is a normalization process, in which some demographic information, including the person’s age and study level, is used. The personalization of the treatment is based on the input parameters that the therapist choses when stipulating daily tasks for the patient to execute considering his or her cognitive profile. The results of the tasks are sent back to the therapist, who decides to adapt the difficulty level for the next tasks according to the performance of the patient. The tasks assigned are always designed with the aim to improve the cognitive functions and autonomy and their suitability is evaluated in terms of ranges of scores between 0 (not suitable) and 100 (completely suitable). The platform uses three different score intervals that include an infra-therapeutic range (below 65% of right answers), a therapeutic range (between 65% and 85%) and a supra-therapeutic range (above 85%), where the difficulty level is assessed to be too high, appropriate and too low, respectively. This allows the system to readjust the difficulty level for the following task, automatically. After this rehabilitation treatment based on tasks, a final battery of tests is performed to evaluate the patient’s improvement
(Figure 2.1). These tests are called the Post tests and are compared to the Pre tests to assess the improvement of the patient.
Figure 2.1 - The Rehabilitation Process followed by the Guttmann, NeuroPersonalTrainer, taken from [15]
The efficiency of this platform was evaluated after three years after its implementation in Institute Guttmann, both in terms of usability and efficiency. The score for usability for each group of users (therapists, patients and administrators) is higher than 70 out of 100 in the SUS (System Usability Scale) and the efficient ratio, in terms of costs and time is 1 to 20 (this rehabilitation platform is cheaper than the traditional face-to-face rehabilitation).
2.5 The Intelligent Therapy Assistant (ITA) algorithm
When using the GNPT platform, as described in the last section, therapists can easily define input parameters to adjust the patients’ treatment accordingly to their level of performance. What the ITA, an integrated functionality, allows is an automatization of that parameter selection. It also helps therapists to plan rehabilitation sessions by selecting the best fitting tasks. The ITA algorithm, described and studied in [15], was developed to consider all the information stored in databases and to use it to compute and find the parameters that make the treatment as suitable to the patient as possible. When evaluating the technical viability of this algorithm, the aim was that the outcomes using ITA would be as good as the ones obtained from the manual planification method. Data Mining is used to generate clusters considering data from groups of patients with similar characteristics (see Figure 2.2). This information is useful to compare treatments and describe the evolution of ABI patients. The PRE tests set is composed of 27 tests in total. After normalization of the data, there is a scoring process of the patient’s performance in each subfunction with a level between 0 (normality) and 4 (very severe impairment). The system then combines the information about the impairment level calculated and information from previous tasks results and assigns the patient to a certain cluster representing a specific cognitive profile. For the automatic assignation of the tasks, the ITA evaluates all of them (from 0 to 100, as previously said, in function of their usage, improvement and clinical scores), in order to select the most appropriate ones for a specific patient. After that, the system groups the tasks in quartiles, from most suitable (SQ1) to less suitable (SQ4). The ITA is set to schedule sessions in sets of 10 tasks at a time and each set is computed taking into account the previous set results. The system picks tasks randomly from all four quartiles until it is time to end the rehabilitation session. In the same way, there are also Difficulty quartiles, built upon the attribution of a weight to each parameter value in each task, from less difficulty (0) to a level n of difficulty. This is to adjust between easy and more demanding tasks. The suggestions given can always be modified by the therapist anytime. The evaluation of the whole system showed that, by comparing the number of times a task was chosen over a different task using the traditional way or the ITA way, there are no significant differences between the improvement values obtained with both
methods. This is, of course, considering that patients improve if at least one main cognitive function performance has increased and they did not get worse in any of the other functions.
Figure 2.2 - The process of attribution of a cognitive profile to a patient. Taken from [15]
2.6 Data Mining applied to Neurorehabilitation
Data mining (DM), as a powerful instrument to extract information from the data, has been widely used since mid-1990 and surged as a solution for the urgent need to manage the great amounts of existing data. By that time, the advent of the World Wide Web required prevailing tools to mine data in a correct way and to obtain the right information from a big set of sources and databases [19]. Throughout the years, it has been applied to many fields including health care, banking, sales and marketing, education, amongst many others. Work has been done regarding different fronts of data mining application not only in neurorehabilitation but also in other fields. New techniques have been applied and some of the existing ones have been improved. The improvements have several goals, being one of them the reduction of the time needed to compute the data, that way making the process of obtaining results faster. Another improvement in the algorithms used is also, for example, the introduction of the so called “latent” variables that help to increase the accuracy of the descriptive models. In the specific case of TBI, the main goals have been to perform different analysis with different techniques to make good diagnostics and to predict the outcome in patients. Some common classification techniques not only include Classification, as the k-Nearest Neighbor, Decision Trees (DT), Support Vector Machines (SVM), Neural Networks (NN) or Bayesian Methods (BM), but also Regressions, Clustering, Association Rules and Sequential Patterns.
DM is widely used to find tendency lines or to extract patterns in big amounts of data. In the neurorehabilitation field, specifically, it can be used to prove the effectiveness of treatments, to describe disability or to predict the recovery of patients with a brain injury. It can also be used to find the variables that are better descriptors of those patients’ condition or better predictors of their recovery. There is an important difference between descriptive or predictive Data Mining. As the terms themselves indicate, a descriptive DM technique uses data from the past for the analysis (Clustering, Association Rule Discovery), while a predictive DM technique tries to determine future results (Regression, Classification). Usually, all the studies start describing the population and then proceed to the prediction part. That prediction part is always performed with the help of a classifier. It is very common to consider DM as one of the five phases of the Knowledge Discovery in Databases (KDD) process, which is a powerful tool for knowledge extraction in big databases. The Data-Mining phase is always preceded by data preparation and processing and followed by data evaluation, interpretation and implementation. [16] Within the scope of COGNITIO’s project, the multidisciplinary research team responsible for the GNPT has published several papers and conferences regarding the application of data mining to ABI
patients’ data in order to predict cognitive outcomes, using machine learning techniques, with the aim of increasing knowledge in the theory of cognitive rehabilitation field. [16], [17], [18])
Many studies have been carried out using all different types of DM techniques. For example, in [17], the authors’ aim was to assess if a set of trained classifiers would correctly predict the improvement in all memory, attention and executive functioning areas and to also evaluate the relevance of certain variables using a feature selection method. It was concluded that it is possible to predict with significant accuracy the outcome of a brain injury using variables like age at injury, etiology or neuropsychological evaluation scores, which are all data registered before the treatment. Having information about diagnosis and treatment is also thought to be enough to know the outcome of a patient, considering other previous patient’s data. For this study, four machine learning techniques were exploited to prove the predictive value of the selected features: a CART (Classification and Regression Tree) method, a k-Nearest Neighbor method, a Naïve Bayes Classifier and a Support Vector Machine.
In [16], it is used the PREVIRNEC platform database (containing demographic, neuropsychological and tasks executions data) to obtain scores from neuropsychological assessments of the memory subfunctions, executed before and after the treatments in the scale from 0 to 4. Through comparison of those pre and post-rehabilitation scores it is estimated if the patient improved or not. Three DM techniques, named Decision Tree (DT), Multilayer Perceptron (MP) and general Regression Neural Network (RNN) are applied to build prediction models for the outcome in patients with ABI. The DM techniques are then validated with a 10-fold cross validation method. The analysis, based on values of specificity, sensitivity, accuracy and on a confusion matrix as well, showed that the first technique (DT) has the best prediction rates. In [18], other data mining techniques are used to predict the outcome: an Artificial Metaplasticity on Multilayer Perceptron (AMMLP), a Backpropagation Neural Network (BNN) and a C4.5 Decision Tree. The patients studied are also from the PREVIRNEC platform database and the variables considered are the cognitive affectation profile, the rehabilitation tasks result and the patient’s outcome after 3 to 5 months of treatment.
As previously mentioned, the work to be developed in this dissertation comes a little bit in the wake of what has already been done and described in this section. In fact, what sets our work apart from what has been done so far is the fact that our intention is to customize therapies to achieve better patient recovery. To do so, it is necessary to characterize the patient very well and take into account how is his/her evolution according to his/her specific therapy. This could be thought as a predictive model, but it has a differential element: it includes information about the therapy, something that is not usually seen in any of the works mentioned in the state of the art. Most of the predictive models only consider the initial state of the patient and the accident data to predict their evolution – leaving the therapy in the background, not giving due importance to the treatment. In our case, the predictive model has not been made yet. Although there are publications release by the IG and the GBT in which predictive models are presented [16][17][18], those were to test algorithms and not to be applied in a real way in the clinic. As a matter of fact, the phase presented in this document is all about correctly describing the data.
Using the patients’ database provided by the Guttmann, NeuroPersonalTrainer platform, with Guttmann Institute patients and other external patients, the main objective was to describe the population, to obtain and define a set of dysfunctional profiles. Due to the available GNPT data that includes information not only about the injury but also about the rehabilitation treatments, several different kinds of analysis could be applied. In this case, different Clustering techniques were applied to obtain dysfunctional profiles.
2.6.1 Clustering techniques
As previously mentioned, clusters are groups of elements that have great similarities between them. Thus, clustering methods are ways to ensure that these groups are well constructed: that the elements that share the same features are in the same group and that elements with huge differences remain apart from one another.
Usually, when trying to solve a problem, there is a principle of “divide and conquer”. Clustering techniques rely on that same basis. This means that the goal using these techniques is to break the big data set into smaller pieces that can be explained in a much simpler way and in which patterns can be found more easily. Clustering can, at least, be classified as either an unsupervised or a supervised machine learning approach [20] (there are authors who also consider semi-supervised and weakly supervised systems). In the first case, which is the most common one, the final number of categories, or clusters, is not known. This is because although there are pre-defined clusters (the initial groups that the user determines), the clustering techniques usually need to adapt to the situation and have the aim to find which is the most appropriate structure and number of clusters. Supervised clustering systems have already set at the beginning which is are the characteristics of the final clusters, including their number, their type, amongst other features and evolve towards that objective [21]. The following presented techniques are all unsupervised techniques.
While there are a lot of clustering techniques more focused in certain data sets, there are two basic ones that are most commonly used: Partitioned clustering (Figure 2.3 on the left) and Hierarchical clustering (Figure 2.3 on the right).
About Partitioned clustering, an element corresponds to exactly one cluster, which means for example that elements 1,2,3 and 4 might belong to cluster 1 but not to any other cluster. In this clustering method, each cluster is indicated to optimize a specific clustering condition independently, being that all of them can optimize the same condition (for example, in k-Means, each cluster tries to minimize the value of the Squared Error Objective Function). On the other hand, in Hierarchical clustering [23], an element can be part of a cluster that is nested in a bigger one, as in a hierarchical tree structure. This means that, for instance, two elements 1 and 2 can be part of one cluster A. That cluster A can also be part of cluster B. Cluster B, besides containing the elements from cluster A, may also include elements 3 and 4. This technique includes two types of algorithms: the agglomerative ones that consider each element as an individual cluster and at each step, join the two clusters that are closest to one another, until only one or k clusters are left and the divisive ones that consider only one single cluster that includes all the members, and that at each step, divides that cluster until each cluster contains an element or until there are k clusters.
2.6.1.1 Clustering algorithms
A clustering algorithm might not apply in the same way to all the data. In fact, there are four parameters that, in a general way, justify the reasons why a certain technique may not apply correctly to a group of data: its size, its dimensionality, the objective function and the structure used [24]. Essentially, it is known that there is a set of characteristics that must be present in a good clustering technique, and those include having the ability to perform well in large data sets with high dimensionality, requiring as minimum information from the user as possible, being able to analyze both single and different attribute types, having the capacity to recognize the best shape for the clusters and eliminating the noise data, the aptitude to ignore the order by which the input records are introduced. At last and ideally, a good algorithm builds clusters that can be used in practical terms and that can be easily interpreted in the end.
Inside the Partitional techniques there are four main algorithms: k-Means, PAM (Partitioning Around
Medoids), CLARA (Clustering LARge Applications) and CLARANS (Clustering LARge ApplicatioNS).
From this group, only the first one was used for the clustering performed in this research. PAM algorithm is an extension of the k-Means, CLARA was developed as a solution for the cost of the PAM algorithm regarding the high number of objects and clusters and CLARANS is nothing more than a combination of the PAM algorithm with sampling methods.
The k-Means algorithm (Figure 2.4) is an iterative clustering procedure that aims to find a local maximum value in each iteration. All the procedure can be described using only four steps: first, the user needs to determine the preferred number of clusters, called as k to assign a n number of elements to. Those k clusters are considered as the initial groups and each one of them is defined by its centroid, which is basically the weighted average (or mean 𝑚") of its elements. Being E the Squared-Error Objective Function, the main goal of this algorithm is to minimize its value when creating a set of k clusters from n elements. Analyzing the expression, it is observed that the E is calculated by using the distance function to calculate the space between an element 𝑥"and the centroid of a cluster 𝑐%, for all elements and for all initial clusters.
𝐸 = -"+, *%+, 𝑥"− 𝑐% ) (2.1)
The k-Means procedure starts by randomly assigning each data element to a cluster k. Then, it computes the cluster centroids and according to the results, it re-assigns each point to the closest cluster centroid. In the end, it calculates again the centroids for the new improved clusters. The last two steps are repeated
Start Number of clusters k
Centroid 𝑐% Distance 𝑥" ↔ 𝑐% Group based on min distance Element switiching? End Y N
until there are no more ways to improve the results. In technical terms, if a result is optimal, there will not be any more elements swapping between two clusters for two consecutive attempts and the value of E will be as small as possible. It is estimated that there will always be more elements (n) than clusters (k). This method is easy to implement and it does not take into consideration the order by which the elements are inputted, what can be thought as advantages. Sadly, there is a high dependency on the initial number of clusters k and the presence of outliers might have a bigger influence on the results than what would be expected.
Regarding hierarchical clustering, the main algorithm is the Two Step. It is a scalable hierarchical type clustering algorithm specially used in data sets with a lot of elements [25]. As the name implies, this technique consists of only two phases: the clustering and the clustering. The first step is to pre-cluster the elements into small groups of data [26]. That means that, in this step, elements are checked one by one in order to be merged or not with the previously formed clusters. In case they are not merged, then they become the first element of a new cluster. This decision is based on the distance criterion. To build the pre-clusters and to review the records, it uses Cluster Feature Tree (CFT).
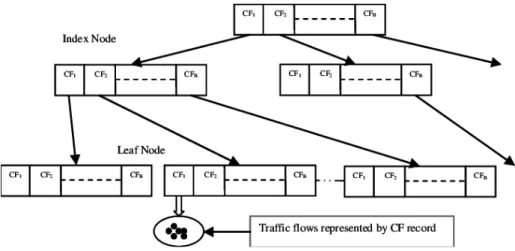
A CFT (Figure 2.5) is a tree whose nodes with several entries (CF1, CF2,…CFB, each CF being the
number of elements in an entry) are placed in several levels. The leaf nodes, containing the leaf entries, are the sub-clusters. All the other nodes, including the root node (the first one) are used to lead the new elements into their correspondent leaf levels. The basic idea is that when a new element entries through the root node, the closest entry in it guides that element to the closest child node that leads it to the its
Start Elem = Cluster Compute distances between clusters Compute Distance Matrix N Update Distance Matrix
End Y Nº clusters = 1 Merge pair w/
shortest distance
Figure 2.5 – Schematic representation of a Cluster Feature Tree, taken from [27].
![Figure 2.1 - The Rehabilitation Process followed by the Guttmann, NeuroPersonalTrainer, taken from [15]](https://thumb-eu.123doks.com/thumbv2/123dok_br/19177362.943792/19.892.109.797.171.332/figure-rehabilitation-process-followed-guttmann-neuropersonaltrainer-taken.webp)
![Figure 2.2 - The process of attribution of a cognitive profile to a patient. Taken from [15]](https://thumb-eu.123doks.com/thumbv2/123dok_br/19177362.943792/20.892.113.787.171.333/figure-process-attribution-cognitive-profile-patient-taken.webp)

![Figure 2.7 - Predictive decision tree model used in [36] showing GCS as the best predictor for 1 month after injury](https://thumb-eu.123doks.com/thumbv2/123dok_br/19177362.943792/27.892.210.688.119.393/figure-predictive-decision-model-showing-predictor-month-injury.webp)