Development of new tools
for the identification of
plants using chloroplast
DNA sequences
Chiara Gabriele Santos
Tese de Doutoramento apresentada à Faculdade de
Ciências da Universidade do Porto, Centro Interdisciplinar de
Investigação Marinha e Ambiental
Biologia
2018
Development of new tools
for the identification of
plants using chloroplast
DNA sequences
Chiara Gabriele Santos
Doutoramento em Biologia
Departamento de Biologia 2018
Orientador
Doutor Filipe Pereira, CIIMAR
Coorientador
NOTA INTRODUTÓRIA
Dissertação apresentada à Faculdade de Ciências da Universidade do Porto para obtenção do grau de Doutor em Biologia, no âmbito do programa doutoral em Biologia.
Esta tese foi escrita ao abrigo do numero 2 do Artigo 4º do Regulamento Geral dos Terceiros Ciclos de Estudos da Universidade do Porto. É composta por um conjunto coerente de trabalhos de investigação, já publicados ou submetidos para publicações em revistas internacionais com arbitragem científica. A autora contribuiu para a execução técnica do trabalho, a interpretação dos resultados, discussão dos dados e a preparação do manuscrito dos artigos incluídos nesta dissertação.
A doutoranda desenvolveu o trabalho com o suporte de uma bolsa de estudos de doutoramento Pleno no Exterior (BEX 013186/2013-02) atribuída pelo Programa Ciências Sem Fronteiras – Capes Brasil. O Centro Interdisciplinar de Investigação Marinha e Ambiental (CIIMAR) forneceu o suporte logístico para o trabalho experimental.
Publicações Artigos publicados
1. Design and evaluation of PCR primers for amplification of four chloroplast DNA regions in plants
Artigos submetidos
2. Identification of plant species using variable length chloroplast DNA sequences 3. PlantAligDB: A Database of Nucleotide Sequence Alignment for Plants
ACKNOWLEDGMENTS /
AGRADECIMENTOS
Ao meu orientador Filipe Pereira. As pessoas que vivem a minha volta sabem da minha admiração e respeito por ele, costumo dizer que devo ter feito muito bem para alguém em alguma vida passada ou em algum momento da minha vida para o universo ter colocado o Filipe no meu caminho. Hoje penso que eu também fiz por tê-lo no meu percurso, eu quem lhe enviei email, que fui buscar saber sobre o trabalho dele e acima de tudo ter aceite o desafio. Que sem sombra de duvidas foi o mais acertado. Não houve uma sequer vez em que estivemos juntos e que ele não me tenha transmitido calma, tranquilidade, segurança, confiança, assertividade e paciência. O que posso dizer, admiro-o como pessoa apesar de conhecer pouco, mas como profissional foi quem mais me ensinou sobre dedicação, sobre gostar do que se faz, sobre fazer aquela magica acontecer, sobre reconforto, sobre a certeza de que tudo vai dar certo, mostrar alternativas, reconhecimento ao esforço, mas ao mesmo tempo sobre criticar e apontar os erros. É desse tipo de pessoas que acredito vir realmente as criticas construtivas, pessoas que já passaram pela mesma situação e que genuinamente a única coisa que querem é o teu bem e o teu sucesso. Obrigada por fazer parte dessa importante etapa da minha vida, obrigada pela paciência, suporte, auxilio e compreensão.
João Carneiro sempre impecável, dedicado e atencioso, obrigada pela parceria. Joana Damas, Joana Gonçalves e professor António Amorim pela atenção e recetividade.
Micaela Vale, Raquel Castelo Branco, Emília Afonso e todos os membros do CIIMAR por me terem acolhido e facilitado a dinâmica do trabalho dentro do instituto.
As minhas amigas Juliana Garcia, Liliana Remuge, Mónica Antunes e Fátima António pelas inúmeras conversas. Cada uma cumpriu lindamente seu papel nessa jornada que talvez não estivesse sendo concluída sem o suporte e insights que cada uma me deu. Com certeza vocês são uma das preciosidades que Portugal me trouxe.
João Miranda, é aquela pessoa pela qual tenho um carinho especial, sem necessidade de explicações. Obrigada por me ouvir, por preocupar-se comigo, por me aconselhar, por acompanhar-me. Indiscutivelmente foste uma pessoa que me acrescentou, e em vários momentos tornou esse percurso mais colorido.
Dilman Faraj por teres, mesmo que distante, me acalentado e tranquilizado com tua companhia e compreensão.
A minha psicóloga Júlia Machado e ao meu terapeuta André Dourado por me terem ajudado a despertar o potencial que tenho dentro de mim quando eu mesma não o encontrava.
Aos colegas Diogo Aguiar, Patrick Nunes, Paulo Peres e Gonçalo Correia pelas inúmeras palavras e gestos de compreensão e apoio.
As amigas Maria Amorim e Inês Ribeiro, pela companhia entre um gel e outro.
As minhas amigas Jéssica Galhotto, Valle Carmona e Fernanda de Bastian que mesmo distantes sempre me enviaram energias positivas.
A minha família por apesar de não perceber muito bem os meus motivos estiveram sempre ao meu lado sendo compreensivos e resilientes.
Ao “Programa Ciências sem Fronteiras” do Concelho Nacional de Desenvolvimento Cientifico e Tecnológico (CNPq) e a Coordenação de Aperfeiçoamento de Pessoal de Nível Superior (CAPES), Brasil pela bolsa de doutoramento BEX: 13186/13-2 e o suporte financeiro.
Finalmente agradeço às seguintes instituições: CIIMAR, I3S e ao Departamento de Biologia da Faculdade de Ciências da Universidade do Porto pelo apoio logístico prestado para a realização desta dissertação.
ABSTRACT
The high genetic diversity of plants is a challenge to those developing new molecular and bioinformatics tools for their characterization. The use of DNA-based methods has facilitated the identification of plants families and species. However, it is clear that efficient methods for the study of most plants are lacking. Although well established in other taxonomic groups (animals and fungi), the DNA barcode concept is not very effective for plants. In this thesis, we started by applying the SPecies Identification by Insertions/Deletions (SPInDel) approach for the identification of plant species. Our method is based on length variation caused by indels polymorphisms in nucleotide sequences. We analysed over 44,000 sequences from 206 plant families. The chloroplast DNA (cpDNA) of plants proved to be particularly suited to the application of our approach. The utility of the SPInDel concept was clear when combining the
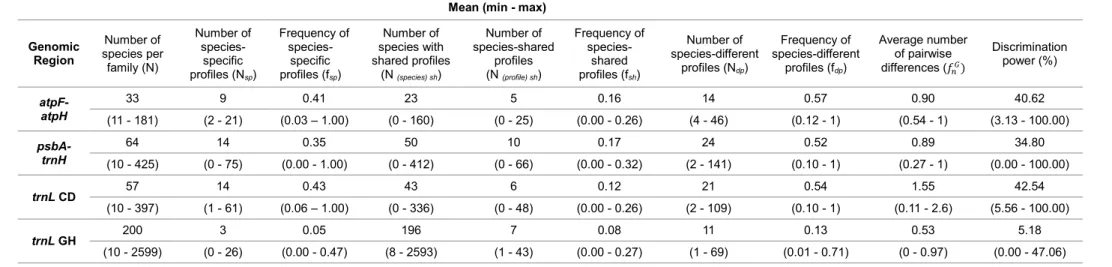
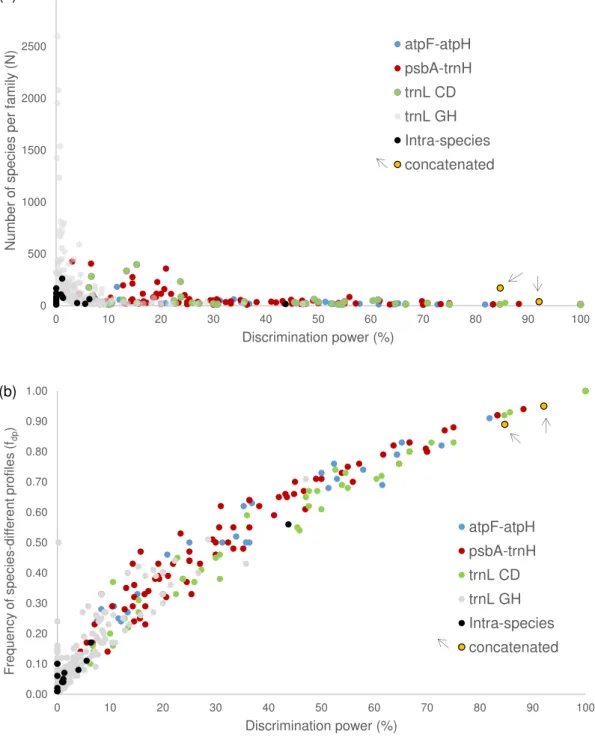
atpF-atpH, psbA-trnH and trnL (UAA) cpDNA regions. The discriminating power of the
selected regions ranged from 5.18% (trnL GH) to 42.54% (trnL CD), whereas when combined, values greater than 90% were obtained. Low intraspecific diversity was also observed in our dataset, demonstrating the effectiveness of the SPInDel approach in discriminating plant species. In the second part of this thesis, we have developed a set of conserved primers that amplify four informative regions of cpDNA (atpF-atpH,
psbA-trnH, trnL CD and trnL GH) in the main plant families (Asteraceae, Brassicaceae,
Iridaceae, Orchidaceae, Poaceae, Rosaceae and Salicaceae). The correct amplification of the four regions in samples from seven major plant families demonstrated the usefulness of our primers, which were obtained through the alignment of more than 11,000 reference cpDNA sequences. Finally, we have built an online database called PlantAligDB (available at http://plantaligdb.portugene.com), including 514 alignments with more than 66,000 reference sequences, belonging to 223 different families for the main genomic regions used in species identification and phylogenetic studies
(atpF-atpH, psbA-trnH, trnL, rbcL, matK and ITS). The PlantAligDB provides a large source of
data that enables the development of molecular markers, to investigate inter and intraspecific variability of genomic regions, among other tools facilitating taxonomic and phylogenetic studies.
RESUMO
A grande diversidade genética das plantas é desafiante para aqueles que desenvolvem novas ferramentas moleculares e de bioinformática para sua caracterização. O uso de métodos baseados em DNA facilitou a identificação de famílias e espécies de plantas. No entanto, é claro que faltam métodos eficientes para o estudo da maioria das plantas. Embora bem estabelecido em outros grupos taxonómicos (animais e fungos), o conceito de DNA barcoding não é muito eficaz para as plantas. Nesta tese, começamos pela aplicação da abordagem de SPecies Identification by Insertions/Deletions (SPInDel) para identificação de espécies de plantas. Nosso método é baseado na variação do comprimento causada por polimorfismos de indels nas sequências nucleotídicas. Analisamos mais de 44.000 sequências de 206 famílias de plantas. O DNA do cloroplasto (cpDNA) das espécies de plantas revelou-se particularmente adequado para a aplicação da nossa abordagem. A utilidade do conceito SPInDel foi eficiente ao combinar as regiões atpF-atpH, psbA-trnH e trnL (UAA) do cpDNA. O poder de discriminação das regiões selecionadas variou de 5,18% (trnL GH) a 42,54% (trnL CD), enquanto que quando combinados foram obtidos valores acima de 90%. Uma baixa diversidade intraespecífica também foi observada em nosso conjunto de dados, demonstrando a eficácia da abordagem SPInDel na discriminação das espécies de plantas de forma rápida e fácil. Na segunda parte desta tese, desenvolvemos um conjunto de primers conservados que amplificam quatro regiões informativas de cpDNA (atpF-atpH, psbA-trnH, trnL CD e trnL GH) nas principais famílias de plantas (Asteraceae, Brassicaceae, Iridaceae, Orchidaceae, Poaceae, Rosaceae e Salicaceae). A amplificação correta das quatro regiões em amostras de sete importantes famílias de plantas demonstrou a efetividade de nossos primers, que foram obtidos através do alinhamento de mais de 11.000 seqüências de cpDNA de referência. Finalmente, construímos um banco de dados online chamado PlantAligDB (disponível em http://plantaligdb.portugene.com), incluindo 514 alinhamentos com mais de 66.000 seqüências de referência, pertencentes a 223 famílias diferentes para as principais regiões genômicas usadas na identificação de espécies e estudos filogenéticos
(atpF-atpH, psbA-trnH, trnL, rbcL, matK e ITS). A PlantAligDB fornece uma grande fonte de
dados que permite o desenvolvimento de marcadores moleculares, investiga a variabilidade inter e intraspecífica das regiões genômicas, entre outras ferramentas que facilitam estudos taxonómicos e filogenéticos.
INDEX
Nota introdutória ... ii Acknowledgments / Agradecimentos ... 7 Abstract ... 10 Resumo ... 11 Index ... 13 List of figures ... 16 List of tables ... 17 List of abbreviations ... 18 CHAPTER I ... 21 Introduction ... 22 Plants ... 22Identification of plant species ... 23
The plant genomes - nuclear DNA (nuDNA) ... 29
The plant genomes - Mitochondrial genome (mtDNA) ... 30
The plant genomes - Chloroplastidial genome (cpDNA) ... 31
Genomic regions for plant species identification ... 34
atpF-atpH ... 34 psbA-trnH ... 34 trnL ... 35 rbcL ... 36 matK ... 36 ITS ... 37
Other genomic regions ... 38
Available DNA sequences and databases ... 39
Laboratory procedures for DNA extraction ... 42
CHAPTER II ... 47
Objectives ... 48
CHAPTER III ... 50
Identification of plant species using variable length chloroplast DNA sequences . 52
Study 2 ... 100
Design and evaluation of PCR primers for amplification of four chloroplast DNA regions in plants ... 101
Study 3 ... 112
PlantAligDB: A Database of Nucleotide Sequence Alignments for Plants ... 113
CHAPTER IV ... 125
DISCUSSION, CONCLUSIONS AND FUTURE PERSPECTIVES ... 126
CHAPTER V ... 139
LIST OF FIGURES
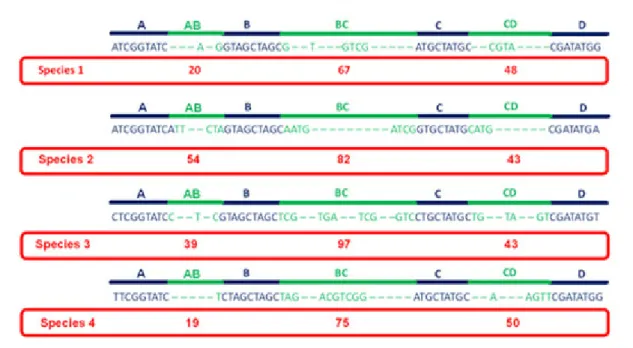
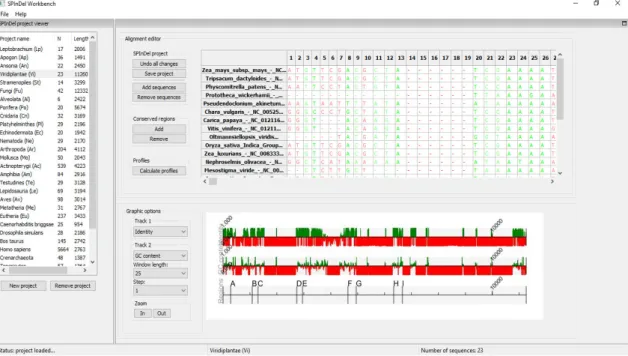
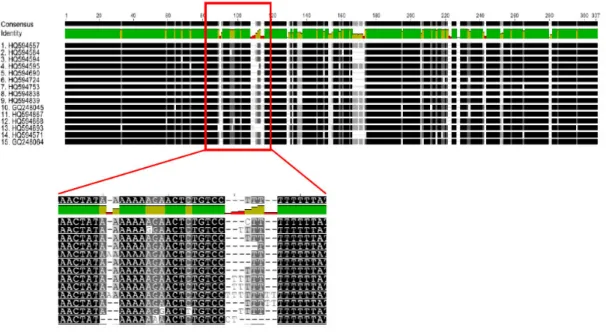
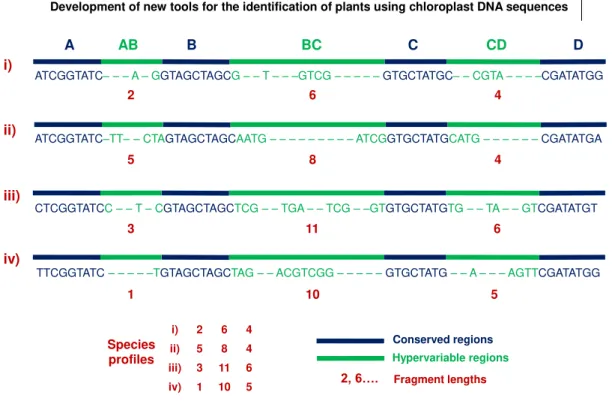
Figure 1. Schematic illustration of the strategy used in the species identification by the insertions/deletions (SPInDel) method. Illustration of the sequence alignment for four hypothetical species. Four conserved regions (blue) define three hypervariable domains (green). Each species is identified by a numeric profile resulting from the combination of lengths in hypervariable regions (red box). ... 28 Figure 2. Main page of SPInDel workbench. The green segments represents conserved regions (potential primer binding sites), and the red ones represent hypervariable regions. ... 29 Figure 3. Representation of cpDNA of Nicotiana tabacum (NC_001879), highlighting the regions analysed in this thesis. ... 32 Figure 4. Example of a multiple sequences alignment. The green blocks represents identity, the conservation degree in that regions for all sequences present in the alignment. The black blocks are conserved regions. The amplified section of the alignment show the nucleotide bases variation in hypervariable regions (grey blocks). ... 41 Figure 5. The discriminatory power (%) of different approaches for the identification of plant species by different combinations of markers (atpF-atpH, ITS, matK, psbA-trnH, psbK-psbI, rbcL, rpoB, ropC1 and trnL). ... 129 Figure 6. Home page of PlantAligDB. ... 134 Figure 7. Schematic representation of genomic regions analysed in PlantAligDB a) atpF-atpH intergenic region, b) psbA-trnH intergenic region, c) trnL (UAA) intron (CD) and P6 loop (GH), d) rbcL gene, e) matK gene and f) ITS (internal transcribed spacer). ... 135
LIST OF TABLES
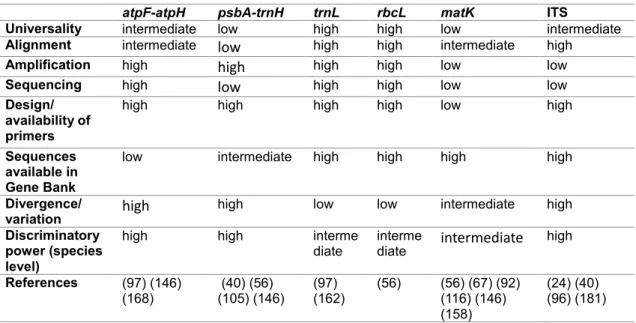
Table 1. Comparative view of interest parameters used in species identification for the analysed genomic regions. ... 38 Table 2. The Discrimination power (%) of the seven plant families analysed for four target regions. ... 128 Table 3. Intraspecific and interspecific diversity in some plant families for four cpDNA genomic regions. ... 130 Table 4. The families with highest and lowest PIS and PPI conservation measure for targets regions analysed in PlantAligDB. ... 136
LIST OF ABBREVIATIONS
3'UTR (Three Prime Untranslated Region)
AT (Adenine Thymine)
atpF (ATP synthase subunit CFO I) atpH (ATP synthase subunit CFO III)
atpI (ATP synthase protein I)
atpA (ATP synthase subunit alpha) atpB (ATP synthase beta subunit) atpE (ATP synthase epsilon subunit)
BLAST (Basic Local Alignment Search Tool) bp (Base Pairs)
CG (Cytosine Guanine) cpDNA (Chloroplast DNA)
CBOL (Consortion for the Barcode of Life)
CTAB (Cetyltrimethylammonium Bromide Detergent Buffer) COI (Cytochrome Oxidase I)
ddNTP (Dideoxynucleotides)
GMO (Genetically Modified Organisms) Indels (Insertions / Deletions)
IR (Inverted Region)
ITS (Internal Transcribed Spacer) Kbp (Kilobase pairs)
LSC (Large Single Copy)
matK (Maturase K)
Mbp (Mega base pair) mtDNA (mitochondrial DNA)
NAD (P) H (Nicotinamide Adenine Dinucleotide Phosphate-oxidase)
NCBI (National Center for Biotechnology Information) ndhF (NADH dehydrogenase F)
NGS (Next-generation sequencing) nuDNA (Nuclear Genome)
PCR (Polymerase Chain Reaction)
psbA (Photosystem II 32 kDa protein)
psbI (Photosystem II reaction center protein I)
rbcL (Rubisco large subunit)
rpoB (RNA Polymerase beta subunit)
rpoC1 (RNA Polymerase beta subunit-1)
rpoC2 (RNA Polymerase beta-prime chain)
rps16 (Ribosomal Protein S16)
rps7 (Ribosomal Protein S7)
rRNA (Ribosomal RNA)
RuBisCO (Ribulose-1,5-bisphosphate carboxylase/oxygenase) SNP (Single Nucleotide Polymorphisms)
SPInDel (Species Identification by Insertion Deletion) SSC (Small Single Copy)
SSR (Simple Sequence Repeat or Microsatellite) tRNA (Transfer RNA)
trnF (tRNA Phenylalanine gene)
trnH (tRNA-His (GUG))
trnK (tRNA-Lys(UUU))
trnL (tRNA-Leu (UAA))
trnQ (tRNA glutamine-specific) trnT (tRNA-Thr (UGU))
trnV (tRNA (Val) UAC)
CHAPTER I
INTRODUCTION
Plants
Plants are extremely variable and dynamic living beings that exhibit an incredible diversity of habits, morphology, anatomy, physiology, reproductive biology, among others. This diversity is a challenge for those who are interested in studying these organisms (Bennetzen 2000, Jansen, Cai et al. 2007, Barolo, Mostacero et al. 2014). Humans obtain food and beverages through the cultivation of plant species (agriculture) (Bommarco, Kleijn et al. 2013, Cassidy, West et al. 2013, Staats, Arulandhu et al. 2016). It is widely recognized that plants have several health benefits. For example, the pharmaceutical industry uses plants to produce several products for therapeutic purposes on a daily basis. The bioactive compounds of the plants are available in the form of tea, medicines, syrups, ointments, oils, sprays, and many others (De Castro, Comparone et al. 2017). Similarly, the cosmetics industry takes advantage of the healing and embellishment properties of plants. Plants are the main source and foundation of all cosmetics like perfumes, shampoos, lotions, creams among others (Aburjai and Natsheh 2003, Mishra, Kumar et al. 2016). Plants are used by architects and landscapers in decoration and ornamentation, and have been used as shelter and protection (Barolo, Mostacero et al. 2014, Lee, Ng et al. 2016). Plants are the primary source of production of living material, and the loss of diversity affects all ecosystems. By this reason, plants are intensively studied by biologists and ecologists working on biodiversity loss, wildlife protection, threat of extinction, targeting traffic and illegal trade (Loreau, Naeem et al. 2001, Teletchea, Maudet et al. 2005, Díaz, Fargione et al. 2006, Karp and Shield 2008, Parker and Helmstetter 2017).
Plant materials can be used in forensic investigations, since it can be associated with the victim, the suspect or the crime scene. Proper identification of plant samples in an archaeological dig helps to understand aspects of ancient human life styles and reconstruct past environments (Coyle, Lee et al. 2005, Kikkawa, Tsuge et al. 2016). Crops plant species are known for be a biological sources to power generation (bioenergy) and liquid transport fuels (Karp and Shield 2008, Yuan, Tiller et al. 2008, Feuillet, Leach et al. 2011). In summary, plants can have various applications and should be studied and protected worldwide.
Identification of plant species
Despite the wide applicability of plants, it is often difficult to attribute the correct species belonging to a particular individual. This difficulty is due to the lack of a universally accepted species concept, the different criteria and methods used in plant classifications and to the high diversity of existing plant species (Joly, Goëau et al. 2016, Parker and Helmstetter 2017). Food, archaeological, herbal or forensic samples are often damaged, fragmented and/or transformed, thus preventing proper identification through morphological characteristics (Kikkawa, Tsuge et al. 2016). The traditional taxonomy system for species identification is limited by this reason. Visual search using different morphological characteristics has lower performance, efficacy and normalization of processes. Using morphology for plant identification is practical and inexpensive, but can be difficult and unsustainable for the diversity of existing plant species (Wang, Wu et al. 2010). Moreover, it has important limitations, such as phenotypic plasticity of some plants, effective morphological keys limited to a specific stage of life or genus, impossibility of identification in samples of mixture and the requirement of a high level of specialization on the part of the taxonomists (Hebert, Cywinska et al. 2003, Li, Ye et al. 2015, Zeng, Zhou et al. 2017).
Given the limitations inherent in using morphological characteristics, it becomes important to develop techniques that ensure their correct identification. Molecular diagnostic approaches and DNA-based methods have become a powerful tool for identifying plant species (Derocles, Evans et al. 2015, Li, Yang et al. 2015). DNA is more stable, resistant and thermostable than proteins are, less affected by external conditions and could potentially be retrieved from any substrate because it is present in almost all cells of an organism (Bustin 2005, Lee, Ng et al. 2016, Mishra, Kumar et al. 2016). DNA markers are independent of morphology, stage of development and environmental factors besides being particularly useful for distinguishing morphologically similar species and having a long stage of vegetative growth. In addition, molecular evolution and phylogenetics have shown that, because of the degeneracy of the genome and the presence of many non-coding regions, DNA can provides more information than proteins do (Teletchea, Maudet et al. 2005, Lin, Lin et al. 2015).
DNA-based techniques have enabled researchers to identify and authenticate several species in a simple, fast and inexpensive way. However, a universally accepted approach to solving all the problems associated with identifying of plants species is not available (Scriver, Marinich et al. 2015). Currently available techniques have different degrees of resolution, information generation and applicability, depending on the
taxonomic level (Nam, Lee et al. 2015, Thomsen and Willerslev 2015). Almost all traditional DNA-based methods rely on the Polymerase Chain Reaction (PCR) to produce multiple copies of the genome region of interest (Hwang, Kim et al. 2015). The PCR technique and its variants can be used to explore specific variations in the DNA sequence, in the identification of species and to track food origins, successfully applied in the detection of Genetically Modified Organisms (GMOs) and pathogens in food products, among others (Moon, Kim et al. 2016). The multiplex PCR is a derivation approach of PCR technique that allows the simultaneously amplification of two or more different DNA sequences in a single reaction by using a combination of different primers. The advantages of this technique are the flexibility, the speed and the reduced cost. The main challenges are the possible inhibition between primer sets, the false amplification and the lack of efficacy in different sample matrixes. The design of primers for multiplex PCR is an important step in the procedure since it is necessary to amplify different targets with the same reaction conditions (Ronning, Rudi et al. 2005, Moon, Kim et al. 2016).
In order to supplement and ensure the data obtained by PCR and electrophoresis, DNA sequencing is the most widely used technique because of its high productivity and accuracy, generating a large amount of data quickly and inexpensively (Feuillet, Leach et al. 2011, Yang, Li et al. 2014, Sarwat and Yamdagni 2016). The main drawback of DNA sequencing approaches is to obtain clear sequences of large regions, particularly difficult in samples with low quality and/or low amounts of DNA (Pereira, Carneiro et al. 2008). The next-generation sequencing technologies (NGS), or high throughput sequencing, handle millions of small DNA fragments in parallel. Despite the production of a large number of sequences at low cost, they require a more purified DNA and the quality of the sequences produced are generally of lower quality and shorter than those obtained by the Sanger sequencing (Cheng, Guo et al. 2003, Feuillet, Leach et al. 2011).
The DNA barcoding concept seeks to identify biological specimens and assign them to a specific species using a standardized genomic region called DNA barcode, which corresponds to small part (<1000bp) that can be easily obtained from the genome (Lahaye 2008, Staats, Arulandhu et al. 2016). The concept of DNA barcode was first proposed by Hebert, Cywinska et al. (2003) and has attracted the attention of the world's scientific community. In order to achieve a good discriminating power, the locus barcode must be sufficiently informative and variable to unequivocally differentiate neighbouring species in its taxonomic group but conserved sufficiently in the same species to define a clear threshold between intra and inter-specific diversity. The sequence variation of a barcode marker between species must be high enough to distinguish them, whereas the
distance within the species must be sufficiently small. This difference in distances is known as the “DNA barcode gap". An effective barcode becomes weak when interspecific and intraspecific distances overlap. Another desirable feature for an ideal barcode locus is to have highly conserved connection sites that allow the reliable amplification and bidirectional sequencing with a single pair of primers. This is particularly important in a mixture of samples so that several species can be identified at the same time (Wang, Wu et al. 2010, Vassou, Kusuma et al. 2015, Kikkawa, Tsuge et al. 2016, Mishra, Kumar et al. 2016). The DNA barcode is a simplified solution for a complex problem that is difficult to apply to all species (Mishra, Kumar et al. 2016). However, this approach has been applied in the authentication of medicinal plants marketed, food safety, monitoring of biodiversity and conservation, control of illicit trafficking of protected species, forensic botany, among others (Hajibabaei, Singer et al. 2007, Zaiko, Martinez et al. 2015, Mishra, Kumar et al. 2016).
The combination of NGS with the DNA barcoding is known as metabarcoding. The meta prefix refers to multiple species identified simultaneously from complex samples such as faeces, soil, seawater and environmental mass samples (Zaiko, Martinez et al. 2015, Valentini, Taberlet et al. 2016). The main limitations associated with the use of DNA metabarcoding are the unavailability of a truly universal extraction method; the discriminatory power of the bioinformatics methods used in the analyses; the PCR bias caused by different primers; the high dependence of a large reference databases with quality sequences based on good taxonomy and coverage; the reduced sequencing costs and the achievement of sufficiently long quality sequences. The approach of DNA barcoding was tested using different genomic regions (Ratnasingham and Hebert 2007, Bhargava and Sharma 2013, Staats, Arulandhu et al. 2016).
The mitochondrial gene cytochrome oxidase I (COI) is considered a universal barcode DNA for animals because the genetic variation of this locus is sufficient to study the process that occurs in relatively short and recent intervals of time, the same way that it has conserved regions that allow the design of primers (Lahaye 2008, Geller, Meyer et al. 2013). However, mitochondrial genes in plants are rarely used for species identification due to their slow evolution, low nucleotide substitution and limited divergence (Staats, Arulandhu et al. 2016, Gualberto and Newton 2017). Nuclear DNA (nuDNA) genes can be used, but their applicability is limited by the absence of conserved primers for their amplification. However, because of sufficient intra-species conservation and interspecies specificity, the nuclear rRNA genes are successfully used as targets for identification of fungal (Wang, Fu et al. 2014) and bacterial species (Marsh, O'Sullivan et al. 2014).
Therefore, the search for a region barcode for plants has been moved to the chloroplast genome (Chen, Yao et al. 2010, Thomsen and Willerslev 2015). The chloroplast DNA (cpDNA) presents valuable regions for phylogenetic analyses of high taxonomic levels. However, methods targeting a single cpDNA locus provided insufficient variability for species identifications (Li, Yang et al. 2015, Staats, Arulandhu et al. 2016). After considerable effort to find a sufficiently informative locus comparable to the COI used in animals, some researchers have suggested a multi-locus approach, where combined barcodes could present increased discrimination of species (Saddhe, Jamdade et al. 2017).
Several groups have tested different combinations, the Plant Working Group (PWG) for the Consortion for the Barcode of Life (CBOL) examined the suitability of seven candidates (matK, rbcL, trnH-psbA, atpF-atpH, rpoB, rpoC1 and psbK- psbI) and proposed the matK and rbcL regions as core barcode for plants. This combination has been suggested because of its universality, easy recovery of rbcL and the good discriminatory power of matK sequences, but it cannot avoid the low effectiveness of
matK in PCR due to lack of universal primers and low power discrimination of rbcL. The
combination offers only a slightly high identification efficiency compared to previous methods. Some researchers suggested the use of the ITS nuclear locus (nrITS) and the
psbA-trnH intergenic space as additional loci. The CBOL recognizes that any
combination is far from ideal (Chen, Yao et al. 2010, Wang, Wu et al. 2010, Vassou, Kusuma et al. 2015, Staats, Arulandhu et al. 2016). An approach based on nuclear and organelle genomes could be more satisfactory because uniparental inheritance can never show the plant complex (Yao, Song et al. 2010).
The multiple locus strategy has opened new avenues for species identification. However, the combination of barcodes increases the difficulties of analysis with respect to the single locus. The failure of the barcode approach is not simply due to the lack of variation but also reflects the differences between the genetic trees of the plastid genes and the species boundary. The combination of loci does not eliminate the inherent deficiencies derived from the plant DNA barcoding. Barcode markers have been proposed to identify hotspots of biodiversity in distant organisms, but few studies have developed barcodes for identification in family, genus or between close relatives. The discriminatory potential of the DNA barcode varies from one family to another (Wang, Wu et al. 2010, Vassou, Kusuma et al. 2015, Saddhe, Jamdade et al. 2017).
The use of the complete cpDNA as a single marker circumvents possible problems such as altered gene order, low PCR efficiency and relatively short DNA sequences (Hajibabaei, Singer et al. 2007, Nock, Waters et al. 2011). The problems
associated with the complete sequencing of cpDNA are the high costs and difficulties associated with obtaining complete sequences. For instance, the complete cpDNA of
Salvia miltiorrhiza is 151,328 bp in length (Qian, Song et al. 2013), the Theobroma cacao
have a chloroplast genome of 160,546 bp (Kane, Sveinsson et al. 2012), the Lactuca
sativa chloroplast DNA is 152,772 bp in length (Timme, Kuehl et al. 2007). However, for
lineages that radiate rapidly, the use of a single genome remains ineffective. Until now, it is not clear whether the complete plastid genome can be considered as an adequate barcode, but the results show that it can contribute to the identification of plant species. Although the cost of sequencing has decreased considerably, current costs for the complete cpDNA sequencing are even greater than those of a single locus barcode by traditional sequencing. Even excluding these factors if plastid identification depends on a fully annotated chloroplast sequence, the necessary analyses can be complex and difficult to normalize (Petit, Duminil et al. 2005, Zeng, Zhou et al. 2017).
The DNA barcoding had a positive impact on biodiversity rankings and identification of plants species. This approach benefits with the development of NGS but is still far from being completely viable to the identification of species, especially at deeper levels. However, despite all the contributions and progress made in species identification techniques, it is expensive and impractical with respect to gel-based DNA markers and is still possible to develop new methods that will help overcome the inherent limitations encountered in this area of science (Pereira, Carneiro et al. 2008, Parker and Helmstetter 2017).
The presence of insertions/deletions (indels) is responsible for length variation of a DNA sequence when comparing samples (Taberlet, Gielly et al. 1991). The study of indels proved helpful in species identification (Jin, Jin et al. 2014, Mahadani and Ghosh 2014). High levels of species identification have been achieved in different taxa (animals, fungi and bacteria) through the determination of the length variation of the sequences caused by the indels (Carneiro, Pereira et al. 2012, Gonçalves, Marks et al. 2015, Hwang, Kim et al. 2015, Alves, Pereira et al. 2017). The use of indels polymorphisms for the identification of species may be advantageous if the intra-species variability is lower than that of SNPs. Indels are less prone to recurrent mutations (i.e. identical insertions or deletions occurring in independent lineages), which means that there is a low probability that similar sequences originated by convergence (homoplasy). The insertion of a nucleotide that restores a previous deletion at the same position or vice versa (a phenomenon known as ‘back mutation’) is also very unlikely in this class of polymorphisms (Pereira, Carneiro et al. 2010).
The SPecies Identification by Insertions/Deletions (SPInDel) method uses the length of hypervariable genomic regions (regions containing multiples indels) that are found interspersed with highly conserved regions (regions presenting none or low sequence variability) that delimitate the variable segments like anchors. Therefore, each species can be identified by a unique numeric profile of fragment lengths resulting from the combination of the length of hypervariable regions (a ‘SPInDel profile’) (Figure 1) (Pereira, Carneiro et al. 2010, Gonçalves, Marks et al. 2015).
The SPInDel method has already been applied to discriminate a large sample of eukaryotes (1556 species) analysed through the rRNA genes of the mitochondrial genome and was able to assign a unique profile to 1451 species (95%) (Pereira, Carneiro et al. 2010). The red fox (Vulpes vulpes) was differentiated from the other species (human, common domestic livestock and Australian endemic wildlife species) through the combination of SPInDel method and multiplex PCR analysis of mitochondrial 12S and 16S gene regions. The strategy proved effective because at least two hypervariable regions had a significant divergence from all samples (Gonçalves, Marks et al. 2015).
Figure 1. Schematic illustration of the strategy used in the species identification by the insertions/deletions (SPInDel) method. Illustration of the sequence alignment for four hypothetical species. Four conserved regions (blue) define three hypervariable domains (green). Each species is identified by a numeric profile resulting from the combination of lengths in hypervariable regions (red box).
The SPInDel workbench is a computational platform that was built to facilitate the planning and project management and alignment of nucleotide sequences, visualization and selection of conserved regions, calculation of the properties of PCR primers properties, prediction of SPInDel profiles and diverse statistical and phylogenetic analyses. It includes a large database comprising nearly 1,800 numeric profiles for the identification of eukaryotic, prokaryotic and viral species. For ‘Viridiplantae’ SPInDel workbench provides 23 sequences (Figure 2). The SPInDel computational workbench available in http://www.portugene.com/SPInDel/SPInDel_web.html can be used with sequence data from any genomic region and is a useful tool to help researchers in all steps of the species-identification workflow.
Figure 2. Main page of SPInDel workbench. The green segments represents conserved regions (potential primer binding sites), and the red ones represent hypervariable regions.
The plant genomes - nuclear DNA (nuDNA)
The nuclear genome of plants is diverse, ranging from 38Mb to 87,000Mb (Arumuganathan and Earle 1991, Bennetzen 2000, Su, Chao et al. 2013, Xu, Chen et al. 2013). The size and complexity of the nuDNA makes difficult its sequencing due to several types of rearrangements like inversions, deletions and translocations, besides
polyploidy and gene duplication (Bennetzen 2000, Feuillet, Leach et al. 2011, Daniell, Lin et al. 2016, Gualberto and Newton 2017). The main factors responsible for the variation in the size of the nuclear genomes of the plant are the ploidy level (from diploid to octaploid and higher); number of repetitions (simple repeating tandem for example) and transposable elements and recurrent exclusions of DNA.
Closely related plant lineages may differ considerably in the size of the genome. Even in smaller genomes, such as Arabidopsis, repeated fragments represent more than 20% of the nuDNA. The low quantity of nuDNA is not always associated with the small size or short life cycle of the species. Within a species, nuDNA tends to be conserved, but between species, it can vary considerably, even among species of the same genus. The size of the genome varies greatly between species but is not related to the size and number of chromosomes. Genes of plants are relatively compact and often grouped with smalls introns. Nuclear genes from a single copy are less influenced by evolution and convergent recombination, but have rarely been used for plant phylogenetic reconstruction (Arumuganathan and Earle 1991, Koch, Haubold et al. 2001, Kellogg and Bennetzen 2004, Feuillet, Leach et al. 2011).
The plant genomes - Mitochondrial genome (mtDNA)
The mitochondrial genome (mtDNA) is derived from an ancestor of endosymbiotic prokaryotes. In most terrestrial plants, the mode of transmission of mtDNA is of maternal heritage. In plants as in other eukaryotes, mtDNA encodes a small number of essential components of the mitochondrial electron transfer chain. For the expression of these genes, the mitochondria have their own translation system, which is also partially encoded by mtDNA, including rRNAs, tRNAs and a varied number of ribosomal proteins. However, all the factors necessary for maintenance of mtDNA and the expression of its genes are encoded in the nucleus and imported from the cytosol, thus placing mtDNA replication, structural organization and expression of the genes under nuclear control (Parson, Pegoraro et al. 2000, Gualberto and Newton 2017).
The number of mitochondrial genes varies considerably between related species and even within a species. Many genomes include unknown genes and can be rapidly gained or lost, contributing to the intraspecific diversity of mtDNA. The mtDNA size is highly variable and the mitochondrial genomes of terrestrial plants are by far the largest, which vary between 200-700kb and can reach 11Mb (in Silene conica) (Gualberto and Newton 2017). Plant mtDNA contains some additional genes and several genes contain introns, characteristics that contribute to a large variation size. The mitochondrial
genome of plants is abundant in non-coding repeated sequences of different sizes and numbers, usually not conserved within a species. The greatest variability in the structural organization of plant mtDNA is the presence of active recombination of long repeats. It is also possible that the mtDNA acquire new exogenous sequences by horizontal transfer derived from cpDNA, nuDNA or viral DNA (Parson, Pegoraro et al. 2000, Petit, Duminil et al. 2005).
The mtDNA of the plants evolves more slowly than of animals and genetic sequences have low nucleotide substitution rates, which does not promote sufficient variability for species discrimination (Bennetzen 2000, Lahaye 2008, Daniell, Lin et al. 2016, Staats, Arulandhu et al. 2016). The reason for this low variability may reside in existence of effective repair pathways, in particular an active homologous recombinant system, which potentially corrects the mutations (Notsu, Masood et al. 2002, Hebert, Cywinska et al. 2003).
The plant genomes - Chloroplastidial genome (cpDNA)
Plastids are essential organelles for plant physiology and development, including the synthesis of amino acids, nucleotides, fatty acids, phytorones, pigments, starches, vitamins and metabolites, the assimilation of sulphate and nitrogen, among others. Metabolites administered by plastids are important for the plant-environment relationship, for example, response to salinity, light, heat, drought, defence against pathogens, among others (Daniell, Lin et al. 2016).
Chloroplasts are a class of essential organelles, distinct and highly specialized plastids present in plant cells and algae. These intracellular organelles carry their own genome coding for many (but not all) genes essential for photosynthesis, so chloroplasts are responsible for capturing sunlight and converting the organic substance (carbohydrates) with the release of oxygen. Taking into account the size, content and gene organization of cpDNA, it is believed that chloroplasts evolved from endosymbiosis of a free-living cyanobacterium and were hosted by a nucleated cell, followed by several eukaryotic symbiosis and massive transfer of chloroplast genes to the nucleus. Although their evolution is strongly related to that of the host cell, the plastid genome does not necessarily follow the same evolutionary history of the host genome. Significantly different substitution rates, structurally independent replication and other biological processes, may lead to a divergent and incongruent evolution between chloroplast, mitochondrial and nuclear loci (Petit, Duminil et al. 2005, Pérez-Escobar, Balbuena et al. 2015, Wang, Cui et al. 2015, Daniell, Lin et al. 2016, Moon, Kim et al. 2016).
The cpDNA can range from 107kb to 2500kb. Despite this variation in length, generally associated with large scale rearrangements, gene duplication and small replicates; cpDNA is considered stable and conserved in terms of structure and genetic content. The cpDNA is present in several copies in one cell (Bennetzen 2000, Ronning, Rudi et al. 2005, Xu, Liu et al. 2015, Daniell, Lin et al. 2016, Gualberto and Newton 2017). The cpDNA is an independent and densely compact molecule of circular structure, usually divided into four sections, two of which are copies of an inverted region, IR-Inverted Region (+/- 25kb), separating two regions of single copy , LSC - large single copy (+/- 87kb) and SSC - small single copy (+/- 18kb) (Yang, Li et al. 2014, Zeng, Zhou et al. 2017) (Figure 3). The main cause of variation in cpDNA size is the difference in length of LSC and IR, particularly in the contraction and expansion of LSC and SSC junctions (Curci, De Paola et al. 2015).
Figure 3. Representation of cpDNA of Nicotiana tabacum (NC_001879), highlighting the regions analysed in this thesis.
The typical cpDNA of terrestrial plants is formed by about 120-133 genes, which encode about 4 to 8 rRNAs, 30 to 37 tRNAs, 85 to 88 proteins, most of which have a known function and some of unknown function (Yang, Tang et al. 2013, Zeng, Zhou et al. 2017). The primary products of chloroplast genes have a role in photosynthesis and transcription-translation. Genes used in photosynthesis tend to be more conserved than ribosomal proteins and other genes. Many chloroplast genes are functionally grouped in
polycistronic operons such as those containing the four ribosomal genes, atpI-H-F-A,
atpB-E. The order and mode of expression of the genes in these operons are very similar
to those observed in prokaryotes. The main structural difference between some chloroplastic and prokaryotic genes is the presence of introns. The cpDNA of some terrestrial plant lineages shows significant structural rearrangements, with an obvious loss of IR or whole genes. Although introns are generally conserved, most of the loss of these structures within the genes encoding was observed in specific groups or species. Comparative sequence analyses showed that the cpDNA has genes with similar sequences present in the mtDNA, but in the chloroplast the function of these genes is unknown (Palmer, Jansen et al. 1988, Xu, Liu et al. 2015, Daniell, Lin et al. 2016).
The cpDNA is haploid, with maternal inheritance, with little or no recombination, low nucleotide substitution rate and an average growth rate 4 times slower than nuDNA in plants. Variations in cpDNA provide higher resolution at the population level than nuclear markers, characteristics that make the cpDNA suitable for comparative genomic studies (Li, Yang et al. 2015, Moon, Kim et al. 2016). Mutations in cpDNA are essentially two types: point mutations (substitution of a single nucleotide pair) and rearrangements. The most frequent mutations are the point mutations and insertions/deletions (indels) in noncoding regions (Yang, Tang et al. 2013, Daniell, Lin et al. 2016). However, the rate of change of the chloroplast differs depending on its location in the genome and between genes. Typically, the rate of evolution and the nucleotide substitution rate of the LSC and SSC regions is higher than the IR. The IR and coding regions of the chloroplast genome are more conserved (low AT content high CG content) relative to the SC and non-coding regions, respectively (Zeng, Zhou et al. 2017). Direct sequencing studies reveal different levels of nucleotide substitution between chloroplast-specific genes. The rate of substitution in the cpDNA genes is on average two to three times lower than that of mitochondrial animal genes, but three to four times higher than mitochondrial plant genes. It is often the genome of choice for phylogenetic analysis in plants (Curci, De Paola et al. 2015, Li, Yang et al. 2015, Moon, Kim et al. 2016).
As the evolution of mitochondrial genome in most plants is too slow, it cannot be used to distinguish between species. Various genes and non-coding regions in the plastid genome have been put forward as alternatives (Sarwat and Yamdagni 2016). Molecular differentiation arisen in cpDNA among plant species and even individuals offer-promising tools for phylogenetic reconstruction and species identification. Recently, a few studies have discussed using complete chloroplast genomes to identify species or as organelle-scale barcodes (Yang, Tang et al. 2013, Li, Yang et al. 2015). Complete cpDNA sequencing is being used for obtaining evolutionary information that can be used
to address questions of species identification and phylogenetic analyses of plants (Yang, Li et al. 2014).
The cpDNA has conserved coding regions that can be easily aligned and used for primer design, which can be intercalated by variable introns or intergenic regions. The analyses of both these regions produce a structure capable of resolving inter and intraspecific relationships at different phylogenetic levels (Panero and Crozier 2003, Neubig, Whitten et al. 2009, Yang, Kung et al. 2015). Molecular markers in cpDNA can be used to identify commercial varieties of cultivars, determine purity and preserve production resources (Wang, Cui et al. 2015, Daniell, Lin et al. 2016).
Genomic regions for plant species identification
atpF-atpHThe atpF and atpH genes encode the ATP synthase subunit CFO I and CFO III, respectively. It is a non-coding space with high inter-specific variability due to the presence of indels (Lin, Lin et al. 2015). It was reported that, compared to other markers,
atpF-atpH was the one with the best and intra-species ratio, with sufficient
inter-specific but relatively low intra-inter-specific divergence. The adequate variation and narrow range of overlap of the atpF-atpH marker can ensure correct identification of species. It is a recommended molecular marker due to high amplification in PCR, easy alignment and sufficient divergence in sequences (Table 1) (Wang, Wu et al. 2010).
psbA-trnH
The psbA-trnH region includes the chloroplast genome space between the psbA and trnH genes. The psbA regulatory region (3'UTR) is of utmost importance in the regulation and expression of the psbA gene, which encodes the chloroplast (D1 of photosystem II) protein (Daniell, Lin et al. 2016). It is a highly variable locus, with high interspecific divergence due to the high frequency of nucleotide repeats, micro inversions and indels. The presence of a duplicate loci and a pseudogene makes psbA-trnH sequences in some species (conifers >1000bp), shorter in others (monocotyledons <300bp) and extremely short in others (bryophytes <100bp). This variation in length is considered unfavourable because it imposes difficulties in the alignments (Chen, Yao et al. 2010, Wang, Wu et al. 2010, Li, Yang et al. 2015, Tang, Yukawa et al. 2015, De Castro, Comparone et al. 2017). However, it is a widely used plastid region, because
short spaces show sufficient variation, being considered an excellent phylogenetic marker, even to resolve interspecific relationships. Long psbA-trnH regions can be difficult to recover without primers specially designed to obtain high-quality bidirectional sequences. However, the presence of highly conserved coding sequences at both ends allows the design of such oligonucleotides (Table 1) (Lahaye 2008, Kumar, Mishra et al. 2016).
trnL
The trnL intron (UAA) is a non-coding region of the chloroplast genome encoded in the large single-copy region (LSC) (Figure 3). It is part of the group I introns, which show a mosaic structure of conserved elements and common secondary structure elements, which are essential for correct splicing, and less constrained regions of variable size (Quandt and Stech 2005). The region presented low taxonomic resolution and was not variable enough to differentiate related species but can be used to identify commonly consumed plants (Bruneau, Forest et al. 2001). Its evolution in land plants is well understood and it has been often used to study relationships among genera, reconstructing phylogenies between distantly related groups or for identifying plant species. It shows an acceptable discrimination efficiency for the needs of food analysis, since it is sufficiently variable among species and conserved enough within species (Kajita, Kamiya et al. 1998, Quandt and Stech 2005, Spaniolas, Bazakos et al. 2010). The food industry and forensic science has used extensively the trnL (UAA) intron, in particular due to the small size of the P6 loop (10-143 bp), where it is difficult to obtain fragments greater than 150pb (Taberlet, Coissac et al. 2007, Thomsen and Willerslev 2015).
The trnL is not considered the most informative noncoding region of cpDNA, but a large number of nucleotide sequences are available in public databases. This abundance is due to the availability of highly conserved primers (important for PCR), from bryophytes to angiosperms. The presence of A/T >10bp stretches and the frequent presence of indels mutation makes the short P6 loop also exhibit some intraspecific variation (Quandt and Stech 2005, Taberlet, Coissac et al. 2007). The design of universal primers is viable due to highly conserved gene encoding sequences flanking interesting noncoding regions (Table 1). Hotspots rich in A/T nucleotides, with respect to the rest of the introns, have already been documented in this intron, resulting in variable length polymorphisms (Ronning, Rudi et al. 2005).
rbcL
The ribulose – 1,5 – biphosphate carboxylase/oxygenase is a cpDNA gene highly conserved, encode the big subunit of enzyme (RuBisCO) the 476 amino acids protein responsible for CO2 binding. It has a relatively slow rate of evolution, being the locus with
the slightest divergence between the plastid genes of the plants; therefore, it is not suitable at the species level because of the modest discriminatory power. The rbcL present low ability in resolving phylogenetic relationships below the family or gender levels(Taberlet, Coissac et al. 2007, Dong, Cheng et al. 2014), despite this it is one of the more characterized plastid coding regions, taking into account the number of sequences available in the databases. This sequence availability is due to its great universality, which allows the design of primers, easy amplification (despite the size), generating quality sequences and unequivocal alignments for most terrestrial plants (Table 1) (Mishra, Kumar et al. 2016, Staats, Arulandhu et al. 2016).
The rbcL alone does not fulfil the attributes for a barcode locus, although it can be useful for species identification when combined with other plastics or nuclear loci (Li, Yang et al. 2015). The Plant Working Group of Consortium for Barcode of Life (CBOL) suggested the use of approximately 650bp at the 5' end of the rbcL gene for the combination of two locus (rbcL and matK) as the nucleus barcode. Inadequate performance at species and genus levels is particularly due to the selection of a relatively conserved region in the gene; so that regions with greater variability may be present (Dong, Cheng et al. 2014).
matK
The matK plastidial gene codes for the maturase protein that is important in splicing (modification/binding) process. It is a region that is subject to different selective pressures that, when positive, help the species adapt to heat and dry climate (Daniell, Lin et al. 2016). It is a coding region that has a high rate of evolution and rapid substitution, rare occurrence of indels, adequate length and interspecific divergence (Table 1) (Mishra, Kumar et al. 2016). The matK sequences are used to study phylogenetic and evolutionary relationships at all taxonomic levels. The psbA-trnK space includes the complete matK gene and adjacent regions (Koch, Haubold et al. 2001). However, the matK barcode space used in the analyses consists of an 841bp segment at the centre of the gene and is considered to be a COI-like region used as a barcode in animals (Staats, Arulandhu et al. 2016).
This locus was proposed as a barcode for plants by Lahaye (2008), but the unavailability of universal primers for all taxa leads to a low rate of amplification by PCR and is often a limiting factor for the use of this region (Yu, Xue et al. 2011). The divergence of the matK sequences is greater than that of other coding regions, evolving about two to three times faster than rbcL, thus enhancing support at different taxonomic levels (Techen, Parveen et al. 2014, Sarwat and Yamdagni 2016). Although matK often does not show sufficient variability for discrimination at low taxonomic levels (Neubig, Whitten et al. 2009, Daniell, Lin et al. 2016), it showed highly variable sequences in the species Oryza sativa, Zea mays and Triticum aestivum (Poaceae) (Yang, Kung et al. 2015) and in Orquidaceae family species, but differentiated less than 49% of the Myristicaceae family species (Saddhe, Jamdade et al. 2017).
ITS
The Internal Transcribed Spacer (ITS) comprises the 5.8S locus and its adjacent regions ITS1 and ITS2, each with about 300bp. It is a nuclear ribosomal gene, considered to be a good phylogenetic marker, with high levels of inter and intraspecific divergence. It generally contains sufficient phylogenetic evidence for plant discrimination, even at low taxonomic levels (Table 1). Because of the discriminatory power of ITS on plastid regions, it has been proposed as a standard nuclear barcode (Chen, Yao et al. 2010).
The limitations associated with the use of this marker are the presence of putative pseudogenes leading to sequencing difficulties in many groups and paralogy. The fungal ITS sequences have a great similarity with those of plants. The primers used to amplify and sequence the two groups are similar, so that the fungal DNA can sometimes be amplified, preferably or confused, especially in plants containing fungal endophytes (Chen, Yao et al. 2010, Yao, Song et al. 2010). The available primer sets are problematic for several samples, making amplification difficult (Table 1). Despite the problems associated with its use, many studies suggest the use of ITS (Mishra, Kumar et al. 2016). The ITS2 was considered a highly informative region to discriminate among related plant species and taxonomic studies (Gao, Yao et al. 2010, Liu, Zeng et al. 2012, Saddhe, Jamdade et al. 2017). The ITS2 was used to discriminate more than 6600 medicinal plants, showing a rate of identification of 92.7% at the species level. This markers has several available sequences, is a short region (160-320bp) easy to align and can be amplified using universal primers. It has a high and well-defined interspecific divergence (barcode gap). However, it often presents unsatisfactory quality levels in
sequencing due to the existence of rich AT regions or homologous sequences (Chen, Yao et al. 2010).
Table 1. Comparative view of interest parameters used in species identification for the analysed genomic regions.
atpF-atpH psbA-trnH trnL rbcL matK ITS
Universality intermediate low high high low intermediate
Alignment intermediate low high high intermediate high
Amplification high high high high low low
Sequencing high low high high low low
Design/ availability of primers
high high high high low high
Sequences available in Gene Bank
low intermediate high high high high
Divergence/
variation high high low low intermediate high
Discriminatory power (species level)
high high interme
diate intermediate i ter ediate high
References (97) (146)
(168) (40) (56) (105) (146) (97) (162) (56) (56) (67) (92) (116) (146) (158)
(24) (40) (96) (181)
Other genomic regions
Other genomic regions have been used in different analyses and are proposed as complementary or ideal markers, depending on the objective of the study. These are less exploited regions and therefore fewer sequences are available in databases. The
rpoC2 (RNA polymerase beta-prime chain) chloroplast gene sequences were used to
differentiate species from the Poaceae family (Moon, Kim et al. 2016, Zeng, Zhou et al. 2017). The psbK-psbI is the intergenic space between the psbK and psbI genes, which encode two low molecular weight polypeptides, K and I, respectively, of the photo system II. This region showed good PCR performance and sequencing, sequence alignments were not problematic and showed moderate inter-specific diversity (Lahaye 2008).
The ycf1 (hypothetical chloroplast open reading frame 1) gene was analysed for Asteraceae species and observed a high number of SSRs (Simple Sequence Repeats) and a higher percentage of informative characters compared to the regions studied (rbcL,
matK and psbA-trnH). For phylogenetic studies or low-level taxonomic DNA barcoding,
this highly variable region was effective showing simple amplification and align due to its conserved reading structure. It is an unusual gene among plastid genes for DNA barcode or systematic molecular targets because of its length (5709 bp in Nicotiana tabacum),
few sequences available and is incomplete or absent in some taxa but not a common loss (Neubig, Whitten et al. 2009, Curci, De Paola et al. 2015, Dong, Xu et al. 2015, Xu, Liu et al. 2015).
The marker rps16-trnQ showed the best discriminatory power on the variation of length, as well as the variation of sequence. Therefore, is suggested that rps16-trnQ could serve as a better barcode in orchids at the species level (Lin, Lin et al. 2015). The
rps7-trnV segment was sequenced and genotyped among other markers for commercial
teas authentication. The region was indicated as a suitable marker to identify possible contaminants, although not yet well represented in GenBank (De Castro, Comparone et al. 2017).
The availability of a large number of sequences was one of the requirements for the choice of regions analysed in this work. Now, we address about the availability of plant nucleotide sequences.
Available DNA sequences and databases
The amount of available genomic sequences has increased dramatically due to the fast advances in high-throughput DNA sequencing technologies (Peyachoknagul, Mongkolsiriwatana et al. 2014, Zeng, Zhou et al. 2017). This wealth of genomic data arising from plant genome sequencing projects reflects the growing awareness of the importance of plants as a resource for secure food production, and in bioenergy production pharmacology and other plant biotechnology applications (Lohse, Nagel et al. 2014). However, is a challenge organize such huge amount of data in an integrated, functional, and engaging way (Lai, Berkman et al. 2012, Sakai, Lee et al. 2013, Lohse, Nagel et al. 2014).
The chloroplast genome of the tobacco (Nicotiana tabacum) was the first to be sequenced. Thereafter, more than 800 complete chloroplast genomes and a multitude of partial sequences are available from the National Center for Biotechnology Information (NCBI), obtained from a wide variety of environmental samples. It may seem a significant number, but it is still unrepresentative in view of the number of existing plants species (Apweiler, Attwood et al. 2001, Abe, Inokuchi et al. 2014, Curci, De Paola et al. 2015, Yu, Dossa et al. 2017, Zeng, Zhou et al. 2017).
The accumulation of raw data led to the construction of public genomic databases, usually from independent initiatives. The information contained in the sequences is often fragmented, with some annotations, or only for a particular group or species (Apweiler, Attwood et al. 2001, Meyer, Nagel et al. 2005, Jung, Staton et al.
2007). The genome annotation is one of the most fundamental and indispensable steps, directly affecting further experiments (Numa and Itoh 2014). A lack of annotations can seriously harm and hinder the interpretation of sequence data. Identification of uncharacterized DNA sequences depends primarily on good reference database containing accurate, reliable and trustworthy genomic sequences with well-designed interfaces that allow selection, analysis, integration of information and the correct assignment of species (Sakai, Lee et al. 2013, Zhang, Chen et al. 2013). Databases are used as anchors in genetic mapping studies of other species, linking structural analysis with the functional genome (Meyer, Nagel et al. 2005). They also serve as tools for the development of molecular markers and studies of inter and intraspecific variability (Jung, Staton et al. 2007).
Although there is an overlap between available databases, the content of the repositories differs. It is therefore advisable to search all available repositories to ensure that the analysis performed to generate the data are as persistent as possible and to take advantage of the variety of search methods. The unbalanced representation of some species may strongly affect analysis (Attwood 2002, Hebert, Cywinska et al. 2003, Yang, Tang et al. 2013). A database can integrate multiple data from different sources, facilitating analysis through search and filtering processes (Carneiro, Resende et al. 2017). A way to group and organize the data visually and intuitively through multiple sequence alignment. A large number of aligned sequences allow for an in-depth evaluation of the universality of the genomic region (Attwood 2002, Taberlet, Coissac et al. 2007). Multiple sequence alignments provide an integral view of the conservation of sequences for each target region (Figure 4). The sequence alignments define homologous characters on which phylogenetic inferences are based (Veidenberg, Medlar et al. 2016).
Figure 4. Example of a multiple sequences alignment. The green blocks represents identity, the conservation degree in that regions for all sequences present in the alignment. The black blocks are conserved regions. The amplified section of the alignment show the nucleotide bases variation in hypervariable regions (grey blocks).
Several databases are dedicated for a particular groups of species or single species. For example, a browser to display nucleotide sequence alignments, generic annotations, and single nucleotide polymorphisms (SNP) was used to comparatively analyse the rice genomes, to identifying the loss of genes from wild species to domestic, genes that may be related to the loss of recent cultivar characteristics as stress tolerance. The researchers also used plant families as preferred taxonomic rank to show how genes are conserved between plant species and how family genes evolve in each species (Sakai, Lee et al. 2013). In another example, the Oryzabase, is dedicated to rice (Oryza sativa) where anatomical and development descriptions are correlated with molecular genomic information like mutations and gene expression (Kurata and Yamazaki 2006). The AppleGFDB collects function, expression and annotated genes in the genome of apple (Malus domestica). These repositories can be used to access gene information of this important species (Zhang, Chen et al. 2013). The RadishBase, facility identification of possible genes associated with agriculturally important traits and understanding of important evolutionary process through the large-scale genome, expressed sequence tag (EST) sequences and high-density genetic maps of Raphanus
sativus (Shen, Sun et al. 2012). The WheatGenome.info provides several web-based
tools to analyze the wheat (Triticum aestivum) genome complex, allowing for genomic research that improves the production of this important cereal (Lai, Berkman et al. 2012).
Among other examples of plant sequence repositories, PoMaMo contains molecular maps of the chromosomes, putative gene functions and mutations information for analysis of potato (Solanum tuberosum), tomato (Solanum lycopersicum) and other related species of the family Solanaceae (Meyer, Nagel et al. 2005). The Genome Database for Rosaceae (GDR) combine physical, genetic and transcriptome maps, besides mutations and markers of the main species belonging to this group (Jung, Staton et al. 2007).
The Plant Microsatellite DNAs Database (PMD-Base), integrates a large number of genome microsatellites from most of the plant species grown or used as models for research and development (Yu, Dossa et al. 2017). The InterPro makes it possible to diagnose and document proteins from nucleotide sequences of unknown function (Apweiler, Attwood et al. 2001). The tRNA gene database (tRNADB-CE) which, in addition to several other genomes and sequences, provides analysis of 121 cpDNAs regarding tRNAs (Abe, Inokuchi et al. 2014). The Plant Long non-coded RNA Database (PLncDB) is an on-line repository that provides a complete genomic overview of RNAs long non-coding of Arabidopsis and can be used as a source of information for this genetic content for research in other plant species (Jin, Liu et al. 2013).
Many of these online repositories display the data in the phylogenetic level of the family because this category provides an adequate quantity of information that can be easily standardized and compared. Families with species of commercial interests are often analysed.
Laboratory procedures for DNA extraction
Variations in the growth and harvesting process, extraction and growth conditions, may also lead to failures in species identification and standardization of characterization techniques (Daniell, Lin et al. 2016, Mishra, Kumar et al. 2016). Many plant species produce secondary metabolites or bioactive substances such as alkaloids, flavonoids, tannins, cumarins, glycosides, phenylpropannes, organic acids, phenols, viscous polysaccharides, phytoalexins, terpenes and quinones which are used for plant protection and in food, pharmaceuticals, cosmetics and pesticides (Ma, Xie et al. 2010, da Cruz Cabral, Pinto et al. 2013, Barolo, Mostacero et al. 2014, Staats, Arulandhu et al. 2016). However, these same metabolic compounds are responsible for the reduce yield and in certain laboratory procedures, such as DNA extraction, amplification and cloning, among other analyses that can be done subsequently (Vassou, Kusuma et al. 2015, Kikkawa, Tsuge et al. 2016). For example, the plant Taxus wallichiana produces the