Jmuxd of F&x1 Engirwering 31 ( 1 YY7) 433-447 0 1997 Elsevier Science Limited All rights rcscrved. Printed in Great Britain PI I: SOZ60-8774(96)00069-6 0x0-x774197 9; I:.00 + ll.01) FLSEVIER
Technological Optimization of the
Cheese
Manufacture of Serra
Angela C. Macedo & F. Xavier Malcata”
Escola Superior de Biotecnologia, Universidade Cat6lica Portuguesa. Rua Dr. Antcinio Bernardino de Almeida, 4200 Porte, Portugal
(Received 23 May 1996: accepted 13 September 1996)
ABSTRACT
In order to optimize the process of cheesemaking of Serra cheese, the most famous traditional Portuguese cheese manufactured with raw ewes’ milk at farm level, several cheeses were produced according to a second-order composite jbctorial design using temperature of coagulation, amount of plant rennet added and amount of salt added to flesh cheese as the manipulated technological variables. Sensory, microbiological, physicochemical and biochemical analyses were carried out for all experimental cheeses and for two cheeses manufactured by traditional practices. The amount of salt added to fresh cheese afiected significantly the sensory, microbiological and biochemical characteristics of 60 day-old Serra cheese, whereas the amount of plant rennet added and thr coagulation temperature affected significantly only the sensory and microbiological attributes. None of the three technological parameters at the levels tested played a statistical role at the 5% significance level in the chemical composition of the cheese. It was found that 0.3 g of plant rennet added per litre of milk, a coagulation temperature of 28°C and 0.05 g of salt added per cm2 of fresh cheese sur$ace provide the best quality of cheese in terms of highest sensory scores and lowest numbers of viable enterococci and coliforms. 0 1997 Elsevier Science Limited
INTRODUCTION
Serra da Estrela cheese, often nicknamed Serra, is the most important variety of traditional cheese manufactured in Portugal in both economic and organoleptic terms. This semi-soft type of cheese is manufactured at farm level only and is “To whom correspondence should be addressed.
A. C. Macedo, l! X. Malcata
obtained by coagulation of raw ewes’ milk with a crude aqueous extract of the flowers of the thistle (Cynaru curdunculus, L.) without addition of a starter. Although recent years have witnessed extensive improvements in traditional cheese- making practices arising from increasingly strict governmental regulations and their enforcement, most Serra is still produced under poor hygiene conditions by a wide array of manufacturing practices depending on the geographical location and the cheesemaker (Macedo et al., 1993). However, even in the cases where the status of certified cheesemaker has been issued, virtually no attempts have been made towards optimization of the manufacturing process, using as quality criteria those attributes more easily perceived by the consumer (i.e. organoleptic properties) or those attributes evaluated through objective analytical techniques (i.e. microbio- logical, chemical and biochemical properties). Although Serra has the potential for widespread acceptance throughout the free European market, consistently high quality standards are a sine qua non for market success on the side of the consumer, whereas rationally optimized cheesemaking processes are a sine qua non for eco- nomic feasibility on the side of the cheesemaker.
This research has attempted to optimize several quality factors in Serra, using as technological parameters those processing variables that are more easily manipu- lated, do not require use of elaborate equipment for monitoring, and play an important role in the final cheese characteristics; preliminary screening had identi- fied three such parameters, viz. the temperature of coagulation, the amount of plant rennet added to the raw ewes’ milk, and the amount of salt added to the surface of the fresh cheese. Since those factors interact with one another and affect the final characteristics in ways that are difficult to predict in a mechanistic fashion, empirical modelling was preferred and response surface methodologies were thus employed to locate and characterize the critical points of each such manipulated variable for each quality factor (sensory assessment of rind, texture, taste and aroma; microbio- logical assessment of numbers of viable lactic acid bacteria, enterococci, coliforms, staphylococci and yeasts; chemical assessments of pH, moisture, protein, fat and salt contents; and biochemical assessments of fat acidity, water-soluble nitrogen and 12% trichloroacetic acid-soluble nitrogen).
MATERIALS AND METHODS
Cheesemaking
Cheeses were manufactured in a certified dairy farm in the Apptllation Serra Con- troll&e region (Fornos de Algodres).
Selection of the processing factors to be manipulated was achieved as the best compromise between high practical feasibility and large quantitative effect on final cheese quality. The final decision included three manufacture variables: the tem- perature of clotting (T), the amount of plant rennet (thistle flower) added to the milk (c), and the amount of salt added to the moulded fresh cheese (s). A response surface method (Box et al., 1978) was used as a basis for empirical modelling of the independent linear and non-linear effects and interaction effects of these factors (7’, c and s) on final quality parameters, and for designing an experimental layout leading to definition of optimum values for the quality factors. A set of 16 indepen- dent experiments was thus considered, as depicted in Table 1; correspondence
The munufacture qf Serra chee.ye 43s
TABLE 1
Second-order Design of Experimental Cheeses”
Corner points Axial points Cell tre
poirits T(T) 2s 31 2s 31 25 31 2s 31 2s 31 2x 28 28 28 28 28 (,(giL) 0.3 0.3 0.9 0.9 0.3 0.3 0.9 0.9 0.6 0.6 0.3 0.9 0.6 0.6 0.6 0.6 s (8) IO IO 10 10 30 30 30 30 20 20 20 20 10 30 20 20
-_ “T = clotting temperature; c = amount of plant rennet added to the milk: s = amount of salt added to the surface of the cheese.
between actual variables (as considered in Table 1) and normalized variables is available in Table 2. No blocking was necessary since all cheeses were manufactured from the same batch of milk within a few hours.
The protein/fat ratio in milk was not standardized. However, previous experience in two consecutive years had indicated that such ratio varied consistently throughout the period of lactation from c.O.96 in October up to c.l.02 in February and down to c.O.86 in May; therefore, the experiments are assumed to be representative of milk compositions typically obtained at intermediate stages of lactation, which are usually associated with the best-quality Serra cheeses.
The raw ewes’ milk (6.9% protein and 6.7% fat) was filtered through a tine. clean cloth and poured into double-walled, 40 L coagulation vats made of food-grade steel and possessing a thermostatted system of water recirculation. After the tem- peraturc of the milk had reached the desired value (2.5, 28 or 31”C), 14 g of crude kitchen salt was added per litre of milk, and the mixture was stirred until complete solubilization was reached. Plant rennet (0.3, 0.6 or 0.9 g of ground dry flowers of thistle per litre of milk) was mixed with 200 mL of tap water (which met the minimum European sanitary standards) until a brown suspension was obtained (a process that took c.5 min); this suspension was filtered through a fine, clean cloth, and the clear filtrate was added to the milk and gently stirred. The milk was then allowed to rest at the predefined coagulation temperature until complete coagula- tion had occurred (c.60 mitt, except for the experiments run at T = 25°C and
TABLE 2
Equivalence of Original and Coded Factors in the Experimental Design Employed
Original Factor Coded Original 25°C Value Coded -1 Clotting temperature 1
Amount of plant rennet 2
Salting of fresh cheese 3
28°C 31°C 0.3 siLrnilk 0.6 giL,,,w 0.9 &lLmilk 10 do.5 kg,,,,,, ct,cr\e 20 gJJ.5 kgf,cs,, c,,eew 30 gio.5 kg,rc+ checsc
436 A. C. Macedo, E X. Malcata
c = 0.3 g/L, which required cl10 min); decision that coagulation had occurred was based on empirical assessment by the cheesemaker through observation of the curd response upon a light cut with a knive. The curd was manually cut by stirring the coagulum with the bare hand, as done by most cheesemakers. Ten minutes later, the small and irregularly shaped pieces of curd were poured into a fine, wide-threaded cloth bag with an unperforated scoop, and firmly pressed for c.10 min so as to help in the expression of most whey. Drainage of whey was completed by pressing the fresh cheese while in the plastic perforated mould in a standard cheese press for c.30 min (after c.15 min the force was removed and the cheeses were turned upside down and subjected to similar pressing for another c.15 min). Each fresh cheese (c.O.5 kg in weight, c.11 cm in diameter and c.6.5 cm in height) was salted by rubbing its surface with 10, 20 or 30 g of kitchen salt. To aid identification, the cheeses were marked on the surface using a food-grade steel ring. The cheeses were ripened at a constant temperature of 9°C and a constant relative humidity of 95%, and turned upside down daily.
Sensory analyses
Sensory analyses were performed after a ripening period of 57 days; selection of this period was based on the fact that Serra cheese must mature for at least 45 days (to prevent health risks), coupled with the fact that it is usually sold between 50 and 60 days. Evaluation of cheeses was carried out by a trained five-member tasting panel (all the members of which were part of the official tasting pane1 for certifica- tion of Serra) using a five-point hedonic scale.
Microbiological analyses
Microbiological analyses were performed after 60 days of ripening. Cheese samples were analyzed at various dilution rates using the spread-plate or the pour-plate
methods as appropriate (Macedo et al., 1995). Microorganisms were grown under the following conditions: (a) lactic acid bacteria (LAB) were grown anaerobically (Gas-Pak anaerobic system BBL, Cockeysville, MD, USA) on Ml7 agar (Lab M, Bury, UK) at 30°C for 3 days, and on Rogosa agar (Oxoid, Basingstoke, UK) at 30°C for 5 days; (b) enterococci were grown on KF streptococcus agar base (Merck) supplemented with a 1% (w/v) solution of 2,3,5_triphenyltetrazolium chloride (Merck) at 37°C for 4 days; (c) coliforms were grown on violet red bile agar (Lab M) at 37°C for 1 day; (d) staphylococci were grown on Baird-Parker medium (Lab M) supplemented with egg yolk-tellurite (Lab M) at 37°C for 2 days; and (e) yeasts were grown on potato dextrose agar (Lab M) acidified with 10% (v/v) lactic acid (Merck) at 25°C for 5 days. The results were expressed as decimal logarithms of colony forming units per gram of cheese, log(cfu/g).
Chemical analyses
Chemical analyses were done on cheese samples taken after 60 days of ripening and kept frozen at -30°C in Whirl-pak vacuum packages (Cole-Parmer, Chicago, IL, USA). The pH was determined directly on the cheese sample using a MicropH 2001 (Crison, Barcelona, Spain). The total nitrogen content of cheese (TN) was deter- mined on 0.3 g samples by the micro-Kjeldahl method (Anon., 1993) using a Kjeltec
The manufacture of Serru cheese 437 system with a 2012 digester and a 1002 distilling unit (Tecator, Hoganas, Sweeden). The moisture and salt contents were determined according to the atmospheric oven method at 100°C for 24 h (EHRET, Emmendingen, Germany) and the modified Volhard method, respectively (Case et al., 1985). Total fat content in cheese was determined by the Gerber-van Gulik method (Anon., 1975a; Anon., 1975b) using a NormMilk centrifuge from International PVI (Milan, Italy). All analyses were made in duplicate.
Biochemical analyses
Biochemical analyses were done on cheese samples taken after 60 days of ripening and kept frozen at -30°C in Whirl-pak vacuum packages (Cole-Parmer). Extracts of cheese soluble in diethyl ether-soluble fat samples were obtained as follows: 10 g of a cheese sample was macerated with 10 g of anhydrous sodium sulfate (Merck) in a screw-capped bottle, and 60 mL of diethyl ether (Merck) was added. The homogenate was then stirred for 2 h and filtered through qualitative No. 1 paper (Whatman, Maidstone, UK). The precipitate was resuspended in 40 mL diethyl ether and filtered, and the filtrate was pooled with the previous filtrate. Fat acidity (FA) was measured by titration of the diethyl ether-soluble fat extract with a 0.01 M ethanolic solution of potassium hydroxide (Merck) using phenolphthalein as indica- tor (Anon., 1991b); fat acidity was expressed as mmol per 100 g of fat. All analyses were made in duplicate.
Extracts of cheese soluble in water were obtained as follows: 30 g of cheese was homogenized in 60 mL deionized water at room temperature for 5 min using a Stomacher 400 (Colworth, London, UK); the resulting slurry was then held at 40°C for 1 h in a water bath with frequent stirring. The material insoluble in water was then separated by centrifugation at 1OOOOg for 30 min at 4°C in a refrigerated centrifuge (Sorval RCSC, Wilmington, USA), and the supernatant was filtered through glass wool to remove residual suspended fat. The nitrogen content was determined by the micro-Kjeldahl method on 3 mL aliquots of the filtrate; the content of nitrogen soluble in water (WSN) was expressed per unit mass of total nitrogen, TN, and will be denoted hereafter as WSN (% in TN). All analyses were made in duplicate.
Extracts of cheese soluble in 12% (w/v) trichloroacetic acid (TCA) were obtained as follows: 5 mL of a 48% (w/v) aqueous solution of TCA (Sigma Chemical, St Louis, MO, USA) was added to 15 mL of the water-soluble nitrogen fraction; the mixture was allowed to stand for 30 min at room temperature and then filtered through Whatman No. 42 filter paper.
The nitrogen content was determined by the micro-Kjeldhal method on 4 mL aliquots of the filtrate; the content of nitrogen soluble in 12% TCA was expressed per unit mass of total nitrogen, and will be denoted hereafter as TCA-N (% in TN). All analyses were made in duplicate.
Statistical analyses
Analysis of variance for a randomized block design (Box et al., 1978) were imple- mented on the data generated by the sensory panel in order to test for statistically significant differences between cheeses and statistical similarity between panellists. Data obtained from measurements of sensory, microbiological, chemical and bio-
438 A. C. Macedo, F X. Malcata
chemical properties of cheese were tentatively fitted by least-squares to a second-degree equation (Box et al., 1978) of the form
y = @“+~lxl+~*~*+~3x3+~,*X,~2+~,3~,X3+~23X2X3+~, ,x:+a**x:+xX3X: (I) where y denotes the estimated value of the quality parameter y, the Q’S denote adjustable parameters, and xl, x2 and xj denote the normalized counterparts of variables T, c and s, respectively (the original and coded factors and values of these variables are listed in Table 2). The coordinates of local optima in terms of the processing variables were determined by differentiating eqn (1) (with only those parameters that are statistically significant) independently with respect to xl, x2 and xj, and setting the result thus obtained equal to zero, according to
(2)
a9
i-i
0
ax, x,.xz =
RESULTS AND DISCUSSION
The results of the ANOVA encompassing the organoleptic evaluation are depicted in Table 3. Inspection of this table indicates that the variability among panellists is not statistically significant at the 1% level (except in assessment of the rind, for which variability among panellists is not statistically significant at the 0.4% level); on coupling these observations with the realization that differences among cheeses were all clearly significant at the 1% level, it was decided to lump together the individual scores of the panellists and consider only their average in the linear fitting of the models to the data. Table 3 also indicates that the variability among cheeses manu- factured under distinct technological conditions is statistically Ggnificant at the 1% level, and so the general applicability of the model form set by eqn (1) was guaran- teed.
The estimates for the parameters in eqn (1) obtained from fits to the data encompassing the various quality factors (i.e. sensory assessment of rind, texture, taste and aroma; microbiological assessment of numbers of viable lactic acid bacteria, enterococci, coliforms, staphylococci and yeasts; chemical assessments of pH, moisture, protein, fat and salt contents; and biochemical assessments of fat acidity, water-soluble nitrogen and 12% trichloroacetic acid-soluble nitrogen) are presented in Table 4.
The manufacture qf Serra cheese
TABLE 3
439
Analysis of Variance for the Organoleptic Evaluation En tin/ waluaied Kind Texture Taste Aroma
Source of Sum of Degrees qf Mean sum of
ljariance squares freedom .squaws
average 437.113 1 taster 4.075 4 1.019 cheese IS.888 15 I .059 residuals 13.925 60 0.232 avcragc 535.6 I3 1 taster 3.200 4 0.800 cheese 16.988 15 1.133 residuals 13.200 60 0.220 average 245.000 1 taster 2.375 4 0.594 cheese IO.200 15 0.680 residuals 12.425 60 0.207 average 44 I NO I taster 3.200 4 0.800 cheese 16.200 IS 1.080 residuals 12.800 60 0.213 F-ratio f-value 4.390 4.564 3.636 5.148 2.867 3.284 3.750 5.063 0.0035 < 0.000 I 0.0102 < 0.000 1 0.0306 0.0O05 0.0087 < I).000 I
The dominant microflora (as assessed by the x,, parameter) is accounted f’or by lactic acid bacteria enumerated on Ml7 and RA. Macedo et al. (1995) reported that the major lactic acid bacteria identified in 35 day-old Serra cheese were Leuconostoc 1acti.y (on both Ml7 and RA agars), Lactococcus lactis ssp. lactis (on M17), and Lactohacillus paracasei ssp. paracasei (on RA). The bacteria Leuconostoc mesenter- oides ssp. mesenteroidesldextranicum (on both Ml7 and RA), Enterococcus faecium
(on M17), and Lactobaciflus plantarum (on RA) were also found but in lower numbers. In view of eqn (I) and the parameter estimates depicted in Table 4, one can statistically model (at the 5% level of significance) the decimal logarithms of viable numbers of LAB in 60 day-old Serra cheese grown on Ml7 (mainly Leuconos- tocspp. andLactococcusspp.)asE = 8.61+0.06x, -0.21x3 -0.34x,x3 -0.12xZx,-0.29~: +0.09x: -0.31x& of LAB grown on RA (mainly Leuconostoc spp. and Lactobacillus spp. ) as y = 8.04 -0.33x,+0.30x<, and of enterococci grown on KF agar as 9 = 6.49-0.11 x~-O.14x,+O.O9x,x~-O.26x,x.~-O.12x~x,+O.5Ox:+O.43x:-O.S5x:.
Coliforms were present in Serra cheese by 60 days of ripening at average values above 10” cfu/g; in similar cheeses ripened for 35 days, coliforms identified included mainly Hafnia alvei, and, at lower numbers, Escherichia coli and Citrobacter freundii, whereas the predominant staphylococci were Staphylococcus xylosus and, at much lower numbers, Staph. simulans and Staph. aureus (Macedo et al., 1995). In view of eqn (1) and the parameter estimates depicted in Table 4, one can statistically model (at the 5% level of significance) the decimal logarithms of viable numbers of coliforms in 60 day-old Serra cheese as E = 6.79+0.38x, - 1.36x1+0.36x:-0.73x;
-055x<. None of the manufacturing variables studied had a statistical effect at the 5% significance level upon the numbers of staphylococci; therefore the best-fit equation reduces to f = 4.43. In view of eqn (1) and the parameter estimates depicted in Table 4, one can statistically model (at the 5% level of significance) the decimal logarithms of viable numbers of yeasts in 60 day-old Serra cheese as 3 = 4.8 1 - 0.73x:+o.8ox~; the yeast microflora was characterized elsewhere by
440 A. C. Macedo, E X. Malcata
Macedo et al. (1995), who concluded that is is mainly composed of Sporobofomyces roseus, Leucosporidium scottiilDebatyomyces hansenii, K!uyveromyces marxianus, and Rhodotonda auruntiaca. Of the manufacturing variables studied with respect to their
TABLE 4
Values of Grand Average, Linear Effects, Second-order Interactions, and Quadratic Effects Considered in eqn (1) after Linear Regression Fitting to the Experimental Data, and Associ-
ated 95% Confidence Intervals
Attribute Effects and Interactions
Sensory Rind Texture Taste Aroma Microbiology LAB on Ml7 (log cfu/g) LAB on RA (log cfu/g) Enterococci (log cfu/g) I Coliforms (log cfuig) Staphylococci Eis;r&) (log cfuig) Chemistry PH Moisture (wt%) Protein (wt%) Fat (wt%) Salt (wt%) Biochemistry 2.297 0.180 - 0.240 - 0.360 0.025 -0.075 0.075 -0.245 0.255 0.055 +0.150&-0.199+0.199_tO.199 kO.231 kO.231 f0.231~0.199~0.199 kO.199 2.538 0.040-0.180-0.440 0.000 -0.050 0.100 0.193 0.293 - 0.407 +0.150+0.199~0.199+0.199 kO.231 kO.231 +0.231+0.199$0.199 $0.199
1.828 -0.080-0.020-0.140 -0.025 0.225 - 0.025 -0.241 0.259 -0.341 +0.150t_0.199+0.199~0.199 kO.231 kO.231 kO.231 f0.199+0.199 kO.199
2.255 0.140-0.120-0.140 -0.100 -0.100 -0.150 0.417-0.083 - 0.283 +0.150+0.199_+0.199+0.199 +0.231 kO.231 kO.231 f0.199+0.199 +0.199
8.608 0.057-0.023-0.209 0.010 -0.335 -0.116-0.294 0.085 & 0.024 + 0.032 + 0.032 + 0.032 2 0.038 kO.038 kO.038 k 0.032 + 0.032
8.035-0.165 0.032-0.331 0.009 -0.151 -0.014-0.049-0.150 _t0.190f0.252_t0.252+0.252 f0.292 kO.292 +0.292&0.252$0.252 6.493 0.010-0.106-0.139 0.085 -0.260 -0.122 0.499 0.428 _t 0.037 f 0.049 + 0.049 k 0.049 k 0.056 f. 0.056 + 0.056 + 0.049 & 0.049 6.789 -0.040 0.377 - 1.355 -0.015 0.087 -0.080 0.359 - 0.727 f 0.243 4 0.323 f 0.323 ? 0.323 kO.374 + 0.374 + 0.374 t_ 0.323 f 0.323 4.433-0.174 0.058-0.180 0.004 -0.200 -0.074-0.090-0.075 +0.168+0.223+0.223_tO.223 kO.258 kO.258 f0.258f0.223+0.223
4.814 0.082-0.208-0.012 0.148 0.122 0.043-0.731-0.181 +0.430-&0.572+0.572*0.572 kO.662 k-o.662 +0.662_tO.572+0.572
-0.313 + 0.032 0.304 _t 0.252 - 0.546 * 0.049 - 0.553 _t 0.323 0.024 k 0.223 0.804 + 0.572 5.659-0.022 0.092-0.034 -0.013 0.028 0.080 0.129-0.061
fO.101~0.135f0.135~0.135 kO.156 kO.156 +0.156+0.135_tO.135 49.786 - 1.938 -0.373 -3.064 - I .424 - 2.930 0.253 0.228 - I .601 f 3.411+ 4.534 k4.534 f 4.534 + 5.246 4 5,246 k 5.246 f 4.534 k4.534 19.773 0.513 0.203 1.246 0.634 0.923 0.088 0.712 0.278 ~1.166~1.550*1.550~1.550 f1.794 k1.794 f1.794&1.550+1.550 25.034 1.580 0.610 1.260 0.825 1.650 -0.650-1.052 2.198 + 1.723 f 2.290 f 2.290 k2.290 * 2.650 _+ 2.650 + 2.650 f 2.290 + 2.290 4.413 0.105-0.077 0.505 0.074 0.086 -0.177-0.022-0.139 & 0.412 + 0.548 f 0.548 f 0.548 * 0.634 _t 0.634 _t 0.634 f 0.548 f0.548 8.631-0.143-0.206-1.256 -0.024 -0.795 0.158 0.787-0.159 - 0.09 1 kO.135 - 2.872 f 4.534 -0.812 & 1.550 3.248 k 3.290 - 0.267 * 0.548 Fat acidity
(mm011100 g fat) kO.637 + 0.847 kO.847 f 0.847 kO.980 + 0.980 f 0.980 kO.847 + 0.847
- 0.468 + 0.847 Water- soluble 52.867-1.172 1.785-5.902 -5,847 -3.155 -1.223 1.771-7.413-11.630 (% in TN) ~6.556_t8.715~8.715+8.715~10.085+10.085+10.085+8.715+8.715 k8.715 12% TCA-N soluble 3.925-0.111 0.255-0.643 -0.170 -0.215 -0.090-0.190-0.219 -0.064 (% in TN) f0.210*0.279_+0.279&0.279 kO.323 kO.323 +0.323*0.279+0.279 kO.279
The manufacture of Serru cheese 441 effect upon microbial growth, the most important in magnitude was the amount of salt added to the fresh cheese (s, or x3) in both line;lr and quadratic form. This is expected because one of the major roles of salting is precisely to control microbial growth through reduction of the water activity in cheese. Furthermore, the tempera- ture of coagulation (T, or x,) affects microbial growth, especially in its quadratic form, either positively (enterococci and coliforms) or negatively (LAB grown on Ml7 or yeasts). Enterococci and coliforms were also the only families of micro- organisms affected by the amount of plant rennet utilized (x& in both its linear and quadratic effects. However, lactic acid bacteria and yeasts are more prone to exhibit proteolytic activity towards hydrolysis of caseins and larger peptides than are coli- forms.
The chemical composition of 60 day-old Serra cheese was not affected signifi- cantly by the manufacturing variables studied, within the experimental range chosen, although it was expected that high clotting temperature coupled with high level of addition of plant rennet would have given rise to a coarser and firmer gel at cutting: such gel would thus retain more water and fat at cutting. These results can probably be explained by realization that (1) gel strength and set-to-cut time technological parameters (which eventually control cheese composition) were not deliberately fixed in the experimental cheeses, (2) all cheeses were manufactured from the same batch of milk (i.e. with given contents of protein and fat), and (3) coagulation of milk was exclusively brought about by enzymatic action of the plant rennet rather than via acid production (since no starter was used), and acid is known to largely determine the chemical composition of the curd (Lawrence et al., 1984).
The extent of lipolysis, measured as fat acidity, can be related in statistical terms, significant at the 5% level, only to the amount of salt added to the milk, viz. jl = 8.63 - 1.26x,. The main sources of lipases in cheese are milk itself and the indigenous microflora (Albrecht & Jaynes, 1953, such as Lactococcus spp. (Kamaly ct al., 1988), psychrotrophic bacteria (Juven et al., 1981) and yeasts (Stead, 1986). As discussed above, increasing the salt content in cheese contributes to a reduction of the numbers of microorganisms (which encompass such lipolytic bacteria as LAB grown on M17, coliforms and yeasts); additionally, the ionic strength in cheese (which in turn depends directly on salt content) controls the activity of enzymes by constraining their conformation and hence their catalytic efficiency. In both cases, increasing the salt content will reduce the numbers of viable lipolytic microorgan- isms and reduce the activity of lipases, so the negative sign of the coefficient of x3 in the aforementioned equation is justified.
Primary proteolysis in cheese (i.e. hydrolysis of caseins to large peptides and medium peptides) is usually brought about by rennet (Visser & Slangan, 1977), whereas secondary proteolysis (i.e. hydrolysis of medium peptides to small peptides) is usually brought about by starter bacteria (O’Keefe et al., 1976). A larger amount of plant rennet added to milk (and consequently a larger amount of residual plant rennet contained in the cheese curd) will thus imply primary proteolysis to a higher extent, and so higher concentrations of medium peptides are expected in cheese in the early stages of ripening; these peptides are thereafter broken down into smaller peptides (and eventually amino acids) especially by lactic acid bacteria, which are nitrogenous fastidious microorganisms. The extent of proteolysis is often measured as the nitrogen content soluble in water or in 12% TCA; the water-soluble fraction contains high- and medium-molecular-weight peptides, whereas the 12% TCA-
442 A. C. Macedo, F: X. Malcata
soluble fraction contains low-molecular-weight peptides and amino acids (Yvon et al., 1989; Anon., 1991a). Therefore, the negative effect of the amount of salt added to fresh cheese upon the nitrogen content either soluble in water (i.e. y = 52.87- 11.63~5) or soluble in 12% TCA (i.e. y = 3.93 -0.64~~) can be explained by the fact that salt affects negatively, and in a direct manner, the proteolytic activity of the plant rennet and of the microbial peptidases, whereas it affects negatively, but in an indirect manner, the numbers of those bacteria (as discussed previously). Considering that thistle flowers display their maximum proteolytic activity at 50°C (Faro, 1991) and that this plant rennet exhibits a strong proteolytic behaviour during early stages of ripening, increases in the coagulation temperature and amount of rennet added to milk will probably increase the extent of hydrolysis of caseins and thus the concentration of peptides.
In general, Serra cheese has a buttery and runny texture, which leads to spontane- ous and rapid deformation upon slicing, and possesses a strong aroma, and a clean, smooth, slightly acid flavour; the rind is uniform, smooth, well formed, with a straw- yellow color. Estimation of sensory characteristics of 60 day-old cheese as a function
the
;‘= 2.30 - 0.24~2 - 0.36~~ -0.25x:+0.26x2
technological parameters considered can be achieved using 2 for the rind, y = 2.54-0.44x,+0.29x, -4.41~: for the texture, y = 1.83 -0.24.x:+0.26x;-0.34x: for the taste, and y = 2.26+0.42~-0.28x; for the aroma. It has been known for a long time that salt added to fresh cheese correlates well with most sensory characteristics of cheese, especially taste and firmness (Guinee & Fox, 1993). Furthermore, flavour com- pounds in cheese originate from chemical precursors derived from hydrolysis of the lactose, lipids and proteins of the cheese curd matrix (Fox et al., 1995) brought about by indigenous or deliberately added enzymes as such, or by enzymes produced in situ by adventitious or deliberately added microflora (via secretion or lysis). Therefore, sodium chloride influences the flavour of cheese directly due to its typical salty taste, indirectly by affecting the intrinsic catalytic activity of cell-free enzymes, and also indirectly by constraining the numbers of viable microorganisms and thus the overall throughput rates of their biochemical pathways. The observed positive effect of the amount of plant rennet upon texture and flavour of Serra cheese can be explained by the fact that the crude enzyme preparation, in addition to bringing about coagulation of milk, plays an important role in proteolyis of cheese (Macedo & Malcata, 1996); flavour and texture characteristics of virtually all ripened cheese varieties result from degradation of cheese proteins to peptides and ultimately to amino acids (Lawrence et al., 1983). The effect of coagulation tempera- ture on taste and aroma characteristics of cheese can be explained by the fact (already discussed) that the numbers of lactic acid bacteria (Lactococcus spp., Lacto- bacillus spp., Leuconostoc spp. and Enterococcus spp.) and coliforms are affected by this variable and might be responsible for formation of involatile and/or volatile compounds which contribute to the taste and aroma.
Local (or global) optima for each quality factor studied could have been obtained from application of eqn (2) to each such factor with the corresponding statistically significant parameters listed in Table 4; however, 18 different optima would have been obtained which, as happens with most optimization procedures, would be considerably different from one another (e.g. Nabais & Malcata, 1995). In this way, no clear and useful definition of which technological direction to take for improve- ment of Serra cheese would be obtained. Since most queries raised by the consumer are based on organoleptic characteristics, and since most queries raised by public
The manufacture
of
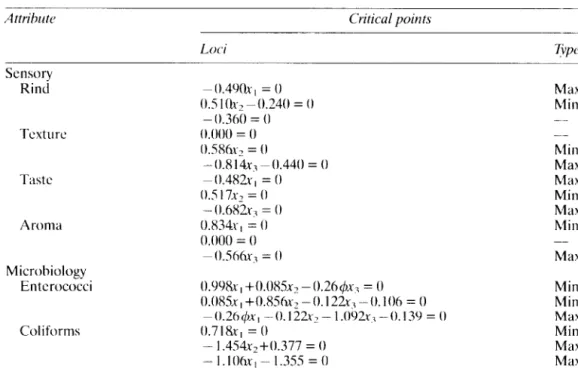
Serra cheese 443 health institutions are based on microbiological safety, only six quality factors were considered for optimization, viz. all sensory attributes (aiming at maxima) and the counts of viable enterococci and coliforms (aiming at minima). (It should be noted here that minimization of the numbers of viable staphylococci could not be con- sidered, because their numbers were not statistically affected by any of the technological parameters studied.) The sets of algebraic equations which, upon solution, yield the necessary conditions for local optima (and the nature of such optima determined from inspection of the sign of the corresponding second deriva- tive) for the aforementioned six quality factors as obtained from application of eqn (2) including only the parameters depicted in Table 4 that are statistically significant at the 5% level are given in Table 5. Inspection of this table indicates that no single point provides a true maximum for any of the sensory or microbiological attributes (in mathematical jargon, the loci depicted in Table 5 are all saddle points). There- fore, the global optima sought will (in practice) lie on constraints. For each quality factor, only the set of algebraic equations listed in Table 5 that yield maxima with respect to the technological parameter in question was considered, and the resulting (indeterminate) set of one or two algebraic equations in variables x1, x2 and x3 (with two or one degrees of freedom, respectively) was combined with the contraint(s) on the remaining parameter(s).TABLE5
Ncccssary Conditions for Local Optima (and Indication of Type of Critical Point in Ques- tion) Obtained from Application of eqn (2) with Only the Significant Factors Depicted in
Table 4 Attribute Loci Critical points -- TGpC Sensory Rind Tcxturc Taste Aroma Microbiology Entcrococci Coliforms -0.49ox, = 0 0.5 1 Ox2 - 0.240 = 0 - 0.360 = 0 0.000 = 0 o.sx6Xu-2 = 0 - 0.814X3 ~ 0.440 = 0 -0.482u, = 0 0.5 17x2 = 0 -0.682~~ = 0 0.834X, = 0 0.000 = 0 -0.56(W7 = 0 0.098x-, +0.085X, - 0.2f$Xx1 = 0 O.O8SX, +O.Mhw, - 0.122X3 - 0.106 = 0 -0.26$X, -0.122X- l.O%k-0.13’) = 0 0.718X, = 0 - 1.454x,+0.377 = 0 - I.lOhr, - 1.355 = 0 Max hlin Min Max Max Min Max hlin Max Min Min Max Min Max Max
444 A. C. Macedo, l? X. Malcata
Careful inspection of Tables 3 and 4 indicates that: (1) the global maximum for assessment of the rind occurs at the local maximum xl = 0.00 and at the restrictions x2 = - 1.00 and x3 = - 1.00; (2) the global maximum for assessment of the texture
occurs at any value for X, in the interval [ - l,+l], at the restriction x2 = - 1.00 or x2 = +l.OO, and at the local maximum x3 = -0.54; (3) the global maximum for assessment of the taste occurs at the local maximum xl = 0.00, at the restriction x2 = -1.00 or x2 = +l.OO, and at the local maximum x1 = 0.00; (4) the global maxi-
mum for assessment of the aroma occurs at the restriction xl = - 1.00 or xl = +l.OO, at any value for x2 in the interval [ - l,+l], and at the local maximum x3 = 0.00; (5) the global minimum for assessment of the viable numbers of enterococci occurs at the local minima x, = -0.26 and x2 = 0.01 coupled with the restriction at xj = - 1.00, or at the local minima xl = 0.24 and x2 = 0.24 coupled with the restric-
tion at x3 = 1.00; and (6) the global minimum for assessment of the viable numbers of coliforms occurs at the local minimum xl = 0.00, and at the local restrictions x2 = - 1.00 and xcj = 1.00. These loci of the actual, global maxima for the sensory
quality factors (i.e. sensory assessment of rind, texture, taste and aroma) and of the actual, global minima for the selected microbiological quality factors (i.e. microbio- logical assessments of enterococci and coliforms) are depicted in Table 6 in terms of the processing parameters T, c and S.
Inspection of Table 6 indicates that there is not a single optimum for all quality factors considered simultaneously. However, maximization of taste and minimization of coliforms are probably the most important factors due to legal hygiene standards imposed by the EU on the one hand, and due to the need of a competitive advantage, in organoleptic terms, in a cheese market populated by a wide array of cheese types with established tastes. Applying this rationale to Table 6, it is con- cluded that cheesemaking should encompass 28°C as coagulation temperature, 0.3 g/L as the amount of plant rennet added to the milk, and 20 g as the amount of salt added to the 0.5 kg cheese (or, equivalently, 0.05 g of salt per cm2 of fresh cheese surface). Recalling eqn (1) coupled with the statistically significant param- eters in Table 4, it is concluded that if xl = 0 (i.e. if T = 28’79, x2 = - 1 (i.e. if c = 0.3 g/L), and x3 = 0 (i.e. if s = 20 g), then in the five-point hedonic scale
TABLE 6
Global Optima in Terms of Temperature of Coagulation (T), Amount of Plant Rennet Added to the Milk (c), and Amount of Salt added to the Fresh Cheese (s)
Attribute T (“C) Sensory (maxima) Rind Texture Taste Aroma Microbiology (minima) Enterococci Coliforms 28.0 0.3 10.0 25.0 to 31.0 0.3 or 0.9 25.4 28.0 0.3 or 0.9 20.0 25.0 or 31 .O 0.3 to 0.9 20.0 27.2 or 28.7 0.6 or 0.7 10.0 or 30.0 28.0 0.3 30.0
The munufacture of Serra clreese 44.5 utilized: (1) the rind characteristics will be decreased by 0.36 units; (2) the texture and taste characteristics will not be affected at all; (3) the aroma characteristics will be decreased by 0.42 units; (4) the logarithm of the numbers of viable enterococci will be increased by 1.26, or equivalently the numbers of viable enterococci will be increased c.l8-fold; and (5) the logarithm of the numbers of coliforms will be increased by 1.91, or equivalently the numbers of viable coliforms will be increased c.81-fold.
The average and standard errors for the estimated microbiological attributes (i.e. numbers of viable lactic acid bacteria enumerated on Ml7 and RA, enterococci, coliforms, staphylococci and yeasts), estimated chemical attributes (i.e. pH, mois- ture, protein, fat and salt contents), and estimated biochemical attributes (i.e. fat acidity, water-soluble nitrogen and 12% trichloroacetic acid-soluble nitrogen) of Serra cheese manufactured at the optimal conditions [as set in Table 6 and obtained from application of eqn (1) with the statistically significant parameters in Table 4 to each such quality attribute] are listed in Table 7; in this table the average values for the same attributes obtained for two Serra cheeses manufactured according to traditional practices on the same farm and from the same batch of milk are also included. It is realized that the recommended values for the coagulation tempera- ture and the amount of plant rennet added to milk are close to those employed in traditional cheesemaking; on the other hand, the recommended amount of salt to be added to cheese is higher than that traditionally added. In either case, the values calculated for the microbiological, chemical and biochemical characteristics of opti-
TABLE 7
Estimated Values (and Associated Standard Errors) Encompassing the Microbiological, Chemical and Biochemical Characteristics of 60 Day-old Serra Cheese Manufactured at the Optimal Technological Conditions (i.e. T = 28°C c = 0.3 g/L, s = 0.05 g/cm’) and Following Traditional Practices (i.e. T = 28”C, c = 0.4 g/L, s = 0.04 g,kmz) as Obtained from Use of
cqn (2) Attribute Optimal Microbiology LAB on M 17 (cfuig) LAB on RA (cfuig) Enterococci (cfuig) Coliforms (cfuig) Staphylococci (cfuig) Yeasts (cfuig) Chemistry PH (4.06f0.32) x IO” (1.19k0.69) x IO” (1.36f0.96) x 10” (1.18fl.26)~ 10” (2.92+ 1.52) x IO’ (0.98 t_ 1.07) x IO’ Moisture content Protein content Fat content Salt content 5.66*0.1’) 49.79 f 6.44 19.77+2.20 25.03 k 3.25 4.4 1 + 0.78 Biochemistry
Fat acidity (mmol/lOO g fat) Water-soluble nitrogen (% TN) 12% TCA-soluble nitrogen (% TN) 8.63 f 1.20 52.87 f 12.37 3.93 _t 0.40 Traditional (2.82 k 0.57) x I Ox (2.67kO.79) x IO’ (1.13kO.18) x IO” (7.64 f 6.84) x 10” (3.4x+ 1.64) x IO1 (1.9752.41) x 105 5.55+0.13 45.41 rf: I .55 22.10+0.39 2s. 15 + 2.33 3.05 * 0. IS 11.55-t 1.91 34.97 * 1.70 4.03 f 0.25
446 A. C. Macedo, l? X. Malcata
mal cheeses are of the order of magnitude of the values measured for the microbiological, chemical and biochemical characteristics of traditional cheeses, which to some extent validates the present optimization procedure.
Finally it can be stated that although actual cheesemaking practices are good, there is some room for technological improvement, especially in the levels of salt added to the fresh cheese. Most problems concerning production of uniform and high-quality Serra cheese arise probably from poor quality of the cheesemaking milk and of its handling conditions (because variations on the cheesemaking process were virtually immaterial as regards the numbers of viable staphylococci, the numbers of which were essentially determined by the initial contamination of the milk), which may result in initially poor chemical composition or microbiological quality (param- eters that were not deliberately varied in the present analysis). Future research on improvement of Serra cheese should thus focus on standardization of the milk composition (in terms of fat, protein and calcium contents) on the one hand, and improvement of hygiene in handling milk from the milking location to the cheese- making location (including use of refrigerated networks for storage of milk) on the other, which, due to microbiological competition for nutrients and concomitant ecological survival, may be promoted by addition of a starter to the raw milk.
CONCLUSIONS
Although optimization of Serra cheese manufacture should in principle result from a compromise between several objective functions encompassing sensory, microbio- logical, chemical and biochemical characteristics, objective functions directly related to safety of the product (i.e. reduction of such undesirable bacteria as enterococci and coliforms) and to sensory characteristics (taste and, to a lesser extent, rind, texture and aroma) permit determination of a more consistent set of optimal tech- nological conditions which, in addition, are particularly useful in terms of the market queries raised on this cheese. The optimal set of technological conditions (which correspond to partial optima combined with manufacture constraints) are 28°C for the clotting temperature, 0.3 g/L for the amount of plant rennet added to the milk, and 0.05 g/cm’ for the amount of salt added to the fresh cheese.
ACKNOWLEDGEMENTS
The authors are grateful to the members of the technical board of ANCOSE (the National Portuguese Breeders Association of Serra da Estrela Sheep) for their cooperation encompassing the local manufacture and transport of cheeses. Financial support for A. C. Macedo was provided by a Ph.D. fellowship (PRAXIS XXI/BD/ 3157/94). Financial support for the research work was partly obtained via project grants ‘MAQUETTE: Improvement of traditional cheeses and their technology’ (AI, Portugal) and ‘Design and production of an enzymatic and microbial mixture to improve the safety and quality of ewes’ cheese’ (Spain, France, Italy and Portugal) and to obtain a novel functional food as a response to European demand for new products low in cholesterol and enriched in protein’ (AAIR, EU).
The manufacture qf Serru cheese 447
REFERENCES
Albrecht, T. W. & Jaynes, H. 0. (1055). Milk lipases. J. Dair?, Sci., 38, 137-144.
Anon. (197%). Fromages. Di‘termination de la teneur en matikre grasse. Butyromtttre pour la mdthode van Gulik. Norme lnternationale IS0 3432. Nederlands Normalisatie-Instituut, Delft
Anon. (197%). Fromages. Dktermination dc la teneur cn mat&c grassc. Normc Inter- nationale IS0 3433. Nederlands Normalisatie-Instituut. Dclft.
Anon. (I YY la). Chemical methods for evaluating protcolysis in cheese maturation. F/L/lDF
Bull., 261, 4-3 I.
Anon. (lY9lb). Basic principles of the methods used for free fatty acid determination. Dctcrmination of free fatty acids in milk and milk products. FZLIIDF Buff., 265, 8-18.
Anon. (1993). Milk. Determination of nitrogen content. IDF standard 20B.
Box, G. E. P.. Hunter, W. G. & Hunter, J. S. (1978). Statistics ,for Experimenters - An
Introduction to Design, Data Anulysis, and Model Building. Wiley, New York, pp. 5 10-39 (‘ase, R. A.. Bradley, R. L. & Williams, R. R. (1985). Chemical and physical methods. In
Standard Methods for the Examination of Duir)! Products, ed. G. H. Richardson. American Public Health Association, Washington, DC, pp 327-Y4.
Faro, C. C. (199 I). Purific$o e caracteriza@o fisico-quimica da protease de Cynaru carduncu- hrs L. Ph.D. thesis, Universidade de Coimbra, Coimbra, Portugal.
Fox. P. F., Singh, T. K. & MacSwceney, P. L. H. (1995). Biogenesis of flavour compounds in cheese. In Chemistry qf Structure-Function Relutionships in Cheese. cd. E. L. Malin & M. H. Tunick. Plenum Press, London, pp. SY-Y8.
Guinee. T. P. & Fox, P. F. (1993). Salt in cheese: physical, chemical and biological aspects. In Cheese: Chemistry, Ph_vsics und Microhiologv, cd. P. F. Fox. Chapman & Hall. London. pp. 2S7-29Y.
Juven. B. J., Gordin, S., Rosenthal, I. & Laufer. A. (1981). Changes in refrigerated milk caused by Enterobacteriaccae. J. Dairy Sci., 64. 17X 1- 1784.
Kamaly, K. M., El-Soda, M. & Marth, E. H. (1988). Esterolytic activity of Streptococcus Iacti.\.
Streptococcus cremoris and their mutants. Milch~is.senscllyf, 43, 346-35 I.
Lawrence. R. C.. Gilles, J. & Creamer, L. K. (1983). The relationship between cheese texture and flavour. N. Z. J. Daiv Sci. Technol., 18, 17S- IYO.
Lawrence, R. C., Heap, H. A. & Gilles, J. (1984). A controlled approach to cheese tech- nology. J. Duity Sci., 67, l632- 1645.
Maccdo. A., Malcata, F. X. & Oliveira, J. C. (lYY3). The technology, chemistry, and micro- biology of Serra cheese: a review. J. Dairy Sci., 76, 172% 1739.
Macedo, A. C., Malcata, F. X. & Hogg, T. A. (1995). Microbiological profile in Scrra ewes’ cheese during ripening. J. Appl. Bucteriol., 79, 1 -I I.
Macedo, A. C. & Malcata, F. X. (1997). Hydrolysis of xs- and /I-caseins during ripening of Serra cheese. Food Chem., 58. 43-48.
Nabais, R. M. & Malcata, F. X. (1995). Optimizing a lactic fermentation of sliced carrots. J.
Food Process. Preserv., 19, 427-449.
O’Keefe, R. B., Fox, P. F. & Daly, C. (1976). Contribution of rennet and starter proteases to proteolysis in Cheddar cheese. J. Da@ Res., 43. Y7-107.
Stead, D. (1986). Microbial lipases: their characteristics. role in food spoilage and industrial uses. J. Da&v Res., 53, 481 -SOS.
Visser. S. & Slangan, K. J. (1977). On the specificity of chymosin (rennin) in its actions on bovine p-casein. Neth. Milk Daity J., 31, 16-30.
Yvon, M., Chabanet, C. & Wissier, J. P. (1989). Solubility of peptides in trichloroacetic acid