DOI: 10.7127/rbai.v8n200222
Protocolo 222/14 – 12/09/2013 Aprovado em 10/03/2014
SOIL SOLUTION DISTRIBUTION UNDER SUBSURFACE DRIP
FERTIGATION DETERMINED USING TDR TECHNIQUE 1
Douglas Roberto Bizari2, Katarina Lira Grecco3, Paula Lamas de Oliveira³, Daniela Cristina Marcondes Querido³, Claudinei Fonseca Souza4
ABSTRACT
The use of drip irrigation in agriculture is gaining more efficiency in the management of water and nutrients. The expansion of subsurface drip irrigation in the cultivation of sugarcane is demanding more information in this area of knowledge, for example, the behavior of ions in the wet bulb. Thus, the goal of this work is to evaluate the soil solution distribution using the TDR technique (Time Domain Reflectometry) in subsurface fertigation. The experiment was carried out in the greenhouse of the Department of Natural Resources and Environmental Protection - CCA/UFSCar. We used two PVC containers (500 L) filled with sandy soil, and, in each of them, one dripper installed at depth of 0.30 m. In the container we installed a mesh (6 x 6) of 36 TDR probes, spaced by 0.10 m, the layers being arranged at the following depths from the base of the container: 0.05; 0.15; 0.25; 0.35; 0.45 and 0.55, for automatic monitoring of electrical conductivity in order to determine the evolution and soil solution distribution along time. The treatments were based on flow rate (1.0 and 1.6 L h-1), applying each time 1.0 L of solution of potassium nitrate (KNO3) for a total of 10 applications at the end of each test. The results observed in the two treatments was a gradual distribution of soil solution with higher concentration of the solution near the dripper and also a greater tendency for horizontal displacement of the wetting front, with the solution over 0.30 m from dripper position.
Keywords: electrical conductivity, fertigation, potassium nitrate.
DISTRIBUIÇÃO DA SOLUÇÃO NO SOLO FERTIRRIGADO POR GOTEJAMENTO SUBSUPERFICIAL UTILIZANDO A TÉCNICA DA TDR
RESUMO
A agricultura com o uso da irrigação localizada vem ganhando mais eficiência no manejo da água e nutrientes. Com o aumento da utilização do gotejamento subsuperficial na cultura da cana-de-açúcar, a demanda de informações nessa área do conhecimento torna-se cada vez
1 Research funded by FAPESP;
2 Postdoctoral Fellow - FAPESP, CCA/UFSCar, Araras - SP, CEP 13600-970 Araras - SP. Fone (19) 3543-2616;
3 Agricultural Engineering, Scientific Initiation Scholarship – FAPESP, CNPq; CCA/UFSCar 4 Prof. Ph.D., DRNPA/CCA/UFSCar, Araras - SP
maior. Desta forma, o objetivo do presente trabalho é avaliar a distribuição da solução no solo por meio da técnica da TDR (Reflectometria no Domínio do Tempo) na fertirrigação subsuperficial. O experimento foi conduzido na casa de vegetação do Departamento de Recursos Naturais e Proteção Ambiental do CCA/UFSCar. Para alcançar esse objetivo, foram utilizados dois recipientes de PVC (500 L) preenchidos com solo arenoso, sendo em cada um deles, instalado um gotejador na profundidade de 0,30 m. No mesmo recipiente, foi instalado uma malha de 36 sondas para o monitoramento automático da condutividade elétrica para a determinação da evolução do bulbo molhado e distribuição da solução do solo, conjuntamente, em função do tempo. Os tratamentos foram baseados na vazão (1,0 e 1,6 L h-1), aplicando-se a cada hora 1,0 L de solução de nitrato de potássio (KNO3), totalizando 10 aplicações no final de cada ensaio. Pelos resultados obtidos observou-se, nos dois tratamentos, uma distribuição gradativa da solução no solo, sendo verificada uma maior concentração da solução próxima ao gotejador e, também uma maior tendência de deslocamento horizontal da frente de umedecimento, com a solução encontrada a mais de 0,30 m em relação à posição do gotejador.
Palavras-chave: condutividade elétrica, fertirrigação, nitrato de potássio.
INTRODUCTION
This irrigation method can be classified according to the installation position of the drip line in: surface irrigation system when the emitters are located at the soil surface and subsurface irrigation, when allocated under surface. The second system, as the name implies, the water emission is taken under the soil surface, with moisture front tangent to the surface (depending on depth), thus avoiding the exposure of wetted surface and reducing even further evaporation losses when compared to surface drip, thus ensuring uniformity of water close to 100% (NOGUEIRA et al., 2000; ALBUQUERQUE E MAENO, 2007).
The region, which receives the water applied by irrigation, is known as wet bulb, where the plant roots easily absorb water and nutrients. The accurate estimation of the shape and dimensions of the wet bulb is important for determining the number of emitters per plant and
underestimation of the wet bulb lowers the efficiency of the system, resulting in inappropriate spending due to the overestimation of the hydraulic structure, the waste of water, energy and fertilizer, while the risk of overestimation may cause stress to culture and promote a wrong form of root distribution (SOUZA, 2002).
The dimensions of wet bulb depend mainly on the following factors: structure and soil texture, flow from the drip, frequency of application and initial soil moisture. Field tests are recommended to generate information that can assist in the design of subsurface drip irrigation system. In most cases, field tests are not performed due to the high demand of time, hard work, care and experimental resources involved (SOUZA, 2002).
For accurate measurements of electrical conductivity in the laboratory and / or field there is a tendency to use the TDR. The inherent advantages of this technique as precision,
non-possibility of automation and coupling devices multiplexers readings, little influence of texture, density and salinity are strong justifications for the increased adoption of technical, replacing other methods (TOPP et al. 1980; COELHO & OR, 1996; SOUZA et al., 2006b). On the other hand, its main drawback has been the cost, still high by the standards of national agriculture.
Due to the existence of the international trend of using TDR to study the dynamics of solution and a deficiency of work on the dimensioning of subsurface drip, this project proposes to study the dynamics of solution on a sandy soil under controlled conditions, for a better understanding of distribution of soil solution applied in the wet bulb in subsurface drip.
MATERIALS AND METHODS
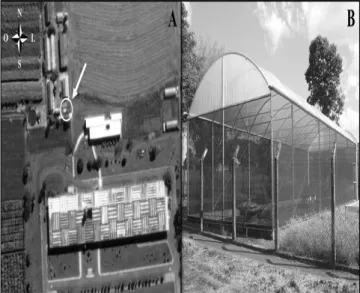
The experiment was conducted in the experimental area of the Department of Natural Resources and Environmental Protection of the Center for Agricultural Sciences, Federal University of São Carlos, in the municipality of Araras, state of São Paulo, in a greenhouse (Figure 1) of 140 m². The soil belongs to the group Neossolo Quartzarênico was collected from a surface layer (0-0.30 m) in the region of Leme city, whose geographic coordinates are: 22 º 11'08 "south and longitude 47 º 23'25" west, with 619 m above sea level.
Figure 1. Satellite photo of the experimental area
with circular dial spot, where the experiment was conducted (GOOGLE, 2013) (A); greenhouse used (B).
For determination of a soil analysis, samples were taken at different depths (0-0.15; 0.15-0.30 m) with the aid of a volumetric ring. The samples were brought to the laboratory of Soil Physics from the university, the results of the analysis are presented in Table 1.
Table 1. Soil analysis on depths of 0-0.15 m and
0.15-0.30 m.
Samples Grain size (%) Porosity (%) Density (g cm-3)
Dephts
(m) Clay Sand Silt Micro Macro Full Soil Particle
0-0.15 6.0 91.0 3.0 10.1 29.1 39.2 1.66 2.78
0.15-0.30 7.0 92.0 1.0 8.3 29.1 37.4 1.68 2.70
The probes used in the experiment were constructed at the university, following methodology Souza et al. (2006b).
probes in a PVC container, 36 probes which were distributed symmetrically on a central axis with a spacing of 0.10 m, forming a vertical and horizontal mesh were used, where each probe represents an area of 0.01 m2, promoting accurate measurements in two directions from the dripper (Figure 2), the distribution of probes was based Souza et al. (2006a).
Figure 2. The dimensioning of the TDR probes in a
PVC container.
The drippers were used in NaanDanJain brand, the model Amnon Drip PC AS , which is a self-compensating dripper (PC) that maintains constant pressure to standardize the flow. One emitter in each container at a depth of 0.30 m with a pressure of 2.0 bar was installed service, however, with different flow rates (1.0 and 1.6 L h-1).
According to the methodology used by Mmolawa & Or (2000) and Souza & Folegatti (2010), the soil was dried and sieved on a 2.0 mm sieve. After that, it placed in the container in
layers of 0.05 m that were lightly compacted to reproduce their original condition field. TDR probes were placed as previously described scaling, demonstrated in the following Figure:
Figure 3. Organization of the TDR probes (A);
installation of the probes in the experiment (B), adding soil (C); complete assembly of the experiment (D).
The equipment used in the experiment to estimate the moisture was through a TDR100 Reflectometer (Campbell Scientific) along the channel plates multiplexing SDMX-50, which analyzes the electromagnetic signal automatically by a datalogger (CR1000 datalogger, Campbell Scientific). Thus, the formation of the wet bulb and spatial distribution of solution were evaluated jointly function of time.
Communication with the equipment was taken through a laptop using the LoggerNet 3.4 program (Campbell Scientific). To perform the readings for the equipment in the field, it was necessary to make a datalogger programming; this program was based on Santoro (2011).
The experiment (Figure 4) was performed by applying a solution of KNO3 in 1.0 L of water per hour, a total of 10 applications according to
the procedure described by Souza et al. (2006a). The used solution of potassium nitrate (KNO3) had electrical conductivity equal to 2.0 dS m-1, because this value presents moderate risk of salinization in irrigation water. As regards the choice of nutrients was due to the fact that both nutrients present high mobility in soil, desirable behavior in studies of the dynamics of ions in the soil solution.
The readings of electrical conductivity apparent (ECTDR, dS m-1) were provided by technical monitored by programming readings every 15 minutes until the aggregation applications. To estimate the electrical conductivity of the solution (ECS, dS m-1), ECTDR and soil moisture (θ, m3 m-3) values obtained were applied to the calibration equation below:
(1)
For mapping the surface profile of the distribution of solution was used the Surfer software, by mirroring halves of the wet bulb, making the average of each point resulting from the overlap of one half with the other, as performed by Barros et al. (2009).
The storage of the soil solution was recorded considering that every two TDR probes placed symmetrically in opposite directions, representing a concentric ring. Thus, the average solution content of each ring is multiplied by its corresponding volume of soil, which allow to obtain the distributed of solute in each application.
The results of the distribution and storage of soil solution allowed identifying necessary information relating to the effects of water-soil-solute relation that can assist in the design and management of subsurface irrigation.
Figure 4. Conducting the experiments with flow
rates of 1.0 and 1.6 L h-1.
RESULTS AND DISCUSSION
Using SURFER program was possible to understand and compare the dynamics of solution in the soil between treatments. The interpolation method has been chosen in the Kriging method according to Gonçalves (2004), this method makes use of an unbiased linear interpolator and minimum variance which ensures the best estimate of the data.
In Figures 5 and 6 were observed the electrical conduction profiles, by virtue of the large number of graphics, wet bulbs chosen to represent the profiles were 1, 2, 3, 5, 7, 10 L;
between the treatments (1.0 to 1.6 L h-1). Each isoline represented by a shade of black, has a value of 0.02 dS m-1, it is possible to analyze the formation of the wet bulb by advancing wetting front in the soil.
The results showed that the flow of drippers did not have a differential effect on the formation of the wet bulb. According to the values of electrical conductivity readings obtained with the TDR, we analyzed the bulbs were characteristic forms were described by Zur (1996), with rounded and elliptical shapes.
Analyzing the wet bulbs in both flows were greater horizontal displacement at the beginning, but after the fifth application displacements of the two directions were equal, and getting the last application the average values of 0.50 m (vertical) and 0.38 m (horizontal).
Figure 5. Comparison of the profile electrical
conductivity (dS m-1) at the end of each application on soil solution flow of 1.0 L h-1.
Regarding storage, the highest observed for the two treatments in the 0.30-0.40 m layer, with mean values of 23.3 and 25.3%, respectively. These monitored for both flows, the largest solute storage began in the third layer (0.20-0.30 m), moving to the fourth layer (0.30-0.40 m) from the third application, noting that there is a relation between the solute storage into the wet bulb, because with the increase of the volume applied, there was a direction of the solute storage to the deeper layers.
Look at a distribution of soil solution, being a higher concentration near the emitter and thus a reduction thereof, when it approaches the wetting front. As can be noted the presence of solute in the wet bulb into average displacement horizontal of 0.37 m vertically from the emitter of 0.18 m.
Figure 6. Comparison of the profile electrical
conductivity (dS m-1) at the end of each application
CONCLUSION
With present work was possible to know the dynamics of soil solution with the formation of spherical wet bulbs having the same behavior for the two flows. It was noted that a greater storage of electrical conductivity was coming from the drip zone and possessed a distribution gradient with the highest concentration near the emitter and lowest near of the wetting front.
ACKNOWLEDGMENT
The authors would like to give a gratefully acknowledged to Federal University of São Carlos and FAPESP.
REFERENCES
ALBUQUERQUE, P. E. P. de; MAENO, P.
Requerimento de água das culturas para fins de dimensionamento e manejo de sistemas de irrigação localizada. Sete Lagoas: Embrapa
Milho e Sorgo, 2007. 56p.
BARROS, A. C.; FOLEGATTI, M. V.; SOUZA, C. F.; SANTORO, B. L. Soil solution distribution applied by sub-surface and surface drip irrigation. Brazilian Journal of Agricultural and Environmental Engineering,
v.14, n.6, p.700-707, 2009.
COELHO, E.F.; OR D. Flow and uptake patterns affecting soil water sensor placement for drip irrigation management. Transaction of the
ASAE, v.39, n.6, p.2007-2016, 1996.
GONÇALVES, A. C. A. Uso da geoestatística
para o manejo da água na agricultura irrigada. In: Eduardo Guimarães Couto; Jésus
Franco Bueno. (Org.). Os (des) caminhos do uso da água na agricultura brasileira. 1 ed. Cuiabá: EdUFMT - Editora Universitária, v. 1, p. 1-40, 2004.
GOOGLE. Digital Globe, dados do mapa. < https://www.google.com.br/maps/preview#!data
=!1m4!1m3!1d759!2d-47.3835002!3d-22.3134137!2m1!1e3&fid=7> Acesso em: 20 Nov. 2013.
MMOLAWA, K.; OR, D. Root zone solute dynamics under drip irrigation: A review. Plant
and Soil, v.222, n.1-2, p.163-190, 2000.
NOGUEIRA, C. C. P.; COELHO, E. F.; LEÃO, M. C. S. Characteristics and dimensions of the volume of wetted soil under surface and subsurface drip irrigation. Brazilian Journal of
Environmental Agricultural Engineering, v.4,
n.3, p.315-320, 2000.
SANTORO, B. de L. Estudo da dinâmica da
solução do solo para o manejo da
fertirrigação por gotejamento na cultura do pimentão. 2011. 57 p. Dissertação (Mestrado em
Agricultura e Ambiente) - Universidade Federal de São Carlos, Araras.
SOUZA, C. F. A utilização da reflectometria
no domínio do tempo (TDR) na modelagem do bulbo molhado do solo irrigado por gotejamento. 2002. 124 p. Tese (Doutorado em
Engenharia Agrícola na área de concentração em Água e Solo) - Faculdade de Engenharia Agrícola, Universidade Estadual de Campinas, Campinas.
SOUZA, C. F.; FOLEGATTI, M. V. Spatial and temporal characterization of water and solute distribution patterns. Scientia Agrícola, v.67, n.1, p.9-15, 2010.
SOUZA, C. F.; FOLEGATTI, M. V.; MATSURA, E. E.; OR, D. Time domain reflectometry (TDR) calibration for estimating soil solution concentration. Agricultural. Engineering, v.26, n.1, p.282-291, 2006a.
SOUZA, C. F.; MATSURA, E. E.; FOLEGATTI, M.V.; COELHO, E.F.; OR, D.
Use of TDR probes to estimate soil moisture and electric conductivity Irriga, v.11, n.1, p.12-25, 2006b.
TOPP, G.C.; DAVIS, J.L.; ANNAN, A.P. Electromagnetic determination of soil water content: measurements in coaxial transmission lines. Water Resources Research, v.16, n.3, p.574-582, 1980.
ZUR, B. Wetted soil volume as a design objective in trickle irrigation. Irrigation