Department of Information Science and Technology
AGV-RAD: AGV Positioning System for Ports
using Microwave Doppler Radar
Lin Ma
A Dissertation presented in partial fulfillment of the Requirements for the Degree of
Master in Telecommunications and Computer Engineering
Supervisor:
Dr. Octavian Adrian Postolache, Associate Professor ISCTE-IUL
Co-supervisor
Dr. Yongsheng Yang, Full Professor Shanghai Maritime University
Resumo
I
Resumo
Automação e inteligência artifical tornaram-se uma tendência inevitável no desenvolvimento dos terminais dos contentores. O posicionamento do VAG (Veículo Autónomo Guiado) é um dos problemas principais para construir as portas automatizadas. Embora a tecnologia RFID de frequência ultra-alta (UHF) existente tenha uma boa precisão e estabilidade de medição no posicionamento VAG dos portos, as etiquetas magnéticas expostas são fáceis de danificar sob a comum carga pesada e o seu habitual custo de construção e manutenção é insuportável para a maioria das portos. Entre as tecnologias para o posicionamento VAG, o radar Doppler de microondas possui uma forte capacidade de penetração e pode funcionar bem em ambientes complexos (dia, noite, nevoeiro e chuva). Portanto, o sistema de posicionamento VAG baseado em radar Doppler de microondas atraiu muita atenção.
Nesta tese, foi estabelecido um sistema de teste usando a técnica acima mencionada, juntamente com uma plataforma de computação em tempo real, NI myRIO compatível com Wi-Fi. Vários algoritmos de computação foram envolvidos para extrair os valores precisos de distancia e velocidade. O “denoising” de wavelets com a função de limiar adaptado foi utilizado para filtrar o ruído nos sinais de radar. Na análise do domínio da frequência, o algoritmo conjunto FFT e Chirp-Z Transform (CZT) foi proposto para suprimir a influência dos efeitos de resolução e também melhorar o desempenho em tempo real. Além disso, o algoritmo 2D-FFT é usado para calcular a velocidade do VAG. De acordo com o ambiente dos portos, o algoritmo de posicionamento VAG e o método de comunicação adequado baseados em radares Doppler de microondas e NI myRIO-1900s também serão propostos.
A eficiência do sistema proposto foi testada experimentalmente e vários resultados estão descritos nesta dissertação.
Palavras-chave: Posicionamento VAG; Radar Doppler por Microondas; DSP;
Abstract
II
Abstract
Automation and intelligence have become an inevitable trend in the development of container terminals. The AGV (Automated Guided Vehicle) positioning is a primary problem to build the automated ports. Although the existing Ultra-High Frequency(UHF) RFID technology has good measurement accuracy and stability in the port AGV positioning, the exposed magnetic tags are easy to damage under the common heavy load, and its construction and maintenance cost is unbearable to most ports.
Among the candidate technologies for the AGV positioning, microwave Doppler radar has a strong penetrating ability, and can work well in a complex environment (day and night, foggy, rainy). Therefore, the microwave Doppler radar-based AGV positioning system has attracted a lot of attention.
In this thesis, a test system using the above technique was established, together with a NI myRIO real-time Wi-Fi compatible computation platform. Several computation algorithms were implemented to extract the accurate values of range and velocity. Wavelet denoising with the adapted threshold function was considered to filter noise contained in radar signals. In the frequency domain analysis, FFT and Chirp-Z Transform (CZT) joint algorithm was proposed to suppress the influence of fence effects and also improves real-time performance. In addition, 2D-FFT is used to calculate velocity of AGV. According to the port-like environment, the suitable AGV positioning algorithm and communication method based on microwave Doppler radars and NI myRIO-1900s also be proposed.
The effectiveness of the proposed system was experimentally tested and several results are included in this thesis.
Acknowledgements
III
Acknowledgements
At first, I want to express my greatest gratitude to my supervisor, Professor Octavian Postolache, because of his carefulness and patience, as well as tremendous support during the realization of this project.
I would like to express my sincere gratitude to my Shanghai Maritime University supervisors, Professor Yongsheng Yang and Doctor Haiqing Yao. During ISCTE-IUL, they are very concerned about my study and life, and provide assistance to my difficulties in time.
My thanks also goes to my family, especially to my parents, Zhenhe Ma and Meiying Li, and my brother, Shixin Ma, for their support and hard work.
The thanks to my boyfriend, Peiyao Tang, for his constant encouragement, help and care.
Finally, a huge thanks to my colleges, Yongshuang Wang, Dongchen Ni, Yu Jin, Zeyu Ma, Mariana Jacob Rodrigues, and Joao Monge. During the year of studying in Lisbon, we have finished several works and acquired many experiences. And thanks for their help and kind.
Content IV
Content
Resumo ... I Abstract ... II Acknowledgements ... III Content ... IV List of Figures ...VII List of Tables ...X List of Acronyms... XIChapter 1. Introduction ... 1
1.1 Motivation ... 1
1.2 Objectives ... 2
1.3 Structure of the Dissertation ... 2
Chapter 2. State of the art ... 3
2.1 Automated Guided Vehicle (AGV) ... 3
2.1.1. Container Terminal AGV Transport System ... 3
2.1.2. AGV characteristics... 4
2.2 Microwave Doppler Radar ... 4
2.2.1. The Advantages of Microwave Doppler Radar... 5
2.2.2. Radar frequency band and microwave penetration ... 6
2.2.3. Radar Architecture ... 8
2.2.4. Antenna System ... 10
2.3 Physical Basics- Radar Equation...10
2.3.1. Reflection ... 10
2.3.2. Radar Cross Section ... 11
2.4 Frequency Modulation ...12
2.4.1. Pulse Radar ... 12
2.4.2. Continuous Wave Doppler Radar ... 13
2.4.3. Frequency Modulated Continuous Wave Radar... 15
2.5 Wavelet Denoising...18
Chapter 3. System Description... 19
3.1 Hardware Platform ...19
3.1.1. Microwave Radar Sensor IVS-162 ... 19
3.1.2. Microwave Radar System Nano SP25 ... 22
3.1.3. NI myRIO-1900 ... 26
3.2 Wireless Communication Protocols- Wi-Fi ...27
3.3 Implementation of Hardware Platform ...28
Content
V
3.3.2 Generation of Sawtooth Wave Signal ... 30
3.3.3 The Connection Method of SP25 ... 31
3.4 Developed Software ...32
3.4.1 Description of LabVIEW software... 32
3.4.2 NI myRIO-1900 Required Software ... 32
3.4.3 MATLAB software ... 33
Chapter 4. Beat Signal of Microwave Radar Sensor Denoising ... 34
4.1 Noise Sources ...34
4.1.1 SNR ... 34
4.1.2 Noise Sources Analysis ... 35
4.2 Theory of Wavelet Transform ...36
4.2.1 Discrete Wavelet Transform... 36
4.2.2 Mallat Algorithm ... 36
4.3 Threshold Denoising ...39
4.3.1 Mother Wavelets... 40
4.3.2 Decomposition Layer J ... 41
4.3.3 Threshold λ ... 41
4.3.4 Hard Threshold Function and Soft Threshold Function ... 42
4.3.5 Adapted Threshold Function ... 43
4.4 Simulation Results ...46
Chapter 5. Range and Velocity Detection ... 53
5.1 Detection Principle ...53
5.1.1 Static Target ... 53
5.1.2 Range Resolution ... 54
5.1.3 Moving Target ... 54
5.2 Range Measurement Algorithm ...55
5.2.1 FFT ... 55
5.2.2 Meaningful of refine the spectrum ... 56
5.2.3 Chirp-Z Transform ... 58
5.2.4 The Procedure of FFT and CZT Joint Algorithm ... 59
5.3 Velocity Calculation Method ...61
5.4 Validation ...63
5.4.1 Parameters and Experimental Setup ... 63
5.4.2 Experimental Results ... 64
Chapter 6. Positioning Method ... 71
6.1 Reading Target Information ...71
6.2 Positioning Algorithm and Communication Method ...72
Content
VI
6.3.1 Positioning Error ... 75
6.3.2 Positioning Error Handling ... 76
6.4 Experiment and Result ...78
6.4.1 AGV Experimental Setup ... 78
6.4.2 Results ... 78
Chapter 7. Conclusions and Future Work ... 84
7.1 Conclusions ...84
7.2 Contributions ...85
7.3 Future Work ...85
Reference ... 87
Appendix A – Scientific Articles ... 91
List of Figures
VII
List of Figures
Figure 2.1 - Work Area of AGV in the Port ... 4
Figure 2.2 - AGV (Left: from Gottwald; Right: from Shanghai Zhenhua Heavy Industries Company) ... 4
Figure 2.3 - Radar Front End Block Diagram ... 8
Figure 2.4 - Receiver Model ... 9
Figure 2.5 - Detection Range of Microwave Doppler Radar ... 10
Figure 2.6 - Principle of Pulse Radar ... 12
Figure 2.7 - Doppler Effect diagram ... 13
Figure 2.8 - The Radar Transmits Waves and Meets Target ... 14
Figure 2.9 - The Microwave back to Radar form Target ... 14
Figure 2.10 - Principle of Triangle Wave Modulation of FMCW Radar ... 16
Figure 2.11 - Principle of Sawtooth Wave Modulation of FMCW Radar ... 17
Figure 3.1 - Microwave Radar Sensor IVS-162 ... 19
Figure 3.2 - Antenna Direction and Output Power of IVS-162 ... 20
Figure 3.3 – SP25 ... 22
Figure 3.4 - NI myRIO-1900 Guide Diagram... 26
Figure 3.5 - NI myRIO-1900 Hardware Block Diagram ... 27
Figure 3.6 - Equipment of Hardware Platform ... 28
Figure 3.7 - Data Acquisition System Diagram ... 29
Figure 3.8 - DDS Function Signal Generator and Adjust Output voltage... 30
Figure 3.9 - Result of Sawtooth Wave with 5V and 500Hz ... 31
Figure 3.10 - Connection of SP25 ports ... 31
Figure 4.1 - Signal Decomposition Flow Chart of Mallat Algorithm ... 38
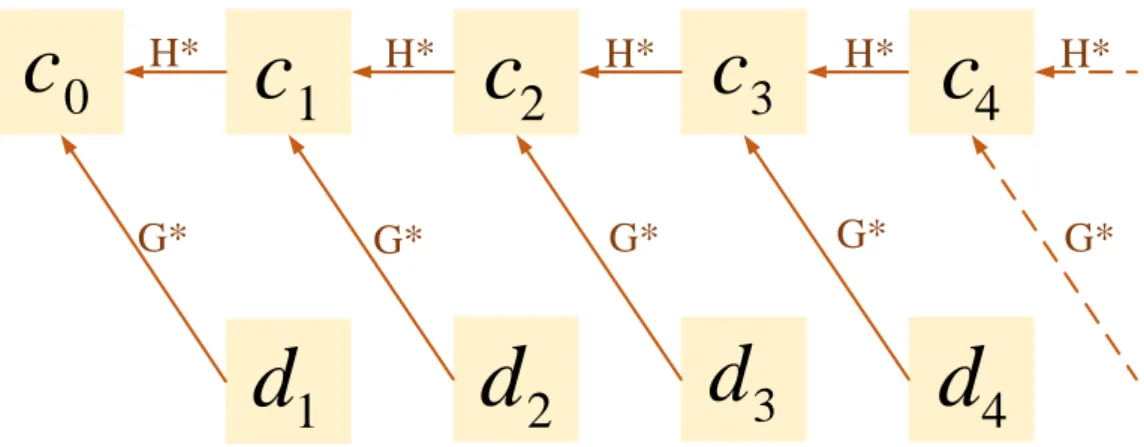
Figure 4.2 - Signal Reconstruction Flow Chart of Mallat Algorithm ... 39
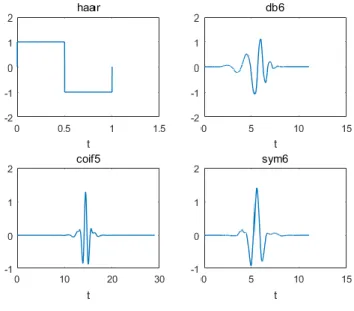
Figure 4.3 - Wavelets... 41
Figure 4.4 - Hard Threshold Function and Soft Threshold Function ... 43
Figure 4.5 - Adapted Threshold Function and Compering with Classic Functions ... 43
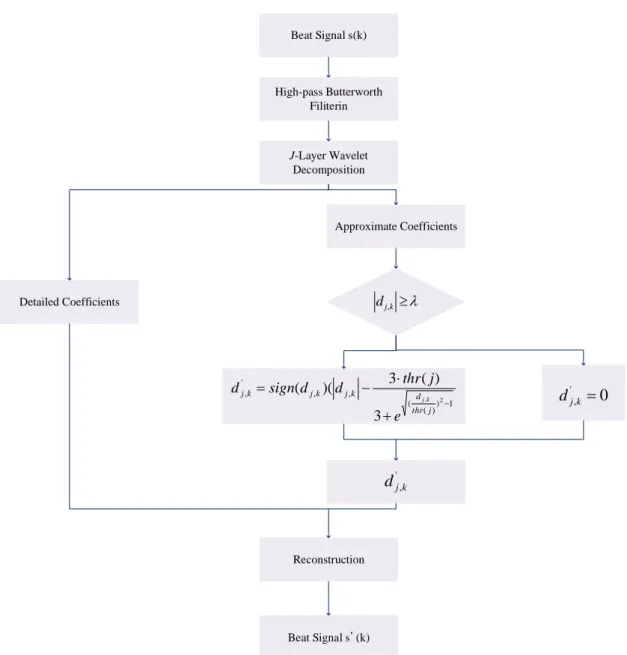
Figure 4.6 - The Flow Chart of Wavelet Denoising based on Adapted Threshold Function ... 44
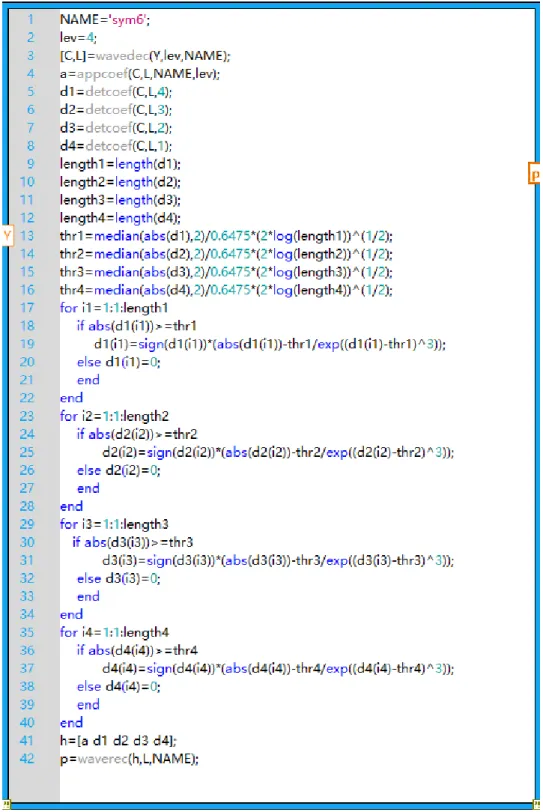
Figure 4.7 - The MATLAB Script of Wavelet Denoising with Adapted Threshold Function ... 45
List of Figures
VIII
Figure 4.9 - Hard Threshold Denoising and Soft Threshold Denoising ... 46
Figure 4.10 - Adapted Threshold Denoising ... 47
Figure 4.11 - Wavelet Denoising of 3 Decomposition Levels ... 50
Figure 4.12 - Wavelet Denoising of 4 Decomposition Levels ... 50
Figure 4.13 - Wavelet Denoising of 5 Decomposition Levels ... 51
Figure 4.14 - Wavelet Denoising based on Adapted Threshold Function of Original SNR=25... 51
Figure 4.15 - Wavelet Denoising based on Adapted Threshold Function of Original SNR=20... 52
Figure 4.16 - Wavelet Denoising based on Adapted Threshold Function of Original SNR=15... 52
Figure 5.1 - The description of FFT and CZT joint algorithm ... 57
Figure 5.2 - The LabVIEW Program of FFT and CZT Joint Algorithm ... 60
Figure 5.3 - The Flow Chart of FFT and CZT Joint Algorithm ... 61
Figure 5.4 - Beat Signal for a Single Moving Target in Ramp Index Domain ... 62
Figure 5.5 - Principle of 2D FFT ... 62
Figure 5.6 - The LabVIEW Program of 2D FFT ... 63
Figure 5.7 - The System Prototype ... 64
Figure 5.8 - Experimental Setup ... 64
Figure 5.9 - Measured Beat Signal and Denoising Beat Signal of 6m (Left) and 11m (Right) Range... 65
Figure 5.10 - FFT Spectrum which the radar-target range is 6m ... 65
Figure 5.11 - CZT Spectrum for a radar-target range of 6m ... 66
Figure 5.12 - FFT and CZT joint Algorithm: FFT Spectrum and CZT Spectrum of 11m ... 66
Figure 5.13 - The Result 1 with Range is 20m and Velocity is 10m/s of Target ... 68
Figure 5.14 - The Result 2 with Range is 20m and Velocity is 5m/s of Target ... 68
Figure 5.15 - The Result 3 with Range is 11m and Velocity is 6m/s of Target ... 69
Figure 6.1 - Main Program for Reading Target Information of SP25 ... 71
Figure 6.2 - The Test of Single SP25 Microwave Radar System ... 72
Figure 6.3 - Main Positioning Method ... 72
Figure 6.4 - Positioning System ... 74
Figure 6.5 - NI myRIO Project ... 74
List of Figures
IX
Figure 6.7 - The Flow Chart of Path Generation ... 77
Figure 6.8 - Laboratory Environment ... 78
Figure 6.9 – The Positioning Result at Point [2, 2] ... 79
Figure 6.10 - The Absolute Error of Positioning at Point [2, 2] ... 79
Figure 6.11 – The Positioning Result at Point [4, 3] ... 80
Figure 6.12 - The Absolute Error of Positioning at Point [4, 3] ... 80
Figure 6.13 - The Test Result without Processing... 81
Figure 6.14 - The Test Result with Processing ... 81
Figure 6.15 - Positioning a Rectangular Path A ... 82
List of Tables
X
List of Tables
Table 2.1 - Contradistinction of Microwave Sensor, Laser Sensor, Ultrasonic Sensor
and HF RFID ... 6
Table 2.2 - Standard Letter Designations for Radar-Frequency Bands ... 7
Table 2.3 - Microwave Penetration of Material ... 8
Table 2.4 - Approximate RCS for an Object ...11
Table 3.1- Antenna System Pattern ... 20
Table 3.2 - Data Sheet of IVS-162 ... 21
Table 3.3- PINs of IVS-162 ... 21
Table 3.4 - Radar Parameters of SP25 ... 22
Table 3.5- PIN Interface Definition of SP25 ... 23
Table 3.6 -Target Information ... 24
Table 3.7- The Format of SP25 Target Output Information message ... 25
Table 3.8- Main Features of Wi-Fi ... 28
Table 3.9- Advantages and Disadvantages of the Wi-Fi Protocol... 28
Table 3.10- Specifications of DDS Function Signal Generator ... 30
Table 3.11- Required Software of myRIO-1900 ... 33
Table 4.1- Wavelets ... 40
Table 4.2- Wavelet Denoising based on Hard Threshold Function ... 47
Table 4.3- Wavelet Denoising based on Soft Threshold Function ... 48
Table 4.4- Wavelet Denoising based on Adapted Threshold Function ... 49
Table 5.1- Parameters of Microwave Radar ... 63
Table 5.2- Range Measurement Experimental Results ... 67
List of Acronyms
XI
List of Acronyms
ADC Analog-to-Digital Converter AGV Automated Guided Vehicle
CW Continuous Wave
CZT Chirp-Z Transform
DFT Discrete Fourier Transform DSP Digital Signal Processing DWT Discrete Wavelet Transform ECG Electrocardiograph
FFT Fast Fourier Transform
FMCW Frequency Modulated Continuous Wave FPGA Field Programmable Gate Array
FSK Frequency Shift Keying IF Intermediate Frequency IoT Internet of Things
IP Internet Protocol
RCS Radar Cross Section
RF Radio Frequency
RFID Radio Frequency Identification SNR Signal-to-Noise Ratio
TCP Transmission Control Protocol TEU Twenty Feet Equivalent Unit TTL Transistor-Transistor Logic
UART Universal Asynchronous Receiver Transmitter USB Universal Serial Bus
VCO Voltage Controlled Oscillator Wi-Fi Wireless Fidelity
Chapter 1. Introduction
1
Chapter 1. Introduction
1.1 Motivation
According to statistics, the container throughput of Port of Shanghai has reached about 21.54 million TEU in the first half-year of 2019, which has increased 5.02% year on year [1]. Also in this period, the container throughput in Port of Singapore, Port of Rotterdam [2], Port of Antwerp, Port of Hamburg and Port of Los Angeles amounted to 18.03 million TEU, 7.53 million TEU, 5.84 million TEU, 4.66 million TEU, and 4.51 million TEU respectively, which growth rate is 0.06%, 6.36%, 4.85%, 7.62%, and 4.64%. Therefore, the transportation efficiency of the port needs to improve urgently. Otherwise, the backlog of container ships and cargo will have a bad effect on the overall efficiency of the port. AGV is new equipment that occupies an important position in the smart port. It is a fully automatic carrier that transport containers from the quayside to the storage yard. The questions that need to answer regarding AGV operation are: Where am I? Where am I going? How can I get there? Therefore, the most fundamental and critical issue for the AGV system is ‘where am I?’, that is translated to the positioning problem.
At present, Ultra-High Frequency (UHF) RFID (Radio Frequency Identification) technology is the most applied solution for AGV positioning. However, the time response of RFID identification capability is not very short. In addition, it is necessary to lay magnetic tags in the yard in advance, the exposed magnetic tags are easily damaged, so the labor and maintenance costs are extremely high.
To solve and optimize the AGV positioning, the MSc research work proposed a new positioning method that can be applied as a complementary positioning solution for AGV that work in ports.
This project aims to use microwave Doppler radar sensors to achieve AGV positioning system which can detect range and velocity of AGV at the same time. In order to ensure small size and easy installation of the designed system, NI myRIO-1900 which has built-in Wi-Fi (Wireless Fidelity) is used as embedded equipment. LabVIEW software is the main platform using for Digital Signal Processing (DSP). In addition, the
Chapter 1. Introduction
2
positioning interface can display real-time AGV location and path information for the administrator of the port to facilitate scheduling and decision making in time.
1.2 Objectives
This MSc thesis presents a developed hardware and software platform for AGV positioning system based on microwave Doppler radar sensors.
Develop DSP components associated with microwave radar intermediary frequency signals to extract useful information related to the target.
Develop measurement algorithms to extract accurate range and velocity information of AGV. Develop data fusion method, positioning algorithm.
A graphical user interface that presents the AGV location and path information that can be accessed by the administrator of the port in real-time.
1.3 Structure of the Dissertation
Chapter 2 – includes the state of art for remote positioning systems (RFID, LIDAR,
microwave Doppler radar and ultrasonic radar). Also the literature review on AGV, FMCW (Frequency Modulated Continuous Wave) radar, and signal processing.
Chapter 3 – presents the reason for the selection of each device and software, then
describes the AGV positioning system based on microwave Doppler radar.
Chapter 4 – presents a reasonable processing method for the noise contained in the
radar signal, and gives the simulation results to verify its feasibility.
Chapter 5 – is the range and velocity measurement based on the principle of radar
beat signal.
Chapter 6 – is the algorithm of AGV positioning method. It mainly includes AGV
positioning algorithm, data fusion, error processing. In addition, the experimental results under the simulated port environment are contained in this chapter.
The last chapter is the conclusion, discussions, summarizes and future work of the full text.
Chapter 2. State of the art
3
Chapter 2. State of the art
2.1 Automated Guided Vehicle (AGV)
As advanced automatic handling equipment, AGV is an equipment that is the key to smart ports providing a high level of automation and unified scheduling. In the last decade, the AGV has been gradually applied to the automatic handling of containers in large international ports.
2.1.1. Container Terminal AGV Transport System
Container terminal refers to a clear boundary area that can accommodate a complete container handling operation process. It is a buffering place for containers when it is converted and transported. Therefore, the container terminal plays an important role in the whole container transportation process.
As mentioned above, with the rapid increase in container throughput, the emergence of automated handling equipment has become inevitable. The AGV is a new device for horizontal transportation in smart ports and takes on the task of moving goods from the quayside to the storage yard in the port operation. AGV is small in size, lightweight and has a large carrying capacity, it is capable of handling containers of two standard sizes: twenty-footer (one TEU) or forty-footer (two TEUs). An AGV may carry a box of one TEU or two TEUs, or carry 2 boxes of one TEU each.
When a ship arrives at the container terminal for transshipment, containers are first discharged from the ship onto the AGV by quay cranes. The AGV then transports the containers to specific storage locations in the yard area, at last, the container is dismounted from the AGV by yard cranes, the floor plan of the port as shown in Figure 2.1 [3].
Chapter 2. State of the art
4
Quayside AGV Storage Yard
Figure 2.1 - Work Area of AGV in the Port
2.1.2. AGV characteristics
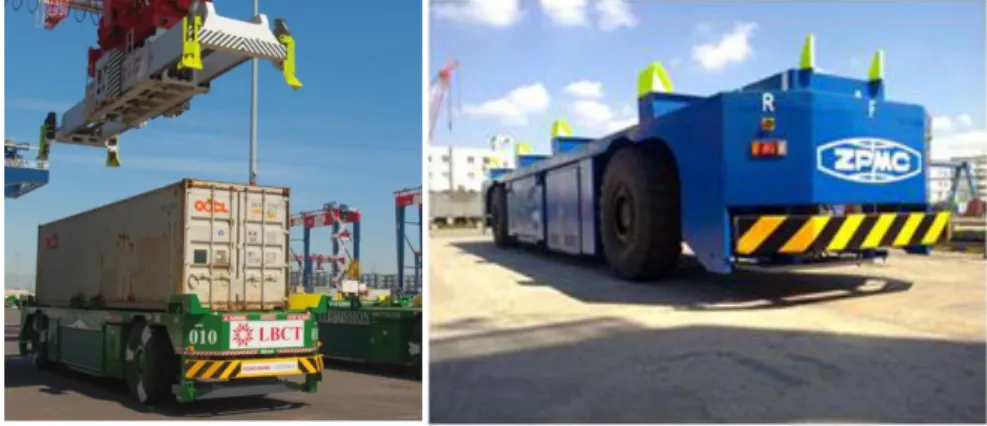
The AGV dimension made by Gottwald from Germany is 14.8m*3.0m*1.9m, and the maximum velocity is 1.67km/h or 2.22km/h. And the AGV dimension of Shanghai Zhenhua Heavy Industries Company Limited is 15m*3.1m*2m, the maximum velocity is 1.67km/h, as shown in Figure 2.2.
Figure 2.2 - AGV (Left: from Gottwald; Right: from Shanghai Zhenhua Heavy Industries Company)
2.2 Microwave Doppler Radar
The basic application of microwave Doppler radar can be traced back to the 1930s, especially during the Second World War, the microwave Doppler radars were widely developed and applied for military defense, target detection, and so on.
The modern applications of radar are highly diverse, including vital sign induction [4], air and ground traffic control [5-7], radar astronomy, air defense system, anti-missile
Chapter 2. State of the art
5 system, marine radars for locating landmark and collision avoidance system, marine surveillance system, meteorological precipitation monitoring, altimetry and flight control system [8], missile target location system and ground-penetrating radars for geological observation.
2.2.1. The Advantages of Microwave Doppler Radar
There have three common solutions that can be considered for AGV positioning in this case: ultrasonic sensor, laser sensor, and microwave radar sensor, these sensors have different characteristics, as shown in Table 2.1.
(1) Ultrasonic sensor: The propagation speed of ultrasonic is obviously affected by temperature. Measurement errors will generate when the ultrasonic instrument is applied in complex and variable fields. In addition, ultrasonic energy decays quadratically with distance, this characteristic leads to bad long-ranging ability [9].
(2) Laser sensor: The laser sensor-based solution is very sensitive to light intensity and air quality in the environment [10].
(3) UHF RFID: The exposed magnetic tags are easy to damage under the common heavy load, and its construction and maintenance costs are unbearable to most ports.
(4) Microwave Doppler radar sensor:Compared to either infrared or visible light, the microwave has greater penetration capability, which has a unique advantage to many civilian and military applications [11].
Chapter 2. State of the art
6
Table 2.1 - Contradistinction of Microwave Sensor, Laser Sensor, Ultrasonic Sensor and HF RFID Microwave Sensor Laser sensor Ultrasonic sensor UHF RFID Darkness Penetration
Ability Strong Strong Weak Strong
Weather Effect Small Large Small Small
Temperature Effect Small Small Large Small
False Alarm
Probability Small Large Large Small
Resolution Capability Strong Weak Weak Weak
Hardware Cost Medium Medium Low High
Technical
Requirement High Medium Low Low
Therefore, the microwave Doppler radar sensor has characteristics of strong anti-interference ability, small volume, high resolution, low power consumption, strong ability to penetrate smoke, fog, and dust. It can measure the range and velocity of the target at the same time. Based on its advantages, using microwave Doppler radar to achieve AGV positioning is a novel idea.
2.2.2. Radar frequency band and microwave penetration
The type of radar is divided by the radar band and wavelength. An important indicator in radar transmitters is the radar wavelength. The standard letter designations for radar-frequency bands as Table 2.2, according to IEEE Standard 521-2002,Chapter 2. State of the art
7 Table 2.2 - Standard Letter Designations for Radar-Frequency Bands
Band Name Frequency Range Wavelength Range Note
HF 3–30 MHz 10–100 m Over-the-horizon radar (OTH) radars; 'High Frequency'
VHF 30–
300 MHz 1–10 m Very long range; 'very high frequency' P < 300 MHz > 1 m Essentially HF + VHF
UHF 300–
1000 MHz 0.3–1 m
Very long range (e.g. ballistic missile early warning); 'Ultra High Frequency' L 1–2 GHz 15–30 cm Long range (e.g. air traffic control
and surveillance); 'L' for 'long' S 2–4 GHz 7.5–15 cm Marine radar; 'S' for 'short'
C 4–8 GHz 3.75–7.5 cm Satellite transponders; a compromise (hence 'C') between X and S bands; X 8–12 GHz 2.5–3.75 cm Missile guidance; Named X band because
the frequency was a secret during WW2. 𝐾𝑢 12–18 GHz 1.67–2.5 cm
High-resolution, also used for satellite transponders, frequency under K band
(hence 'u')
K 18–24 GHz 1.11–1.67 cm From German kurz, meaning 'short'; Detecting clouds by meteorologists; 𝐾𝑎 24–40 GHz 0.75–1.11 cm Mapping, short range, airport surveillance;
frequency just above K band (hence 'a')
mm 40–
300 GHz 1.0–7.5 mm
The frequency ranges depend on waveguide size.
V 40–75 GHz 4.0–7.5 mm Very strongly absorbed by atmospheric oxygen, which resonates at 60 GHz.
W 75–
110 GHz 2.7–4.0 mm
Used as a visual sensor for experimental autonomous vehicles.
The frequency is between 300MHz and 3000GHz, and the wavelength is between 0.1mm-1m (excluding 1m) is divided into microwaves. Microwaves, like ordinary electromagnetic waves, usually exhibit three characteristics: penetration, reflection, and absorption. As shown in Table 2.3, microwave energy can penetrate more and more materials, so that the radar can be covered under the cover of a certain material to avoid damage to the radar in the exposed environment. This advantage makes the radar popular.
Chapter 2. State of the art
8
Table 2.3 - Microwave Penetration of Material
metal Not at all, full reflection
Water Almost not at all, full absorption
Chemical
foams Very well, very little attenuation
Clothing Dry- well
Wet-losses up to 20dB
Rain Well-but up to 6dB attenuation
Plastic Very well – 0.5 to 3 dB loss with optimized thickness and correct
spacing
Human being Not really, but fraction, absorption and reflection
Wood Dry- good
Wet – losses up to 10 dB
Ice Up to 10dB attenuation
2.2.3. Radar Architecture
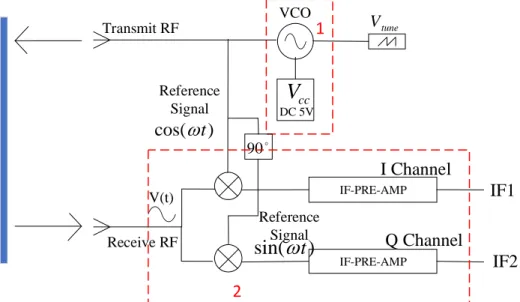
Figure 2.3 shows the Radio Frequency (RF) front end of microwave Doppler receiver [12]. cc
V
DC 5V 90 IF-PRE-AMP IF-PRE-AMP V(t) Transmit RF Receive RF VCO Reference Signal ) cos( t IF1 IF2 Reference Signal)
sin( t
tune V I Channel Q Channel 1 2Fig. 2.3 - Radar Front End Block Diagram
Microwave Doppler radar transmits signal by using the transmitting antenna, the receiving antenna receives reflected signal after signal meets obstacles. The Voltage Controlled Oscillator (VCO) receives modulated signal and outputs signals through the transmitted antenna. After directional coupling, most of the signals are transmitted through the transmitted antenna, another small part is divided into two parts and output to the mixer as the local oscillator signal. The signal of the Q channel needs to be
phase-Chapter 2. State of the art
9 shifted by 90°before mixing. The obtained mixed signal is subjected to filtering and amplifying processing, and finally, two Intermediate Frequency (IF) signals of IF1 and IF2 are obtained. The distance can be calculated according to the IF signal, those are, the beat signals.
Microwave radar signals are usually a function of frequency modulation [13]. The received waveform 𝑟(𝑡) of a single target has the following form,
𝑟(𝑡) = 𝐴(𝑡)𝑠𝑖𝑛[𝛺𝑡 + 𝜃(𝑡)] (2-1)
There, the amplitude 𝐴(𝑡) only represents the envelope of Pulse. The main function of the receiver processing is to transform the part of the radar signal which carried the information to the baseband, at the same time measure phase𝜃(𝑡). Fig. 2.4 shows a conventional method for the classic radar receiver design.
)] ( sin[ t t A
LPF
LPF
)] ( sin[ t A )] ( cos[ t A Figure 2.4 - Receiver Model
In Figure 2.4, the following branch is called the co-channel or I channel of the receiver, in which the received signal and an oscillator signal are mixed. The oscillator frequency is the same as the radar frequency. This mixing produces sum and difference components,
2 𝑠𝑖𝑛(𝛺𝑡) 𝐴(𝑡) 𝑠𝑖𝑛[𝛺𝑡 + 𝜃(𝑡)]
= 𝐴(𝑡) 𝑐𝑜𝑠[𝜃(𝑡)] + 𝐴(𝑡)𝑐𝑜𝑠[2𝛺𝑡 + 𝜃(𝑡)]
(2-2)
The sum frequency component is filtered by the low pass filter, leaving only the modulation component 𝐴(𝑡)𝑐𝑜𝑠[𝜃(𝑡)]. In the Q channel, the received signal is also mixed with the local oscillator signal, but the local oscillator signal before mixing is phase shifted by 90°. The mixing output of the Q channel is,
2 𝑐𝑜𝑠(𝛺𝑡) 𝐴(𝑡) 𝑠𝑖𝑛[𝛺𝑡 + 𝜃(𝑡)]
= 𝐴(𝑡) 𝑠𝑖𝑛[𝜃(𝑡)] + 𝐴(𝑡)𝑠𝑖𝑛[2𝛺𝑡 + 𝜃(𝑡)]
(2-3)
Similarly, only the modulation component 𝐴(𝑡)𝑠𝑖𝑛[𝜃(𝑡)] is left, which is the beat signal.
Chapter 2. State of the art
10
2.2.4. Antenna System
One of the important components of a microwave Doppler radar system is the antenna, which determines the sensitivity and range resolution of the radar. Gain, beamwidth and side-lobe levels are the most important features of the antenna [14].
ɛb
ɛa
x y
z
Figure 2.5 - Detection Range of Microwave Doppler Radar
The characteristic of the antenna system determines the detection range of the microwave Doppler radar. As shown in Figure 2.5, 𝜀𝑎 represents the full beamwidth of the antenna azimuth, 𝜀𝑏 represents the full beamwidth of the antenna elevation. The shaded portion represents the approximate detection range of the radar. Different types of radar will have different parameters of 𝜀𝑎 and 𝜀𝑏.
2.3 Physical Basics- Radar Equation
The radar equation is used to analyze the composition of the beat signal and provides the theoretical basis for the following chapter simulation.
2.3.1. Reflection
One of the characteristics of microwaves is that the wavelength is shorter (that is, 12 mm or 4.7 inches at 24 GHz), which is similar to light and has effects such as scattering, diffraction, reflection, divergence, and interference. Therefore, the microwave Doppler radar emits electromagnetic waves in a scattered manner, and at least a part of its energy is reflected to the point of emission.
Chapter 2. State of the art
11 The "radar equation" represents the strength of the radar received signal after being reflected by the object. Its mathematical description is as follows,
𝑃𝐸 𝑃𝑆
= 𝑔
2∙ 𝜆2∙ 𝜎
(4𝜋)2∙ 𝐷4 (2.2)
There, 𝑃𝐸 is the received signal power, 𝑃𝑆 is the transmitted power, 𝜆 is the wavelength of transmitted signal (12mm at 24GHz), 𝐷 is the range between microwave Doppler radar sensor and the object.
From the above equation, it can be seen easily that the received signal power has the following phenomenon,
(1) Reverse proportional to the 4.power of the range;
(2) Directly proportional to the Radar Cross Section (RCS) of an object.
2.3.2. Radar Cross Section
Under radar wave radiation, the physical quantity of the target echo intensity is represented by RCS. It is the imaginary area of the target, represented by the projected area of the equivalent reflector which each direction is uniform. The equivalent reflector has the same echo power at the unit stereo angle of received direction with a defined target. In fact, the RCS of the same target is different because the different viewing angles of the target have different radar reflection frequencies.
The approximate RCS of an object at the frequency of 24GHz for [15],
Table 2.4 - Approximate RCS for an Object
An Object RCS
A Human Being Abt. 0.5 m2
A Coke Can 0.5 m2
An Automobile Depending on Angle of Arrival 1-5 m2
A Metal Sheet of 1 m2 A few 100 m2
Chapter 2. State of the art
12
2.4 Frequency Modulation
The radar can be divided into two types: Continuous Wave (CW) radar and pulse radar, according to the electromagnetic energy radiation characteristics. The principle of ranging of pulse radar is to obtain the distance information of the target based on the time difference between the transmitted and received pulse signals. The CW radar is a radar system that obtains target information based on transmitted and received CW signals. According to the different forms of radar transmission, CW radar can be divided into non-FMCW wave radar and FMCW radar. The former can measure the velocity of targets within a certain range, but can’t obtain the range information. FMCW radar can get both range and velocity information at the same time.
2.4.1. Pulse Radar
The pulse radar is a solution that measures only the range of the target. The waveform generator generates a short-time pulse to modulate the radar waveform. The delay is measured by the time difference of transmitting pulse and receiving pulse, as shown in Fig. 2.6. f0 f t delay time Transmit Pulse Receive Pulse
Figure 2.6 - Principle of Pulse Radar
However, since the pulse frequency modulation method can only measure the range of targets, the velocity can only be roughly calculated from the 𝑑𝑠/𝑑𝑡. Therefore in the expectation of obtaining accurate range and velocity information, other solutions need to be considered.
Chapter 2. State of the art
13
2.4.2. Continuous Wave Doppler Radar
The principle of CW radar is based on the Doppler effect. The difference frequency can be extracted, which is the Doppler frequency [16]. In simple terms, the Doppler effect is the change in the frequency or wavelength of a wave as it moves relative to the wave source. The most common example of the Doppler effect is when the whistling train passes by a standing observer, the tones that the observer hears are different during the process of approaching and moving away from the train. Compared to the transmitted frequency of the wave source, the received frequency is higher during the approach, and lower during the recession. That’s because as the source of the wave moves toward the static target, each successive peak is transmitted from a position closer to the observer than the peak of the previous wave. Therefore, compared with the previous wave, it costs less time for each wave reaches to the target, and this phenomenon will increase the frequency received. Conversely, if the wave source is far from the static target, each wave is emitted from a position farther away from the target than the previous wave, so the arrival time between successive waves increases, thereby reducing the frequency.
As shown in Figure 2.7, when the AGV is far from the radar, the frequency observed by the AGV becomes larger than the actual radar's transmission frequency; when the AGV is close to the radar, the frequency observed by the AGV becomes relatively smaller.
v₀
v₀
Figure 2.7- Doppler Effect diagram
The frequency relationship between the observer and the source is given by the following relation,
𝑓′ = (𝑣 ± 𝑣0
Chapter 2. State of the art
14
It means, 𝑓′ is the observed frequency, 𝑓is the original transmission frequency
from the medium. 𝑣is the original transmission velocity of the wave in the medium,
𝑣0 is the moving speed of the observer relative to the medium. If it is close to the emission source, the front operation symbol is +, otherwise, it is -. 𝑣𝑠 is the source relative to the medium. If the emission source is close to the observer, the front operation symbol is -, otherwise it is +.
In the case where the radar stationary relative to the AGV, the derived process of velocity is shown as follows:
Suppose the target is away from the radar which the initial distance is 𝑅0 at a radial velocity 𝑣0 (𝑣0 > 0), then,
R = 𝑅0+ 𝑣0𝑡 (2.4)
v₀
Observer
Source
Figure 2.8 - The Radar Transmits Waves and Meets Target
When the radar transmits electromagnetic waves to the target, as shown in Fig. 2.8, the radar is the source of the microwaves, therefore the target is the observer.
𝑓1 =
𝑐 − 𝑣0
𝑐 𝑓 (2.5)
Here, c is the speed of light, 𝑓1 is the frequency observed by the target, and 𝑓 is the transmission frequency of the radar.
v₀
Observer
Source
Figure 2.9 - The Microwave back to Radar form Target
When electromagnetic waves are reflected from the target to the radar, like Fig. 2.9, then,
𝑓2 = 𝑐
𝑐 + 𝑣0𝑓1 (2.6)
Combined with formula (2.5), then,
𝑓2 = 𝑓 −2𝑣0∙ 𝑓
𝑐 + 𝑣0 (2.7)
Chapter 2. State of the art
15 𝑓2 = 𝑓 −
2𝑣0∙ 𝑓
𝑐 (2.8)
So the resulting Doppler shift 𝑓𝑑𝑜𝑝𝑝𝑙𝑒𝑟 can be expressed as, 𝑓𝑑𝑜𝑝𝑝𝑙𝑒𝑟 = −2 ∙ 𝑣0
𝑐 ∙ 𝑓 (2.9)
Therefore, the CW radar can only detect the radial velocity of the target based on the detected Doppler shift, which is not suitable for use in the positioning system.
2.4.3. Frequency Modulated Continuous Wave Radar
FMCW radar is mainly used for ranging and velocity measurement, such as radar altimeter, car collision avoidance and so on. The FMCW radar, which modulates the transmission frequency to obtain the target range and velocity information, has a development history almost as long as the history of the radar itself.
Since the 1980s, the research work of radar systems has received extensive attention. Due to the continuous improvement of related technology and theory, radar has been rapidly developed, and its application fields have been extended to military and civilian such as missile guidance, object imaging, and meteorological observation. L.P.Lighthart et al. [17] analyzed the theory of linear radar. At the same time, RB Chadwick et al. [18] researched problems such as distance crosstalk caused by the coupling of side-lobe, velocity, and distance in linear radar. P.Jones and S.Osterrieder et al. [19] used linear radar to explore the display problem of dynamic targets; W.Knapp and L.P.Lighthart [20] performed suppression research of near-field clutter.
The working principle of the FMCW system radar is to modulate and transmit the carrier frequency signal. Then the beat signal contained with range and velocity information is received through by RF end. Frequency analysis is used for the beat signal can calculate range and velocity values. Frequency modulation commonly has triangle wave modulation, sawtooth wave modulation, and sine wave modulation. The purpose of frequency modulation is change range and velocity information of target to frequency or phase shift, which is more convenient to process.
At present, FMCW radar has been widely used in various fields, such as industrial measurement, military navigation, and security system. Compared with traditional radar systems, the advantages of FMCW radar are mainly shown as follows,
Chapter 2. State of the art
16
(1) The sensitivity of the FMCW radar receiver is much higher than the traditional radar with the same bandwidth. Therefore, FMCW radar has a higher range resolution and better anti-interference ability in engineering applications.
(2) The bandwidth of the beat signal (the unit is generally KHz) is much smaller than the bandwidth of the transmitted signal (the unit is generally GHz). The radar is receiving signal while transmitting signal, therefore, there is no blind area of FMCW radar.
(3) The beat signal of FMCW radar is mainly processed by FFT which is relatively easy and simple.
(4) The operating current of the FMCW radar system is relatively small, the whole system is small in size, light in weight and simple in structure.
f₀ t f f up1 f doppl er f dow n2 f up2 f dow n1 t f fup1 fdown1 fup2 fdown2 Moving Target Static Target
Figure 2.10 - Principle of Triangle Wave Modulation of FMCW Radar
The principle of triangle wave modulation is as Fig. 2.10. For a static target, the source of the beat signal is only based on the time delay between the transmitted signal and the received signal, so the frequency of the difference signal generated in the rising edge and in the falling edge of the triangular wave are equal. For moving targets, the Doppler Effect also produces a frequency shift in the received signal, therefore,
𝑓𝑢𝑝2 = 𝑓𝑢𝑝1 − 𝑓𝑑𝑜𝑝𝑝𝑙𝑒𝑟 (2.10)
Chapter 2. State of the art
17 In practical applications, it is very difficult to accurately distinguish 𝑓𝑑𝑜𝑤𝑛 and 𝑓𝑢𝑝. Although the transmitted signal can be modulated by triangle wave together with CW, the extremely high requirements for the hardware would cause the price very high [21].
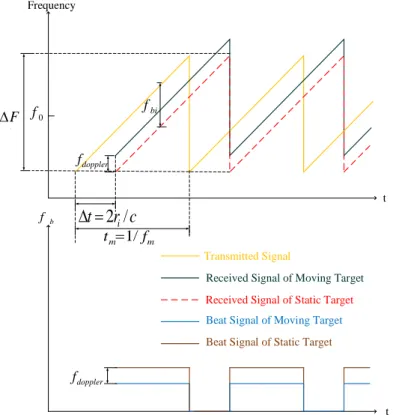
Another solution is using the sawtooth wave to modulate the transmitted signal. The principle of sawtooth wave modulation of FMCW radar as shown in Fig. 2.11.
Frequency
t
t Transmitted Signal
Received Signal of Moving Target
Received Signal of Static Target
Beat Signal of Moving Target
Beat Signal of Static Target
c r t2i/ bi f m m f t 1/ 0 f b f F -doppler f doppler f
Figure 2.11- Principle of Sawtooth Wave Modulation of FMCW Radar
Assume a static configuration between radar and the object, in other words, there are static radar and static target. The period of the sawtooth wave is 𝑡𝑚 = 1/𝑓𝑚. The bandwidth ∆𝐹 depends on the voltage of the modulated signal and centers on transmitted frequency 𝑓0. In this case, radar sends a bunch modulated wave to target i, and accept echo from 𝑖.
Range 𝑟𝑖 can be expressed as time delay ∆𝑡 between the transmitted signal and the received signal, that is,
∆t = 2𝑟𝑖/𝑐 (2-12)
Under the situation of static radar and moving targets, the Intermediate Frequency (IF) is different from the static configuration because of the Doppler shift. The Doppler shift can be calculated from the phase contained in the signal. Detailed calculation process in Chapter 5.
Chapter 2. State of the art
18
2.5 Wavelet Denoising
In general, the range and velocity information of the target is extracted by measure the frequency of the IF signal. The IF signal is inevitably affected by various noises during the propagation process, which will cause interference and affect the accuracy of the ranging result, to the IF signal [22]. Hence it is necessary to analyze and filter noise contained in the IF signal. In practical applications, the signal spectrum and noise spectrum of the IF signal are arbitrarily overlapping, however, the traditional filtering method cannot achieve the ideal denoising effect [23].
Wavelet denoising has good characteristics of time domain, frequency domain localization and multi-resolution analysis, which is suitable for the dynamic, non-stationary and abrupt signal. Wavelet denoising has wide applications such as image processing [24-25] and ECG signal [26-27].
Donoho et al. [28] discussed and found a method to remove white noise by using wavelet in 1900. The wavelet transform uses a function with fast decay and oscillation - mother wavelet. Stretching and translating the mother wavelet to get wavelet basis functions. The basic idea of the wavelet transform is to use wavelet basis functions to represent or approximate a function or signal. Wavelet transform is suitable for analyzing the abrupt signal and non-stationary signal. In addition, the wavelet transform has the characteristics of multi-resolution analysis and a bandpass filter and can be implemented by a fast algorithm, so it is often used for filtering and denoising.
There’s a lot of related work related to using wavelet transform for denoising. SR Messer [29] proved that wavelet denoising can be used to remove white noise in heart sounds. Giaouris, D. et al. [30] used the wavelet transform to distinguish noise in the actual current signal and modulate motor speed. Yi Hu et.al [31] proposed the use of low-variance spectral estimators based on wavelet thresholding the multiple spectra for speech enhancement to suppress “musical noise”. Debin et al. [32] identified weak characteristic signals in the gearbox vibration signals by using a local adaptive algorithm based on wavelet. Madhur Srivastava et al. [33] proposed a new threshold formula to denoise 1-D experimental signals, which can increase the SNR by more than 32dB without distorting the signal. CUI Hua et al. [34] posed a new threshold function, simulation experimental results indicated that the new method gave better SNR gains than hard and soft thresholding methods.
Chapter 3. System Description
19
Chapter 3. System Description
3.1 Hardware Platform
The used microwaves Doppler radars are expressed as microwave FMCW Doppler radar sensor IVS-162 and microwave Doppler radar Nano SP25. The radars are mounted in order to detect AGV position and AGV velocity where AGV materialize the target.
Then based on the range and velocity of the target (AGV), designing a suitable positioning method, it is a complete technical chain. The function of IVS-162 is used for parameter adjustment, technical preparation, and experimental support. The SP25 can provide range and velocity information directly in the form of a message, which is easy to be used to validate the hardware system based on IVS-162.
3.1.1. Microwave Radar Sensor IVS-162
The IVS-162, as shown in Fig. 3.1, is the 24GHz K-Band VCO radar transceiver from Innosent. Because of the structure of the planar microstrip antenna, the IVS-162 microwave radar sensor is very compact and energy-saving during operation.
Figure 3.1- Microwave Radar Sensor IVS-162
The functions of the IVS-162 are diverse, including the measurement movement, velocity, presence, and distance of targets. The IVS-162 radar sensor is especially suitable for target information detection, and its antenna angle and beam coverage are wide. Therefore, its application field mainly involves automatic control, electronic security, and many other fields.
The IVS-162 is very easy to integrate with the user's back-end design, with good compatibility. The specific characteristics are as follows:
Chapter 3. System Description
20
(2) FMCW/CW/FSK capable; therefore measurement of distance as well as recognition of stationary objects possible (depending on modulation)
(3) Split transmit and receive path for maximum gain
(4) Stereo ( dual channel) operation for direction of motion indirection (5) IF-pre-amplifier, bandwidth limited for lowest noise performance
Fig. 3.2 shows the antenna orientation and the relationship between output and angle of the IVS-162. The actual antenna system pattern of IVS-162 as shown in Table 3.1.
Figure 3.2 - Antenna Direction and Output Power of IVS-162
Table 3.1- Antenna System Pattern
Parameter Symbol TYP Units
Full beam width @-3dB horizontal 45 ° vertical 38 ° Side-lobe suppression horizontal 15 dB vertical 20 dB
The data sheet of IVS-162 as shown in Table 3.2, each pin in Fig. 3.1 is connected according to the data sheet.
Chapter 3. System Description
21 Table 3.2 - Data Sheet of IVS-162
PARAMETER CONDITIONS SYMBOL MIN TYP MAX UNITS
Transmitter Transmit frequencies Depending on 𝑉𝑡𝑢𝑛𝑒 𝑓 24.000-24.250 GHz Freq @𝑉𝑡𝑢𝑛𝑒 5.0V @25℃ 𝑓5.0𝑉 24.100 24.125 24.150 GHz Varactor tuning voltage 𝑉𝑡𝑢𝑛𝑒 0.5 10 V Modulation input 150 kHz Power supply supply voltage 𝑉𝑐𝑐 4.75 5.00 5.25 V
supply current IF-amp
included 𝐼𝑐𝑐 35 50 mA Environment operating temperature 𝑇𝑜𝑝 -20 +60 ℃ Mechanical Outlines outline dimensions compare drawing height length width 8.3 (19) 44.0 30.0 mm
And the function of each pin is described in Table 3.3, Table 3.3- PINs of IVS-162
PIN NAME Input/ Output INSTRUCTIONS
1 𝑉𝑡𝑢𝑛𝑒 Input Varactor tuning voltage (0.5-10V)
2 enable Input Active low
3 𝑉𝑐𝑐 Input Supply voltage (+5V)
4 GND Input Analog ground
5 IF1 Output Signal I
6 IF2 Output Signal Q
7 GND Input Analog ground
Chapter 3. System Description
22
3.1.2. Microwave Radar System Nano SP25
The microwave radar system SP25, shown in Fig. 3.3, is a K-Band radar operating in the 24GHz-ISM band as same as the IVS-162, and it can also accurately detect the distance and speed of target at the same time. However, it was chosen because its horizontal detection angle met the positioning needs, as shown in Table 3.4.
Figure 3.3 - SP25
Because its full beamwidth of antenna azimuth is wider, SP25 can be applied for electronic security, AGV automatic collision avoidance system and so on. Similar to the principle of electronic security, that is, be aware of the direction and position of the target in time, the sp25 is suitable for positioning system for AGV in the port.
Table 3.4 - Radar Parameters of SP25
Range and Velocity Detection
Refresh Rate (Hz) 50 Range (m) 30 Distance Accuracy (m) 0.1 Speed Range (m/s) ±70 Speed Accuracy (m/s) 1.2 Range Resolution (m) 0.75 Speed Resolution (m/s) 2.4 Antenna characteristics
Full beam width @-3dB
Horizontal 100 Vertical 38
Chapter 3. System Description
23 The SP25 radar sensor uses a UART-TTL interface, the definition of each PIN is shown in Table 3.5. With a default transfer rate of 115200 baud, with each data message has a start sequence (0xAAAA) and a termination sequence (0x5555), the system status and target output status message of SP25 will be output. If the target is detected, the target number of the target output status message is 1 and the output target status message will be followed by the output target information. The target information message contains parameters such as the distance and speed of the target. In addition, LabVIEW configures the SP25 at the same message format.
Table 3.5- PIN Interface Definition of SP25
PIN Definition Range
1 POWER IN 4~6V DC 2 \ \ 3 GND \ 4 \ \ 5 TTL USART_RX 0~3.3V DC 6 TTL USART_TX 0~3.3V DC 7 \ \ 8 \ \ 9 \ \ 10 \ \
The complete data of UART-TTL communication has 14 bytes, each byte of data is unsigned8-bit, the data range is 0~255 (0~0xFF) and the format as shown in Table 3.6. Each data message contains a message ID to distinguish different types of messages.
Chapter 3. System Description
24
Table 3.6 -Target Information Byte\Bi
t 7 6 5 4 3 2 1 0
0
Start Sequence (2×Uint8) 1
2
Message ID (2×Uint8) 3
4
Data Payload (8×Uint8) 5 6 7 8 9 10 11 12
End Sequence (2×Uint8) 13
The format of the SP25 Target Output Information Message is shown in Table 3.7. The starting sequence (0xAAAA) and the termination sequence (0x5555) have been omitted from the table. When the radar sensor works normally and the target is detected, the System Status Message is the first output, then the Target Output Status Message is outputted. Finally, the Target Output Information Message is outputted.
Chapter 3. System Description
25 Table 3.7- The Format of SP25 Target Output Information message
Message ID 0x70C
Signal Name Bit Resolution Interval Type Comment
Index 0..7 1 0…255 u8 Target ID
RCS 8..15 1 0…255 u8 RCS
RangeH 16..23 1m 0…255 u8 Target Distance High 8 Bits RangeL 24..31 1m 0…255 u8 Target Distance Low 8 Bits
Rsvdl 32..39 - - u8 -
VrelH 40..42 1m/s 0..7 u3 Target Velocity High 3 Bits
Rsvsl 43..45 1 1 u3 -
RollCount 46..47 1 - u2 SP25 is fixed to 0
VrelL 48..55 1m/s 0..255 u3 Target Velocity Low 8 Bits
SNR 56..63 1m/s 0..255 u3 SNR
The value of each field is not the true value of the target information, and the true value of the target information is calculated by the following relationship:
-Indxe = IndexValue //
Target ID, according to Track information
-RCS = RcsValue*0.5-50 //
Factory test reserved value, no output
-Range = (RangeHValue*256+RangeLValue)*0.01 // m
-RollCount = RollCountValue // Count bit
-Verl = (VerlHValue*256+VerlValue)*0.05-35 // Target Speed (m/s)
-SNR = Value-127 //
Factory test reserved value, no output
Chapter 3. System Description
26
3.1.3. NI myRIO-1900
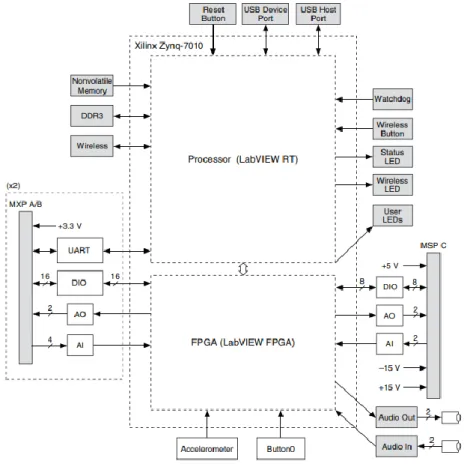
NI myRIO-1900, as shown in Fig. 3.4, is an embedded system development platform with the functions of real-time processing of the data and Wi-Fi communication capabilities, which is produced by National Instruments (NI). The myRIO-1900 has 34 pins in total, each having different functionality. At the same time, the myRIO-1900 has two ports named port A and port B that can process different tasks respectively. MyRIO-1900 also has four onboard LED’s. At the bottom side of the myRIO-MyRIO-1900, there is a power pin, PC connection point, and USB port. A Xilinx Zynq chip is embedded in NI myRIO-1900, which can use the real-time performance of the dual-core ARM Cortex-A9 and customizable I/O with Xilinx FPGAs. The hardware block diagram of NI myRIO-1900 is shown in Fig. 3.5.
Figure 3.4- NI myRIO-1900 Guide Diagram
One of the advantages of myRIO is that its FPGA supports the development and design of real systems to solve problems faster. Compared to other microcontrollers, with FPGA support, myRIO-1900 avoids the complex syntax used in C and many other languages. Because the using process of myRIO-1900 only creates programming logic, so the complexity can be reduced when designing complex systems. The myRIO-1900 is much faster than a standard microcontroller, so it can be easily used in efficient systems that require fast output response. It also supports different languages such as C, C++, or Graphical Language (FPGA).
For many embedded applications, it is also desirable to view the current operating state of the embedded system or perform parameter and data interaction through the upper computer. NI myRIO-1900 can be connected to the upper computer through Wi-Fi. The upper computer program can be written in the same LabVIEW project, and the data can be interacted in the upper computer and NI myRIO-1900 by sharing network
Chapter 3. System Description
27 variables or TCP/IP. In this way, the system can be developed entirely under the same software environment LabVIEW.
Figure 3.5- NI myRIO-1900 Hardware Block Diagram
3.2 Wireless Communication Protocols- Wi-Fi
As mentioned earlier, the NI myRIO-1900 comes with a built-in Wi-Fi shield. For projects that require a quick connection between the device and the Internet, Wi-Fi is the ideal protocol. Therefore, NI myRIO is chosen in this project because of embedded in Wi-Fi which can be used for fast data transfer and has the ability to process large amounts of data. The main features of Wi-Fi are shown in Table 3.8. In principle, Wi-Fi is a Wireless Local Area Network (WLAN) technology created in the IEEE 802.11 standard. Wi-Fi essentially uses an infrastructure network that also supports ad hoc networks in infrastructure mode [35]. The range of Fi depends on the version of Wi-Fi, it is larger in open spaces than in rooms with walls or other interfering objects [36]. For example, IEEE 802.11a has a range of 120 meters, while IEEE 802.11b has a range of up to 300 meters. The advantages and disadvantages of the Wi-Fi protocol are described in Table 3.9.
Chapter 3. System Description
28
Table 3.8- Main Features of Wi-Fi
Feature Wi-Fi
IEEE standard IEEE 802.11
Max Signal Rate 54 Mbps
Frequency 2.4 GHz;
5 GHz
Range 250 m
Nodes Unlimited (ad hoc); 2007 (infrastructure) Typical Power Consumption 100 - 350 mA
Complexity High
Table 3.9- Advantages and Disadvantages of the Wi-Fi Protocol
Advantages Disadvantages
- Decent coverage and outreach and can penetrate walls and other obstacles on the way
- Adding or removing devices from a Wi-Fi network is a simple process
- High energy consumption
- Radio waves in the network may interfere with other equipment
3.3 Implementation of Hardware Platform
At first, the implement of the hardware platform is based on IVS-162. The main equipment of the hardware platform is shown in Fig. 3.6.
Transmitted Signal Received Signal 5V Power Beat Signal Wi-Fi ADC PC
Figure 3.6- Equipment of Hardware Platform
In this case, NI myRIO-1900 supplies electricity to microwave Doppler radar sensor IVS-162 and has the function of ADC. To sample the IF signal of IVS-162 and transmit
Chapter 3. System Description
29 it to PC, it is important to configure parameters of the radar sensor by using NI myRIO-1900.
3.3.1 Data Acquisition
The acquisition of the IF signal is the first step of signal processing. It refers to converting the analog IF signal output from the IVS-162 radar sensor into the digital signal. The signal acquisition has a basic parameter - the sampling frequency.
In theory, the higher the sampling frequency, the more accurately the acquired digital signal recovers its analog signal. However, too high sampling frequency has two disadvantages, one is subject to the limitations of the actual ADC device. Second, the larger the amount of data sampled in a certain period of time, the higher the requirements for the storage and processing of the digital signal processor. According to the Nyquist sampling theorem, when the sampling frequency is greater than twice the highest frequency of the signal, the digital signal obtained can completely recover its analog signal. Therefore, considering some non-ideal characteristics of the actual system, engineering applications generally select the sampling frequency to be 3-5 times the highest frequency of the signal [37].
Since the positioning system requires a fast response time to the target, the data acquisition and data analysis time of the radar is also needed to be fast, so it is necessary to use high-speed data acquisition and high-speed data processing for the beat signal. The block diagram of the data acquisition system is shown in Fig. 3.7.
ADC Caching Proc
es sor or DS P Control Module External Clock Beat Signal Analog Signal Sampling Data Sampling Control Read-Write Control
Chapter 3. System Description
30
3.3.2 Generation of Sawtooth Wave Signal
The sawtooth wave generator that used in this project is the DDS Function Signal Generator as shown in Fig. 3.8. The specifications of the DDS Function Signal Generator is shown in follows,
Table 3.10- Specifications of DDS Function Signal Generator
Specifications of DDS Function Signal Generator:
Lightweight and compact, it can reduce the size and weight of the positioning system;
Use the 1602 LCD menu to easily view the set parameters;
Intuitive keyboard, the power automatically restore the last used configuration; Signal amplitude of the offset amount can be adjusted separately by two potentiometers;
Can achieve sawtooth wave, triangle wave, sine wave and so on easily, and frequency range is between 1Hz to 65534Hz;
Operating voltage is only DC 9V.
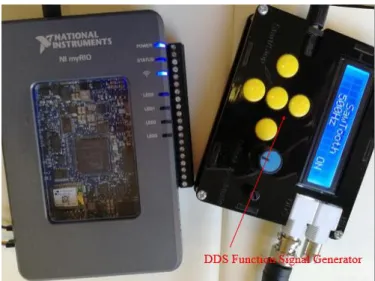
There, NI myRIO-1900, as shown in Fig. 3.8, is only used to adjust the voltage of the signal generator. The test result is shown in Fig. 3.9.
Chapter 3. System Description
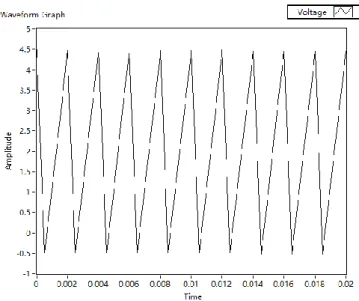
31 Figure 3.9- Result of Sawtooth Wave with 5V and 500Hz
Form Figure 3.9, it can be observed that the DDS Function Signal Generator can generate stability sawtooth wave with 5V voltage and a period of 500Hz.
3.3.3 The Connection Method of SP25
Since the SP25 requires TTL to USB serial port adapted to read the message generated by SP25, the TX and RX pins of myRIO-1900 are selected to be cross-connected with the TX and RX pins of SP25, as shown in Fig. 3.10.
Figure 3.10- Connection of SP25 ports
The power of the SP25 is also supported by NI myRIO. If all the configuration is successful, the message can be read by the PC.
Chapter 3. System Description
32
3.4 Developed Software
3.4.1 Description of LabVIEW software
LabVIEW is a program development environment from National Instruments (NI). The most important reason for its widespread use is that it uses a graphical editing language ‘G’ to write programs, and the resulting programs are in the form of block diagrams. LabVIEW uses data flow programming. The data flow between nodes in the block diagram determines the execution order of VIs and functions. VI refers to a virtual instrument and is a program module of LabVIEW.
LabVIEW software is at the heart of the NI design platform and is ideal for developing measurement or control systems. Like C and BASIC, LabVIEW has a large database that can perform any programming task, including data acquisition, GPIB, serial port control, data analysis, data display, and data storage. In addition, LabVIEW also has traditional program debugging tools, such as displaying the results of data and its subroutines (subVI) in an animated form, setting breakpoints, single-stepping, etc., to facilitate program debugging.
LabVIEW controls have many panels like traditional instruments (such as oscilloscopes, multimeters) that can be used to create highly visualized user interfaces. The user interface is referred to as the 'front panel'. Users can use icons and wires to control the controls on the front panel as needed. This is the graphics source code - the 'G' code. Also known as block diagram code.
3.4.2 NI myRIO-1900 Required Software
There are several additional software required for NI myRIO-1900 as shown in Table 3.11. The NI MAX can be used to configure the network and operating status of my RIO. LabVIEW Development System, Real-Time Module and myRIO Toolkit are necessary modules for creating myRIO Project. The project needs to call the script of ‘m’ file written by MATLAB in LabVIEW, so MathScript RT was installed. Similarly, if the user doesn’t need to call the MATLAB script in myRIO Project, it is not necessary to download MathScript RT.
Chapter 3. System Description
33 Table 3.11- Required Software of myRIO-1900
Sr. No Software
1 NI MAX
2 LabVIEW Development System
3 LabVIEW Real-Time Module
4 LabVIEW myRIO Toolkit
5 MathScript RT
3.4.3 MATLAB software
MATLAB (from MathWorks) is an advanced technical computing language and interactive environment for algorithm development, data visualization, data analysis, and numerical computing.
The reason why this thesis selected MATLAB for signal noise was that it has an appropriate wavelet processing library and the algorithm used has undergone various optimization and fault-tolerant processing. Normally, the user can use it instead of the underlying programming language. With the same computational requirements, the amount of work required to program with MATLAB is greatly reduced.
In this project, MATLAB is used to implement some more complex algorithms, and it is embedded in LabVIEW software using MATLAB script functionalities.
Chapter 4. Beat Signal of Microwave Radar Sensor Denoising
34
Chapter 4. Beat Signal of Microwave Radar
Sensor Denoising
4.1 Noise Sources
The echo of the target is always in a certain clutter, and the task of the target detection is to extract the target signal from the clutter. In order to improve the detection capability of the target, the necessary clutter processing should be performed before the target detection. The task of clutter processing is to reduce the clutter power, improve the SNR and find the probability of the target as high as possible.
4.1.1 SNR
The SNR is the ratio of signal (meaningful information) to noise (unwanted signal) in an electronic device or electronic system. The signal refers to the electronic signal that needs to be processed outside the device. The noise is the irregular extra signal (or information) that does not exist in the original signal, and the noise does not change as original signal changes [38].
The SNR is expressed as the ratio of the average power of the signal to the average power of the noise, that is,
SNR =𝑃𝑠𝑖𝑔𝑛𝑎𝑙
𝑃𝑛𝑜𝑖𝑠𝑒 (4-1)
If the signal and noise are measured at the same impedance, the SNR can be obtained by calculating the square of the amplitude ratio,
SNR = (𝐴𝑠𝑖𝑔𝑛𝑎𝑙 𝐴𝑛𝑜𝑖𝑠𝑒)
2
(4-2) Where A is the Root Mean Square (RMS) amplitude, for example, RMS voltage. The signals are often expressed using the logarithmic decibel scale. Based upon the definition of decibel, signal and noise may be expressed in decibels (dB) as,
𝑃𝑠𝑖𝑔𝑛𝑎𝑙,𝑑𝐵 = 10 log10(𝑃𝑠𝑖𝑔𝑛𝑎𝑙) (4-3)