Procedia - Social and Behavioral Sciences 181 ( 2015 ) 414 – 422
1877-0428 © 2015 The Authors. Published by Elsevier Ltd. This is an open access article under the CC BY-NC-ND license (http://creativecommons.org/licenses/by-nc-nd/4.0/).
Peer-review under responsibility of Uluslararası Stratejik Yönetim veYöneticiler Derneg˘i (usyyd) (International Strategic Management and Managers Association).
doi: 10.1016/j.sbspro.2015.04.904
ScienceDirect
3
rdInternational Conference on Leadership, Technology and Innovation Management
Assessing Obstetrics Perceived Service Quality at a Public Hospital
Ana Lúcia Martins
a, José Crespo de Carvalho
a, Tânia Ramos
a,
Joana Fael
ba Business Research Unit, ISCTE-IUL University Institute of Lisbon, Av Forças Armadas, 1642-026 Lisbon, Portugal b ISCTE-IUL University Institute of Lisbon, Av Forças Armadas, 1642-026 Lisbon, Portugal
Abstract
Assessing service quality has become a major issue in the healthcare sector. Although direct evaluation has already taken place, literature is scarce in terms of the impact the distance covered by the user has on perceived service quality. The aim of this study was to assess the influence distance has on perceived service quality when no similar service alternatives are available. The Servperf instrument was used to collect data. All women who delivered babies in autumn 2011 were respondents to the questionnaire. Exploratory analysis was used to test research hypotheses. Cronbach’s alphas were computed to assess internal consistency. Findings show that Assurance is the quality dimension that contributes the most to patients’ perceived service quality and Tangibles is the one that contributes the least. It was also possible to conclude that the distance the patient has to cover to be served and its educational level influence patients’ perception of the service provided.
Keywords: Perceived quality assessment, Servperf, Public Service, case study
© 2013 Published by Elsevier Ltd. Selection and/or peer-review under responsibility of 3rd International Conference
on Leadership, Technology and Innovation Management
1. Introduction
The services sector is becoming more and more relevant in the world economy. According to the European Commission (2012), services represented 73,2% of the Gross Internal Product in the European Union in 2012. The link between service quality and customer satisfaction has been established long ago (see, for instance, Cronin and Taylor, 1992). Service quality has proved to be a means to achieve sustainable competitive advantage (Clow and Vorhies, 1993), which is a strong element in competitive environments.
Public services, however, often provide services in no competition arenas. This could lead to less concern in terms of the quality of the service provided and a focus on simply making the service available to the population. Nonetheless, public services, although initially focused on providing mass services at low cost, are becoming more
Corresponding author. Tel. +351-21-790-34-17 fax. +351-21-796-47-10 E-mail address: [email protected]
© 2015 The Authors. Published by Elsevier Ltd. This is an open access article under the CC BY-NC-ND license (http://creativecommons.org/licenses/by-nc-nd/4.0/).
Peer-review under responsibility of Uluslararası Stratejik Yönetim veYöneticiler Derneg˘i (usyyd) (International Strategic Management and Managers Association).
aware of the quality of the service provided and quality measurement and improvement in this sector is increasing (Paquette, Bellavance, Cordeau and Laporte, 2011).
As a consequence of this increasing awareness, many studies of customer satisfaction measurement have been undertaken in the public area, focusing on services such as overall municipality services (Gumus and Koleoglu, 2002), e-services (Buckley, 2003), airline transportation (Chau and Kao, 2009), dial-a-ride services (Paquette, Bellavance, Cordeau and Laporte, 2011), bus transportation (Bilisik, Edogan, Kaya and Baracli, 2013), public hospitals (Zarei, Arab, Froushani, Rashidian and Tabatabaei, 2012), just to identify a few. These studies are mainly based on existing measurement scales and barely evolve beyond the traditional quality dimensions proposed by Parasuraman, Zeithaml and Berry (1988). An issue such as distance from the location where the service is provided is scarcely analyzed in literature.
The purpose of this research is to evaluate patients’ perceived service quality in a public hospital, specifically in its obstetrics department, and analyze if the distance the patients have to cover to give birth influence their perception of the service quality that is provided at that hospital. In order to avoid influences such as the possibility to choose another location to give birth, and therefore avoid biased answers, a hospital located at an isolated area was chosen, in which there is no other similar facilities available in the area.
There are several tools available to evaluate perceived quality and all of them face some type of critiques. For the purpose of this research, and taking into account Croning and Taylor’s (1994) input, the Servperf scale was used as a starting point. From this point distance from the living location to the hospital facilities is assessed as a possible influence on perceived service quality. In this context, the research starts with a literature review on how service quality assessment is provided as a basis to develop the research model and the hypotheses; secondly, the methodological guidelines will be shown and justified; thirdly, the discussion of the results will be produced; finally, the conclusions concerning the hypotheses will be summarized and recommendations will be produced to improve customers’ perceived quality at the analyzed service. Limitations on the findings will be highlighted.
2. Literature Review, Hypotheses and Model 2.1. Service Quality Measurement Instruments
With links established in literature between customer satisfaction and corporate profitability (Anderson, Fornell and Lehmann, 1994) and customer satisfaction and purchase intentions (Cronin and Taylor, 1992), research has been fruitful in defining customer service evaluation models. Although there are different scales to measure customer satisfaction in specific services area, the commonly used background, from which many adjusted solutions have emerged, is Parasuraman, Zeithaml and Berry’s (1988) scale, based on Parasuraman, Zeithaml and Berry (1985) gap theory. Nonetheless, many conceptual and operational critiques to this scale can be identified.
Cronin and Taylor (1992) and Carman (1990) argue that the gap theory has little support for measuring service quality. Buttle (1996) posits that there is little evidence that in fact customers evaluate service quality in terms of the difference between perceived quality and previous expectations and is supported in his argument both by Carman (1990) and Cronin and Taylor (1992). Another theoretical critique to SERVQUAL is that this scale is focused on the process of service delivery, instead on the outcomes of the service encounter (Buttle, 1996; Gronroos, 1988). Johnston, Clark and Shulver (2012) argue that the service process is influenced by the customer and that the result of the service encounter encloses not only the experience but also the outcomes of the process, which are different from customer to customer. Therefore Johnston, Clark and Shulver (2012) provide support to Cronin and Taylor’s (1992) critique that perceived quality is best conceptualized as an attitude than as an outcome. Therefore, the gap theory would fall short on analyzing the quality of the service provided.
The critique concerning the appropriateness of Parasuraman, Zeithaml and Berry’s (1988) proposed dimensions to evaluate each service has also been produced (Buttle, 1996; Cronin and Taylor, 1992; Carman, 1990). Nonetheless, Parasuraman, Berry and Zeithaml (1993) identify the five proposed dimensions as the ones appropriate to general services, not exactly to each specific and individual service in every location and/or culture.
In terms of its operational aspects, Servqual has also been the target of several critiques. The expectations analysis has been criticized as it may have many different interpretations from the respondent (Buttle, 1996), therefore making it difficult to compare responses. In parallel, according to Parasuraman, Zeithaml and Berry (1988), perceived quality should be measured taking into consideration the last customer contact with the service. Johnston, Clark and Shulver (2012) assume that in most services there is customer interaction during the service process. Therefore, it is possible to conclude that every contact is different and that the perceived quality of service contact will vary throughout time even to each specific customer, making the scale useful to assess the perceived quality of a service in a specific point in time, but not exactly as an overall tendency. The variability issue has also been criticized due to the fact that the small number of items in each dimension does not allow capturing the variability in each dimension (Buttle, 1996).
There are also critiques to the application of the Servqual scale itself. Not only it has to be applied twice to each respondent, which can lead them to become bored (Carman, 1990; Buttle, 1996; Bouman and van der Wiele, 1992), but also the seven point Likert scale is not a peaceful issue as only the two ending points are labeled, which may lead respondents to answer on those extremes or to use the mid-point as a “I don’t know” answer (Lewis, 1993). Although adjusted by Parasuraman, Berry and Zeithaml (1991), the scale was criticized at one point by Babakus and Boller (1992) for having items with reversed polarity.
Taking into consideration the critiques produced, Cronin and Taylor (1992) developed the Servperf scale to assess perceived service quality. Despite the fact that this proposed instrument aimed for an improved solution to measure service quality when compared to Servqual, both of them have been profusely used in literature during the last two decades.
The banking service area become one of the most popular applications of both instruments (see, for instance, Parasuraman, Zeithaml and Berry, 1988; Cronin and Taylor, 1992). Nonetheless, is has also been used to measure service quality in healthcare services (see, for instance, Carman, 1990), car service (see, for instance, Bouman and van der Wiele, 1992), fast food services (see, for instance, Cronin and Taylor, 1992); public services (see, for instance, Gumus and Koleoglu, 2002; Chau and Kao, 2009), among many others, with Buckley (2003) stating that quality analysis in the public sector is becoming more relevant.
The healthcare services is one of the targeted areas for quality measurement using either Servqual (see, for instance, Zarei, Arab, Froushani, Rashidian and Tabatabaei, 2012; Babakus and Mangold, 1992), Servperf (see, for instance, Altuntas, Dereli and Yilmaz, 2012; Margatiris, Katharaki and Katharakis, 2012), or adjusted versions.
2.2. Hypothesis and Model
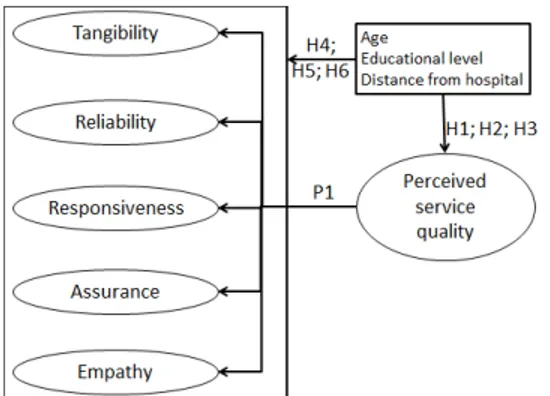
Typical analysis considering service quality assessment compares the quality dimensions defined by Parasuraman, Berry and Zeithaml (1993) and rank them (see, for instance, Al-Borie and Damanhouri, 2013; Altuntas, Dereli and Yilmaz, 2012; Zarei, Arab, Froushani, Rashidian and Tabatabaei, 2012; Isik, Tengilimoglu and Akbolat, 2011). Although these are the typical dimensions considered, some authors also include other dimensions in their analysis, such as technical quality (Dagger, Sweeney and Johnson, 2007; Babakus and Mangold, 1997), satisfaction (Margaritis, Katharaki and Katharakis, 2012), information quality (Akter, D’Ambra and Ray, 2013), which are just examples. Nonetheless, Isik, Tengilimoglu and Akbolat (2011) conclude that the Servqual instrument is a useful measurement tool to assess and monitor service quality in hospitals. On this basis, and taking into consideration the criticism Servqual has experienced, this research based its focus on the perceived quality of the service provided. Nonetheless, the dimensions considered are the ones initially proposed by Parasuraman, Berry and Zeithaml (1991). As these authors argue that the relevance of each of the dimensions may vary according to the culture where they are applied to it is relevant to assess the satisfaction rank of the dimensions. For the purpose of this research the service performance in each of the service quality dimensions will be compare, therefore the following proposition is provided:
P1: All service quality dimensions considered by Parasuraman, Berry and Zeithaml (1991) score at the same level in the obstetrics department of the considered hospital.
Although Margaritis, Katharaki and Katharakis (2012) considered place of residence as an independent variable, no conclusions were stated on this topic in terms of its influence on perceived service quality. Zarei, Arab, Froushani,
Rashidian and Tabatabaei (2012) consider residence (urban vs. rural) as a demographic characteristic but no further development is made in terms of analyzing this influence on patients’ perceived service quality. Isolated hospitals offer services that are unique to patients located at short distances. As the distance from the hospital increases, more competition exists, either from private clinics or from other public or private hospitals. This might take the patient to choose the hospital based on higher expectations from previously provided services. Based on this argument and in order to fulfill this gap, the following hypothesis will be analyzed:
H1: The distance between patient’s home and the hospital where the service is provided does not influence the perception of the overall service quality provided at the obstetrics department of the considered hospital.
Zarei, Arab, Froushani, Rashidian and Tabatabaei (2012) and Altuntas, Dereli and Yilmaz (2012) also consider
education level and age as demographic characteristics of their samples, but miss identifying their influence on the
overall perceived service quality. This research also aims at addressing this topic, therefore the following hypotheses will be considered:
H2: Patient’s educational level does not influence the perception of the overall service quality provided at the obstetrics department of the considered hospital.
H3: Patient’s age does not influence the perception of the overall service quality provided at the obstetrics department of the considered hospital.
Moreover, this research also aims at identifying if there are differences in terms of educational level, age, and
distance from the hospital that impact patients perceived service quality in each of the quality dimensions and items in
each of those dimensions. Therefore, the following hypotheses were also considered:
H4: The distance between patient’s home and the hospital where the service will be provided does not influence the perception of the service quality provided in each quality dimension and quality item at the obstetrics department of the considered hospital.
H5: Patient’s educational level does not influence the perception of the overall service quality provided in each quality dimension and quality item at the obstetrics department of the considered hospital.
H6: Patient’s age does not influence the perception of the overall service quality provided in each quality dimension and quality item at the obstetrics department of the considered hospital.
Figure 1 highlights the hypotheses in the research model.
3. Methodology and methods 3.1. Research instrument
The instrument used was based on the Servperf proposal and counted for two parts. The first part considered the five original dimensions from Servqual and its 22 items, plus a final questions concerning the overall quality; the second part considered the independent variables: age, scholar background, and distance from the hospital. On the Servqual questions, the negatively worded items were reversely stated to reduce biased answers.
On the first part of the research instrument a 7 point Likert-scale was used, just like suggested by Parasuraman, Berry and Zeithaml (1991). On the second part of the instrument intervals were used to collect data. For the age variable, the intervals used were “less than 20”, “20 to 24”, “25 to 29”, “30 to 34”, “ 35 to 39”, and “40 or more”. The reference location was the specific location where the patient lived while waiting for delivery. For the distance to the hospital variable the intervals considered were “up to 9 kms”, “10 to 19 kms”, “20 to 29 kms”, and “30 or more kms”. For the educational level the following intervals were considered: “Cannot read or write”, “Four years of study”, “Nine years of school”, “12 years of school”, “Minor degree”, “Master degree”, and “PhD degree”.
3.2. Sample and Data Collection
Data was collected during a period of two months, which was the limit authorized by the hospital. Data was collected from 81 patients, which were all the women that delivered babies in the obstetrics department of the considered hospital during the research period. Of these 14 were eliminated due to lack of information. Therefore from an initial 100% response rate, only 82,7% of the questionnaires were considered.
A pre-test was conducted to test the wording of the questionnaire, which allowed adjusting the wording to better fit patient understanding and instrument intension. This pre-test also lead to the need to eliminate income as a research item as the patients felt uncomfortable and resistant to provide that information and even to answer to the questionnaire.
The questionnaire was applied when the patient was about to leave the hospital after having delivered her baby.
3.3. Analyses
In order to address the aim of this research and test the hypotheses from the model, a three step process was adopted: a) initial patient profile is analyzed using descriptive statistics; b) Cronbach’s alphas coefficient were computed for each hypothesized dimension in order to assess the true reliability of the instrument; c) hypothesis testing based on the true distribution shape. Analysis was processed using SPSS 20.0 software for windows.
3.4. Ethics
This study was approved by the ethics committee of the hospital on September 2011, based on a prior formal request showing the aim of the research, the data collection method and the instrument used to collect data.
4. Results 4.1. Demographics
As the number of patients aged less than 20 years and aged 40 or more years was of only one each, these intervals were aggregated with the closest ones. The results showed no patients that “Cannot read or write” or have “Four years of study”, which were eliminated from the analysis. As only two patients had PhD degrees, these were aggregated with the patients with “Master degree”, forming a new category named “More than Minor degree”. The final demographics are shown in Table 1. In terms of age, the category with most patients (34,8%) is the “25 to 29” years ones. When it comes to educational level, the most patients have “Minor degree” (37,3%), with 65,7% showing at
least a Minor degree. In terms of distance, 32,8% of the patients live in locations up to 10 kilometers and 25,4% from locations at least 30 kilometers away from the hospital.
Table 1. Demographic data
Variables N. %
Age Up to 25 12 17,9
25 to 29 24 35,8
30 to 34 16 23,9
More than 34 15 22,4
Educational level Up to 9 years of school 8 11,9
12 years of school 15 22,4
Minor degree 25 37,3
More than minor degree 19 28,4
Distance to hospital Less than 10 kms 22 32,8
From 10 to 19 kms 13 19,4 From 20 to 29 kms 15 22,4
30 or more kms 17 25,4
4.2. Construct Reliability
In order to evaluate the reliability of the five service dimensions Cronbach’s alpha coefficient was computed and results are shown in Table 2. The alpha for the overall perception is of 0,951. The results allow stating that the instrument is sufficiently reliable.
Table 2. Cronbach’s alphas Cronbach's alphas Tangibles 0,826 Reliability 0,897 Responsiveness 0,774 Assurance 0,898 Empathy 0,856 4.3. Descriptive Statistics
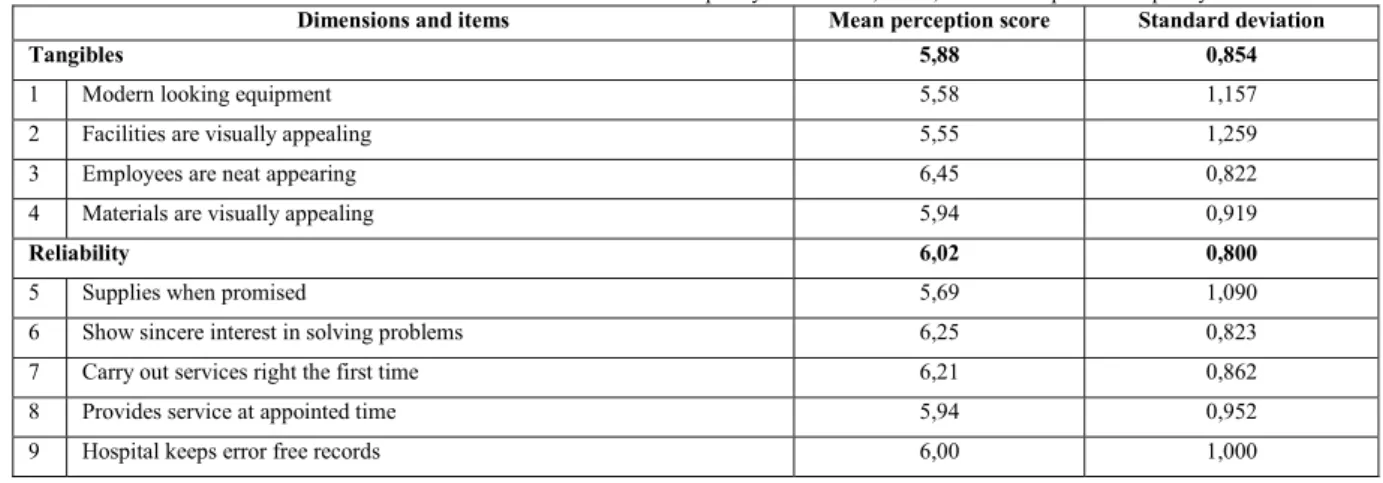
Findings show an high overall perceived quality of the service provided with a mean of 5,91 (SD=0,793). In terms of the quality dimensions, patients ranged their scores from 5,88 on Tangibles (SD=0,854) to 6,37 on Assurance (SD=0,656). In terms of the items, scores ranged from 6,49 on item 16 (Employees are consistently courteous with you) (SD=0,704) to 5,48 on item 22 (Employees understand your specific needs) (SD=1,570). Table 3 shows the means scores and standard deviations of all dimensions and items considered, and of the overall perceived quality.
Table 3. Means and standard deviation for service quality dimensions, items, and overall perceived quality
Dimensions and items Mean perception score Standard deviation
Tangibles 5,88 0,854
1 Modern looking equipment 5,58 1,157
2 Facilities are visually appealing 5,55 1,259
3 Employees are neat appearing 6,45 0,822
4 Materials are visually appealing 5,94 0,919
Reliability 6,02 0,800
5 Supplies when promised 5,69 1,090
6 Show sincere interest in solving problems 6,25 0,823
7 Carry out services right the first time 6,21 0,862
8 Provides service at appointed time 5,94 0,952
Responsiveness 6,01 0,817
10 Telling when services will be performed 6,07 0,910
11 Prompt performance of services 5,96 0,960
12 Willingness of patients to help patients 6,31 0,925
13 Attending of personnel whenever called 5,70 1,371
Assurance 6,37 0,656
14 Employees instill confidence 6,16 0,828
15 Employees behaviours makes you feel safe 6,40 0,760
16 Employees are consistently courteous and friendly 6,49 0,704
17 Knowledgeable personnel to answer questions 6,41 0,700
Empathy 5,98 0,838
18 Individual attention to patients 6,31 0,802
19 Availability 24-hours 6,13 0,851
20 Provide personal attention 6,03 0,937
21 Hospital has patient's best interest at heart 5,94 0,903
22 Understanding of your specific needs 5,48 1,570
Overall perceived quality 5,91 0,793
4.4. Hypotheses Testing
The previous section allowed verifying that the service quality dimensions do not score the same, which is to say that service quality is perceived differently in each dimension. As so, P1 is not supported.
The Kolmogorov-Smirnov test showed that none of the distributions associated to the independent variables follow a normal distribution, either for the overall quality, the dimensions, or the items considered. Therefore non-parametric tests were used to test H1 to H6
Kruskal-Wallis test results lead to retain the hypothesis that the overall perceived quality is the same across all age, educational level, and distance categories, as all p-values were above 0,005. This is to say that H1, H2, and H3 are retained.
Findings also showed that for α=0,05 there are not statistically significant differences between the groups considered for each of the age, educational level, and distance in terms of the service quality dimensions, which contributes to partially retain H4, H5, and H6. Nonetheless, the items considered for each of the dimensions have to be tested so that these last hypotheses may be fully assessed.
In terms of the distance the patient was from the hospital, Kruskal-Wallis tests showed that there are statistically significant differences between distance categories for item 15 (Employees behaviours makes you feel safe) with p=0,019 and for item 21 (Hospital has patient's best interest at heart) with p=0,049. If α=0,08 is considered, statistically significant differences also emerge for item 9 (Hospital keeps error free records) with p=0,070 and for item 14 (Employees instill confidence) with =0,060. Bonferroni Post Hoc tests showed that for item 15 statistically significant differences emerge between category “From 10 to 19 kms” and category “From 20 to 29 kms” (p=0,013). The first mentioned category shows an average of 6,00 (SD=0,913), which is the lowest of all categories, and the second category an average of 6,87 (SD=0,352), which is the highest. It is them possible to say that the distance for the hospital influences patient’s perceived safety feeling, with moderate short distances leading to lower perceived safety from employees. No statistically significant differences were found on Post Hoc tests for item 21.
In terms of distance, item 9 showed no statistically significant differences for Post Hoc Bonferroni test. Nonetheless, it showed statistically significant differences for item 14 between categories “From 10 to 19 kms” and “From 20 to 29 kms” with p=0,043. Once more the former category showed the lowest mean score (5,69, with SD=0,947) and the latter the highest mean score (6,53, with SD=0,516). With the proper limitation (as the significant
difference was only possible for α=0,08 ) it is possible to state that instilled confidence from the employees is higher for patients from moderate long distances, which is to say that H4 should be rejected.
Kruskal-Wallis tests showed statistically significant differences based on educational level for item 13 (Attending of personnel whenever called), with p=0,039. Bonferroni Post Hoc test showed that the significant difference emerged between patients from the “Minor degree” category and patients from “More than Minor degree” (p=0,020). In fact, patients from “more than Minor degree” average a score of 4,95 (SD=1,682) on this item, which is the lowest score of all groups, while patients from “Minor degree” score 6,16 (SD=0,898), being the highest score of all groups. It is then possible to say that the null hypothesis of H5 should not be retained, in fact it should be rejected. It is then possible to state that patients with higher educational level tend to be more demanding in terms of the time they wait for the nurse or staff person when they call for help.
Similar approach was used to test each of the 22 items in terms of the independent variable age and no item showed statistically significant differences between the groups, therefore the null hypothesis of H6 will be retained.
5. Conclusion
This research was performed on an obstetrics department of a hospital for the assessment of perceived quality of the service provided to women when they deliver their babies. Findings showed that the Servperf instrument is a reliable one to monitor the perceived service quality of this specific service.
H1, H2, and H3 from the conceptual model were retain, which is to say that the distance the patient has to cover to reach the hospital, her educational level and her age do not influence the overall perceived quality of the service provided at the analyzed obstetrics department. H6 was also retain, which translates that the age of the patient does not influence the perceived service quality at each of the quality dimensions nor on each of the items that are part of those dimensions.
Findings showed that there are differences between the scores on each dimension, which did not allow supporting P1. These findings are in line with Zarei, Arab, Froushani, Rashidian and Tabatabaei’s (2012). It was found that the distance the patients have to cover to reach the hospital influence the perceived quality of the service provided at the analyzed obstetrics department. This influence can be identified in terms of the safety feeling patients experience and the confidence service providers instill on them. Therefore H4 was rejected. Findings also showed that the educational level of the patient influences perceived service quality but only in terms of the patients being served whenever that call for help. Nonetheless, H5 was rejected. The need to focus on Empathy highlighted by the former finding is in line with Altuntas, Dereli and Yilmaz’s (2012) findings.
From the findings it is possible to recommend that doctors, nurses and remaining staff should develop a strong relationship with patients to instill confidence and that they should work on their empathy and service assurance skills. These recommendations, if considered, would impact the internal organizational paradigm. Nonetheless, it should also be considered that strengthening the internal organization and therefore, improving the perceived service quality would also contribute to the hospital’s market or transactional paradigm as it would be more attractive for patients and, therefore, more competitive.
Findings show some limitations that are relevant mentioning. These emerge from a single hospital and were produced based on a time constraint to collect data for a period of only two months. As a consequence, findings should only be considered in the context of this research and, according to Yin (2009), cannot be generalized to other hospital departments or other hospitals.
References
Akter, S., D’Ambra, J. and Ray, P. (2013), Development and validation of an instrument to measure user perceived service quality of MHealth, Information & Management, 50, 181-195.
Al-Borie, H.M. and Damanhouri, A.M. (2013), Patient’s Satisfaction of service quality in Saudi hospitals: a SERVQUAL analysis, International Journal of Health Care Quality Assurance, 26, 1, 20-30.
Altuntas, S., Dereli, T. and Yilmaz, M.K. (2012), Multi-criteria decision making methods based weighted SERVQUAL scales to measure perceived service quality in hospitals: a case study form Turkey, Total Quality Management, 23, 12, 1379-1395.
Anderson, E.W., Fornell, C. and Lehmann, D.R. (1994), Customer satisfaction, market share, and profitability: findings from Sweden, Journal of Marketing, 58, 3, 53-65.
Babakus, E. and Boller, G.W. (1992), An empirical assessment of the SERVQUAL scale. Journal of Business Research, 24, 3, 253-268. Babakus, E. and Mangold, W.G. (1992), Adapting the SERVQUAL scale to hospital services: an empirical investigation,HSR: Health Services
Research, 26, 6, 767-782.
Bilisik, O. Erdogan, M., Kaya, I. and Baraçali, H. (2013), A hybrid fuzzy methodology to evaluate customer satisfaction in a public transportation system for Instanbul, Total Quality Management and Business Excellence (in press).
Bouman, M. and van der Wiele, T. (1992), Measuring service quality in the car service industry: building and testing an instrument, International Journal of Service Industry Management, 3, 4, 4-16.
Buckley, J. (2003), E-service quality and the public sector, Managing Service Quality, 13, 6, 453-462. Buttle, F. (1996), SERVQUAL: review, critique, research agenda, European Journal of Marketing, 30, 1, 8-32.
Carman, J.M. (1990), Consumer perceptions of service quality: an assessment of the SERVQUAL dimensions, Journal of Retailing, 66, 1, 33-55. Chau, V.S. and Kao, Y-Y. (2009), Bridge over troubled water or a long and winding road? Gap-5 in airline service quality performance measures,
Managing Service Quality, 19, 1, 106-134.
Clow, K. and Vorhies, D. (1993), Building a competitive advantage for service firms, Journal of Services Marketing, 7, 1, 22-32. Cronin, J.J. and Taylor, S.A. (1992), Measuring service quality: a re-examination and extension, Journal of Marketing, 56, 3, 55-68.
Croning J.J. and Taylor, S.A. (1994), Servperf versus Servqual: reconciling performed-based and perception-minus-expectations measurement of service quality, Journal of Marketing, 58, 125-131.
Dagger, T.S., Sweeney, J.C and Johnson, L.W. (2007), A hierarchical model of heath service – scale development and investigation of an integrated model, 10, 2, 123-142.
Gronroos, C. (1988), Service quality: the six criteria of good perceived service quality, Review of business, 9, 3, 10-13.
Gumus, M. and Koleoglu (2002), Factor analysis in service attributes of Canakkale municipality, The TQM Magazine, 14, 6, 373-375. European Commission (2012), EU Transports in Figures – statistical pocketbook 2012, Publications Office of the European Union, Luxembourg. Isik, O., Tengilimoglu, D. and Akbolat, M. (2011), Measuring health care quality with the Servqual method: a comparison in public and private
hospitals, 5, 6, 1921-1930.
Johnston, R., Clark, G. and Shulver, M. (2012), Service Operations Management – improving service delivery. Pearson: Essex. Lewis, B.R. (1993), Service quality measurement, Marketing Intelligence and Planning, 11, 4, 4-12.
Margatiris, E. Katharaki, M. and Katharakis, G. (2012), Exceeding parent’s expectations in Ear-Nose-Throat outpatients facilities: the development and analysis of a questionnaire, Evaluation and Program Planning, 35, 246-255.
Paquette, J., Bellavance, F., Cordeau, J-F. and Laporte, G. (2011), Measuring quality of service in dial-a-ride operations: the case of a Canadian city, Transportation, 39, 539-564.
Parasuraman, A., Berry, L.L. and Zeithaml, V.A. (1993), Research note: more on improving service quality management, Journal of Retailing, 69, 1, 140-147.
Parasuraman, A., Berry, L.L. and Zeithaml, V.A. (1991), Refinement and reassessment of the SERVQUAL scale, Jiournal of Retailing, 67, 4, 420-450.
Parasuraman, A., Zeithaml, V.A. and Berry, L.L. (1985), A conceptual model of service quality and its implications for future research, Journal of Retailing, 49, 3, 41-50.
Parasuraman, A., Zeithaml, V.A. and Berry, L.L. (1988), Servqual: a multiple-item scale for measuring consumer perceptions of service quality, Journal of Retailing, 64, 1, 12-40.
Yin, R.K. (2009), Case study research: design and methods (Applied Social Research Methods), 4th Ed., SAGE Publications.
Zarei, A., Arab, M., Froushani, A.R., Rashidian, A. and Tabatabaei, S.M.G. (2012), Service quality of private hospitals: The Iranian Patients’ perspective, BMC Health Services Research, 12, 31.