Faculty of Sciences and Technology
Assessing soil erosion due to land use
change at the Alqueva reservoir
surrounding area
Vera Lúcia Matias Ferreira
Dissertation Submitted in Fulfillment of the Requirements for the Degree
of PhD in Marine, Earth and Environmental Sciences, specialization in
Environmental Management.
Supervisor: Dr. Thomas Panagopoulos
Faculty of Sciences and Technology
Assessing soil erosion due to land use change at
the Alqueva reservoir surrounding area
Avaliação da erosão resultante das alterações de uso do
solo na área envolvente à albufeira do Alqueva
Vera Lúcia Matias Ferreira
Dissertation Submitted in Fulfillment of the Requirements for the Degree
of PhD in Marine, Earth and Environmental Sciences, specialization in
Environmental Management.
Supervisor: Dr. Thomas Panagopoulos
Title: Assessing soil erosion due to land use change at the Alqueva
reservoir surrounding area
Declaration of authorship of work
I hereby declare that, I am the author of this work, which is original and unpublished. Authors and works consulted are properly cited in the text and included in the list of references included.
Vera Lúcia Matias Ferreira
Copyright© - Vera Ferreira. University of the Algarve. Faculty of Sciences and Technology.
The University of Algarve has the right, perpetual and without geographical boundaries, to archive and publish this work through printed copies reproduced on paper or digital form, or by any other means known or hereafter invented, through promotion of the scientific repositories and admit your copying and distribution of educational objectives or research, not commercial, as long as credit is given to the author and publisher.
A Universidade do Algarve tem o direito, perpétuo e sem limites geográficos, de arquivar e publicitar este trabalho através de exemplares impressos reproduzidos em papel ou de forma digital, ou por qualquer outro meio conhecido ou que venha a ser inventado, de o divulgar através de repositórios científicos e de admitir a sua cópia e distribuição com objetivos educacionais ou de investigação, não comerciais, desde que seja dado crédito ao autor e editor.
“The highest reward for a person's toil is not what they get for it, but what they become by it.” (John Ruskin) “Unfortunately, soils are made by nature and not by men and the products of nature are always complex.” (Karl Terzaghi)
ACKNOWLEDGEMENTS
I wish to thank all the many people that helped me during the course of my PhD research. Without their support none of this would have been possible.
I would like to thank my advisor Thomas Panagopoulos for accepting me as his PhD student and for all the support he has given me (scientific, logistic, financial and personal) throughout this period of my life. In addition, I would like to express my gratitude to Professor Carlos Guerrero for his scientific knowledge and support.
Memorable thanks to Rita Andrade, André Arvela and Anda Cakula, not only because their important contribution for this investigation, but also their friendship. The fieldwork trips, data processing, ideas on how to interpret the results, scientific discussions, relaxing moments …well, all crucial things to build up a thesis!
I would like to address my best acknowledgements to Ms Gudrun Schwilch from University of Bern and Ms Maria Jose Marques from Autonomous University of Madrid for accepting me on the Short-Term Scientific Missions (STSM’s), for the knowledge and the experiences.
A special acknowledgement for the Center for Spatial and Organizational Dynamics (CIEO) for all the support and provided conditions. A particular acknowledgement to Marlene and Julieta, from CIEO, for their kind and precious assistance, and also from the relaxing moments with tea and cakes!
Thanks to the owners of “Herdade do Roncão” (Parque do Alqueva), “Herdade dos Gregos” and “Herdade do Pico” for allowing me to collect soil samples and to make other measurements in the field, and also for all the information and clarifications. I also would like to address my best acknowledgements to the Empresa de Desenvolvimento e Infra-estruturas do Alqueva, SA. (EDIA) and Comissão de Coordenação e Desenvolvimento Regional do Alentejo (CCDRA) for all the provided information.
Finally, to Inês for always being available to help with the English.
Now a special thanks to the people I love the most…
To all my friends for sharing with me very happy moments, but also for helping and encouraging me on the bad ones over the last years. Thanks to Miguel for his support, love and patience! Many thanks to my family including my brothers Sérgio and Helder, my sister-in-law Elsa, and my niece Diana, for their love, understanding and concern. To all, many excuses for my absence during some periods.
I would like to make a very special thanks to my wonderful and magnificent parents Marcelino and Conceição, to whom I dedicate this work. They were my sources of inspiration during these years. Thank you for your love, affection, encouragement, determination, simplicity, wisdom, perseverance ... Thank you! No words can express my gratitude!
FINANCIAL SUPPORT
This research was supported by the Portuguese Science Foundation (FCT) through the PhD grant SFRH/BD/69548/2010, and partially by the project PTDC/AAC-AMB/102173/2008 (Predicting risk of soil degradation associated with biomass production and land use changes at the Alqueva dam watershed).
ABSTRACT
Soil erosion is one of the most dynamic environmental and economic threats in Mediterranean regions. As a consequence of water availability in the surrounding area of the Alqueva reservoir, new challenges were created. The conversion from native Montado grassland to intensive and irrigated agriculture, the development of golf resorts and the ongoing climate change were insufficiently considered for the erosion problem during the environmental impact study of the Alqueva project, and consequently there is an urgent need to delineate a sustainable land management for the region.
The main objective of this investigation was to assess current and future soil erosions in the surrounding area of the Alqueva reservoir using the Revised Universal Soil Loss Equation (RUSLE) in combination with Geographic Information Systems (GIS). Different soil erosion factors, the main causes and consequences, and also spatial variability and seasonality were investigated, and a simulation model was developed to support decision based on the acquired scientific knowledge.
On the first part of the study, the RUSLE equation was applied at field scale, and different land uses were selected for erosion assessment (Montado grassland, lucerne cultivation, olive orchard and vineyard). The spatial variability analysis (with geostatistics and HJ-Biplot) indicates that the intensification of land use, with tillage practices and vegetation removal, is likely to increase the susceptibility to soil erosion (soil erodibility). The effect of seasonality on soil erosion was confirmed, with the autumn season contributing the most to annual soil erosion (around 65%).
Future soil erosion scenarios were investigated for the entire study area, according to the expected land use changes (which affect vegetation cover) and climate changes (which affect rainfall-runoff erosivity). The forecasting scenarios of land use changes indicated that the intensive agriculture area is likely to increase, as well as sparse and xerophytic vegetation and rainfall-runoff erosivity. As a consequence, soil erosion in the study area is forecasted to increase from 1.78 t/ha to 3.65 t/ha by 2100. A backcasting scenario was investigated by considering the application of soil conservation practices, that will decrease soil erosion considerably to an average of 2.27 t/ha. For each scenario studied, the sediment delivery was assessed, and for the worst case scenario in 2100, an annual sedimentation value of 182 000 tonnes is predicted for the study area.
Finally it was developed a dynamic simulation model for soil erosion performed on Stella, and a graphic user interface as a decision support tool allowing the user (e.g. decision maker) to create, modify, save, and select site specific data. The system simulates the risk for soil erosion for particular local characteristics and land use, and then suggesting soil conservation practices to decrease susceptibility to erosion.
In conclusion, due to its characteristics, the study area is very vulnerable to land degradation processes, which is expected to worsen in the future. The distribution maps provide for a better understand of soil erosion and its processes under local conditions, and for the identification of critical periods, high-risk areas, and their respective causes. This information is crucial to delineate local strategies for sustainable land management, and future scenarios reveal the importance of considering the effects of land use and climate change. The decision support system is a useful tool for the exchange of scientific knowledge; however, close collaboration between scientists and local stakeholders is essential to preserve the natural resources and avoid unnecessary costs. In future research, collaboration with international projects will be important to exchange information and knowledge as a key element in the global effort to fight land degradation and to promote sustainable land management.
Keywords: Soil erosion, Alqueva reservoir, RUSLE, GIS, Land-use/cover change, Climate change, Seasonality, Spatial variability, Sedimentation, Decision support, Sustainable land management.
RESUMO
A erosão do solo é um dos mais dinâmicos problemas ambientais e económicos nas regiões mediterrânicas. Como consequência da disponibilidade de água, a zona envolvente da albufeira do Alqueva apresenta agora novos desafios e têm-se verificado alterações na paisagem local resultantes sobretudo do aumento do cultivo intensivo em regadio. Além disso, prevê-se um aumento de projetos turísticos (com áreas de golfe) e a produção de biomassa para bioenergia. Estas alterações do uso do solo, associadas às expectáveis alterações climáticas, podem intensificar a erosão do solo na região, a qual terá impactos não só a nível da sustentabilidade e produtividade do solo, mas também no aumento da sedimentação e degradação da qualidade da água da albufeira do Alqueva. Face a esta problemática, e para a definição de uma estratégia de conservação do solo na região, era urgente avaliar os efeitos dessas alterações na erosão do solo, questão à qual foi dada pouca significância aquando da avaliação de impacte ambiental do projeto Alqueva. Este foi o principal objetivo desta investigação, e envolveu o uso da RUSLE (Revised Universal Soil Loss Equation) em combinação com Sistemas de Informação Geográfica (SIG) para avaliar a atual e futura erosão do solo na área envolvente à albufeira do Alqueva, compreender quais as principais causas e efeitos, bem como variações espaciais e temporais da mesma. Outro objetivo da tese era criar uma ferramenta de apoio à decisão que sustentasse a gestão e planeamento do uso do solo na região.
A investigação foi assim dividida em três partes. A primeira parte envolve a aplicação da RUSLE em áreas experimentais (Herdades) selecionadas, para obtenção de mapas de distribuição da erosão do solo e dos respetivos fatores, incluindo uma análise da variabilidade espacial das propriedades do solo e correlações em diferentes usos do solo, efetuada com recurso a técnicas de geostatística e HJ-Biplot. Uma análise detalhada da sazonalidade de alguns fatores e a sua preponderância na erosão anual do solo é igualmente inserida nesta fase. Na segunda parte é efetuada a simulação de futuros cenários de erosão do solo, para toda a área de estudo, de acordo com as expectáveis alterações climáticas e modificações do uso do solo, sendo para isso utilizada uma abordagem “forecasting” e “backcasting”. Por fim, é apresentada um sistema de simulação da erosão do solo construída com base na informação adquirida e com objetivo de apoiar a tomada de decisão na região.
As áreas experimentais foram selecionadas de forma a incluir diferentes usos do solo, nomeadamente o uso tradicional (montado) e outros usos com recurso à rega (cultivo de luzerna, olival e vinha). Os resultados indicam que a intensificação do cultivo com rega, leva a um aumento da suscetibilidade à erosão do solo (erodibilidade do solo), consequência principal das frequentes mobilizações do solo e remoções da vegetação, Confirma-se através dos mapas de distribuição, a variabilidade sazonal da erosão do solo relacionada com as alterações na cobertura pela vegetação e variação da intensidade das precipitações ao longo do ano. Existe uma maior vulnerabilidade à erosão no outono, quando a erosividade das chuvas atinge o seu máximo e a vegetação (especialmente em sistemas naturalizados) é ainda muito baixa após um longo período quente e seco como o verão. Verifica-se que a erosão durante esta estação pode contribuir com cerca de 65% para a erosão anual.
Após a análise dos futuros cenários de alteração de uso do solo na área de estudo, verifica-se que há uma tendência para o aumento da agricultura de regadio e como converifica-sequência das alterações climáticas, um aumento da vegetação esparsa e xerofítica (que afeta a cobertura pela vegetação) e a intensificação da erosividade da precipitação. Como consequência das alterações uso do solo e do clima, é estimado um aumento da erosão do solo de 1.78 t/ha em 2006 para 3.65t/ha em 2100. De acordo com o cenário “backcasting” que considera a implementação de práticas de conservação do solo, apesar das alterações do uso do solo e do clima, espera-se uma diminuição da erosão para 2.27 t/ha (cerca de 38%). Para cada cenário estudado foram analisados os valores de sedimentação, nomeadamente a quantidade de sedimentos que efetivamente escoam na albufeira, e estima-se que para o pior cenário (em 2100) o valor anual seja cerca de 182 000 toneladas. O sistema dinâmico de simulação da erosão é criado de forma a apoiar a gestão do uso do solo na área de estudo. Este sistema inclui um modelo empírico da erosão do solo criado através do programa Stella, e uma interface criada para que o utilizador (e.g. gestor na região) ao inserir as características locais ou simplesmente selecionando uma área no mapa, consiga uma simulação da suscetibilidade de um determinado solo à erosão. De acordo com o uso e gestão estabelecidos, e a simulação efetuada, são sugeridas recomendações de práticas sustentáveis para prevenção da erosão do solo.
Através dos resultados desta investigação conclui-se que é indispensável a implementação de uma estratégia sustentável de gestão e conservação do solo na área envolvente à
albufeira do Alqueva. Devido às características da região existe um elevado risco de erosão do solo e o mesmo é expectável de agravar face às alterações climáticas e de uso do solo na região. Os mapas de distribuição e todos os cenários estudados são uteis não só na identificação de períodos mais críticos para a erosão do solo, mas também no reconhecimento de áreas de elevada vulnerabilidade, e as principais causas e consequências de determinadas modificações. Os futuros cenários revelam a importância da definição de uma estratégia baseada não só nas características locais e padrões de sazonalidade, mas também considerando os efeitos das alterações climáticas e de uso do solo. Uma ferramenta de apoio à decisão, como o modelo criado, é útil na partilha do conhecimento científico com os gestores e decisores da região. No entanto, a estreita colaboração entre cientistas e agentes locais é essencial de forma a salvaguardar os recursos naturais da região e evitar custos desnecessários associados. Como futura pesquisa, a colaboração com projetos internacionais será determinante na partilha de conhecimento e estratégias utilizadas fundamentalmente em áreas com problemática semelhante (região mediterrânica).
Palavras-chave: Erosão do solo, Albufeira do Alqueva, RUSLE, SIG, Alterações de uso do solo, Alterações climáticas, Sazonalidade, Variabilidade espacial, Sedimentação, Apoio à decisão, Conservação do solo, Sustentabilidade.
TABLE OF CONTENTS
Soil Erosion Threat ... 1
Soil Erosion Assessment Tools ... 2
Seasonality of Soil Erosion ... 3
Sustainable Land Management and Decision Support System ... 4
Study Rationale and Objectives ... 5
Thesis Outline ... 7
Study Area... 8
2.1.1. Alqueva Project ... 8
2.1.2. Surrounding Area of Alqueva Reservoir ... 9
2.1.3. Experimental Land Uses ... 12
Soil Erosion by RUSLE ... 16
2.2.1. Rainfall-Runoff Erosivity (R factor) ... 17
2.2.2. Soil Erodibility (K factor) ... 18
2.2.3. Slope Length and Steepness (LS factors) ... 20
2.2.4. Soil Vegetation Cover (C factor) ... 21
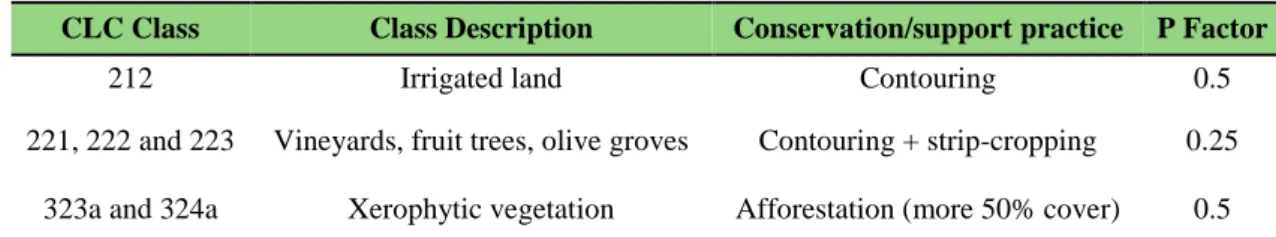
2.2.5. Conservation/Support Practice (P factor) ... 23
Spatial Variability of Soil Properties and Erodibility ... 24
2.3.1. Statistics ... 24
2.3.2. Geostatistics ... 25
2.3.2.1. Ordinary Kriging (OK) ... 25
2.3.2.1. Semivariogram ... 26
2.3.2.2. Cross-validation ... 27
2.3.2.3. Trend Analysis ... 27
2.3.3. HJ-Biplot... 28
Soil Erosion Scenarios ... 30
2.4.1. Forecasting Scenarios ... 31
2.4.1.1. Climate Change ... 32
2.4.1.2. Land-Use/Cover Change (LUCC) ... 33
2.4.2. Backcasting Scenario - Sustainable Land Management ... 35
Simulation Model and Decision Support System ... 36
2.6.1. Simulation Model Structure (Stella) ... 37
2.6.2. Input Scenarios and Decision Support System ... 38
Soil Erosion by RUSLE - Different Land Uses ... 40
3.1.1. Rainfall-Runoff Erosivity (R factor) ... 40
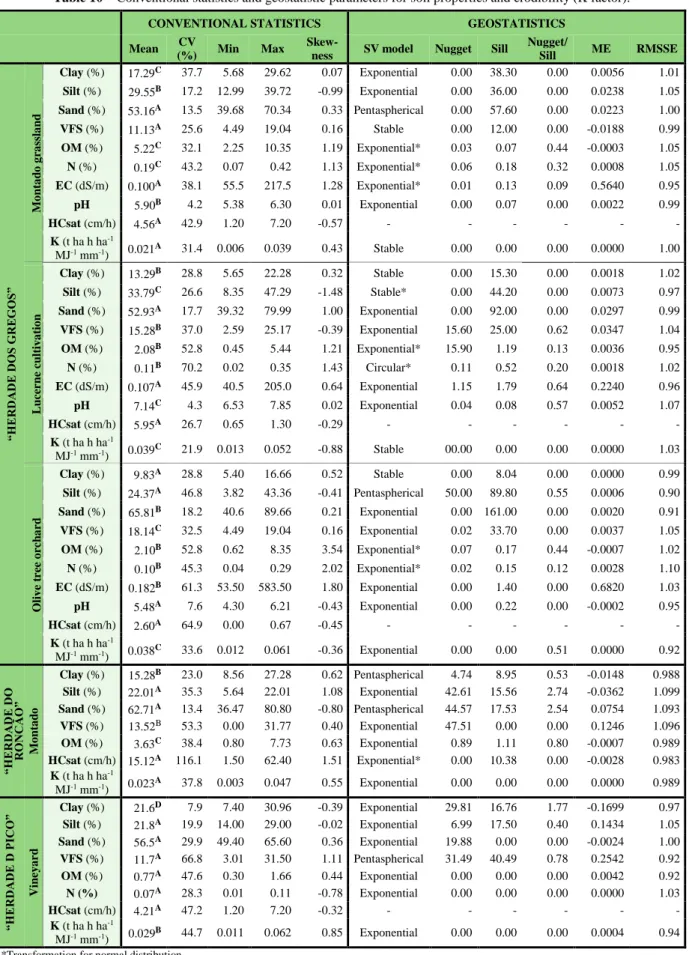
3.1.2. Soil Erodibility (K factor) and Spatial Variability of Soil Properties ... 42
3.1.2.1. Statistics Parameters Analysis ... 43
3.1.2.2. Spatial Distribution/Geostatistics ... 46
3.1.2.3. HJ-Biplot – “Herdade dos Gregos” ... 48
3.1.3. Slope Length and Steepness (LS factor) ... 51
3.1.4. Soil Vegetation Cover (C factor) ... 53
3.1.5. Soil Erosion ... 56
3.1.6. Soil Erosion Seasonality ... 58
Soil Erosion Scenarios ... 60
3.2.1. Forecasting Scenarios of Land-use/cover Change (LUCC) ... 61
3.2.2. Forecasting Scenario of Soil Erosion ... 65
3.2.3. Backcasting Scenario of Soil Erosion - Sustainable Land Management ... 67
Sediment Delivery... 69
Simulation Model and Decision Support System ... 70
The Research Questions ... 74
Limitations ... 77
LIST OF FIGURES
Figure 1 – Study area location. ... 10
Figure 2 – Soil classification in the study area (adapted from CNA/SROA (1978)). .... 11
Figure 3 – Elevation values in the study area. ... 11
Figure 4 – “Herdade dos Gregos” experimental area. ... 14
Figure 5 – “Herdade do Roncão” experimental area. ... 15
Figure 6 – “Herdade do Pico” experimental area. ... 15
Figure 7 – Scheme of RUSLE’s input factors to estimate soil erosion using ArcGIS. .. 17
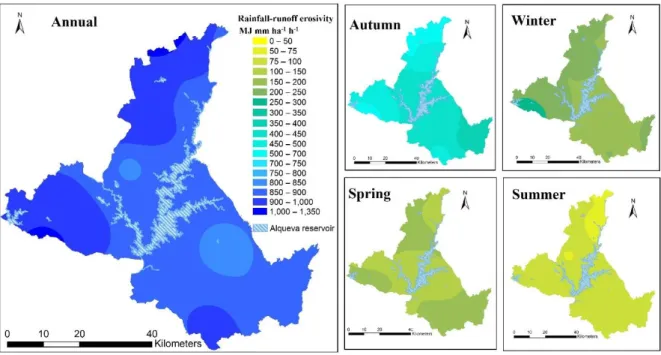
Figure 8 – Annual and seasonal distribution maps of rainfall-runoff erosivity for all the study area. ... 42
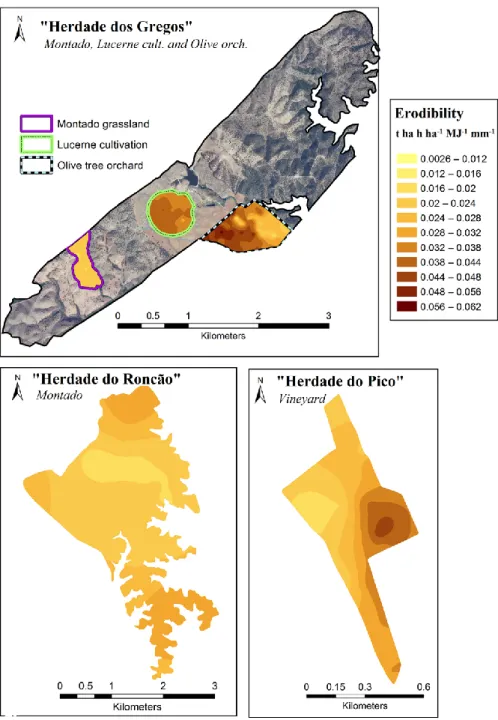
Figure 9 – Distribution maps of predicted soil erodibility factor (K) for each experimental area. ... 47
Figure 10 –The HJ-biplot representation matrix of soil samples and studied variables. 49 Figure 11 – Hierarchical clusters representation of soil samples and studied variables. 50 Figure 12 – Distribution maps of estimated LS factor for each experimental area. ... 52
Figure 13 – Distribution maps of Normalized Difference Vegetation Index (NDVI) per season and for each experimental area. ... 54
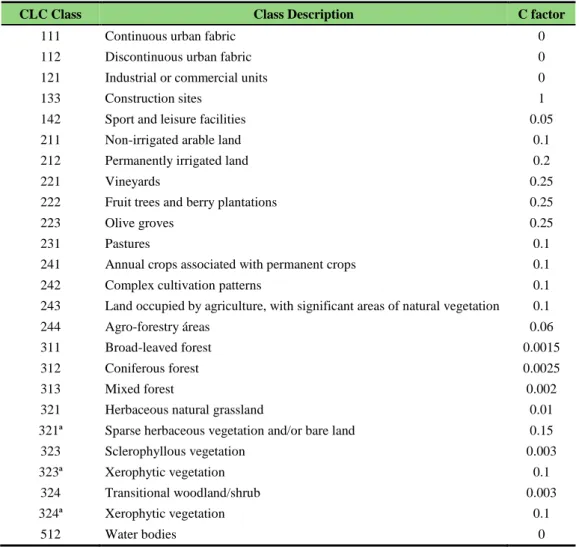
Figure 14 – Distribution maps of estimated C factor per season and for each experimental area. ... 55
Figure 15 – Annual and seasonal distribution maps of soil erosion for each experimental area. ... 57
Figure 16 – Contribution of each season to annual soil erosion. ... 59
Figure 17 – Annual distribution of soil erosion versus NDVI values and rainfall-runoff erosivity. ... 60
Figure 18 – Land use for the current situation (2006) according to Corine Land Cover. ... 61
Figure 19 – Forecasting scenario of LUCC for 2050. ... 63
Figure 20 – Forecasting scenario of LUCC for 2100. ... 63
Figure 21 – Current situation for soil erosion (2006). ... 66
Figure 22 – Forecasting scenario of soil erosion for 2100 accounting R and C factor changes. ... 66
Figure 23 – Backcasting scenario of soil erosion for 2100 considering SLM practices (P factor change). ... 68
Figure 24 – Structure of the dynamic system (simulation model of soil erosion associated to a DSS) (Cakula, 2012). ... 71
Figure 25 – Screenshots of graphic user interface to input site characteristics. ... 71
Figure 26 – Situation analysis before and after recommendation implementation (Cakula, 2012). ... 73
LIST OF TABLES
Table 1 – Total extent for the study area and for each municipality (in hectares). ... 10 Table 2 – Experimental study sites, respective land uses and areas (in hectares). ... 13 Table 3 – The number of soil samples collected and the number of HCsat field
measurements per land use in each experimental area. ... 19 Table 4 – Data set and acquisition period of satellite imagery used to obtain NDVI values, for each experimental study area. ... 22 Table 5 – CLC classes and corresponding mean values of C factor (Wischmeier and Smith, 1978; Morgan, 2005). ... 31 Table 6 – P factor considered for soil erosion scenario in 2100 considering the
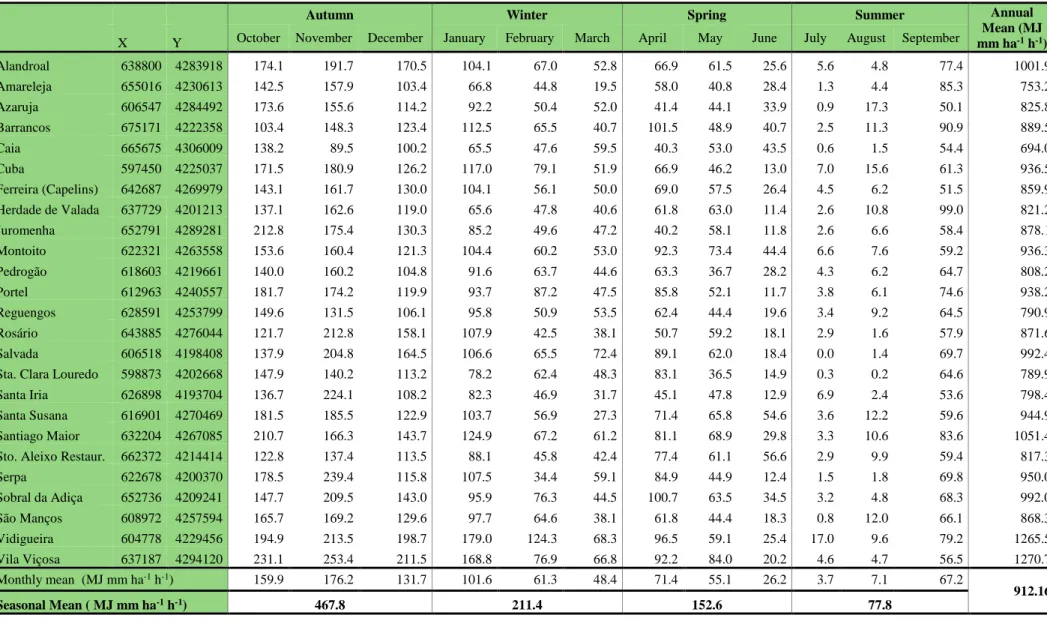
application of some SLM (Wischmeier and Smith, 1978; Morgan, 2005). ... 35 Table 7 – Systems requiring modelling in order to predict erosion. ... 38 Table 8 – Estimated rainfall-runoff erosivity values (MJ mm ha-1 h-1) (monthly,
seasonal and annual) for 25 meteorological stations (for the period between 1979/80 and 2009/10). ... 41 Table 9 – Mean values of R factor (seasonal and annual) for all experimental study areas (MJ mm ha-1 h-1). ... 42 Table 10 – Conventional statistics and geostatistic parameters for soil properties and erodibility (K factor). ... 44 Table 11 – Mean values of LS factor for each land use in the experimental areas
(dimensionless). ... 52 Table 12 – Mean values of NDVI and C factor for each land use in the experimental areas (dimensionless values)... 53 Table 13 – Annual and seasonal mean values of soil erosion for each land use in the experimental areas (t/ha). ... 58 Table 14 – LUCC in terms of area between 2000 and 2006, and for forecasting
scenarios (2050 and 2100). ... 62 Table 15 – Sediment delivery estimations for different scenarios of soil erosion. ... 69
LIST OF APPENDICES
INTRODUCTION
SOIL EROSION THREAT
Undoubtedly, the soil is one of the most important environmental components, and yet it remains an ill-treated and undervalued natural resource, associated with its multi-functionality and inadequate specific legislation. A subsequent threat to this natural resource is the intensification of soil erosion, a complex and dynamic process characterized by the deterioration of soil quality and productivity. Soil erosion begins with the increase of runoff and the loss of topsoil, reducing water and nutrient storage capacity (Yang et al., 2003; Pimentel, 2006; Li et al., 2009; Hancock et al., 2015). In addition to the impact on fertile land, soil erosion affects water systems, the health of ecosystems, and food provision. There are off-site negative impacts associated with the increase of runoff that can transport sediments into rivers and reservoirs, causing pollution and reducing their lifetime (Pandey et al., 2007; Ludwig et al., 2009; Haregeweyn et al., 2013). As the world population grows in number, soil erosion becomes more severe, bearing direct consequences in quality of life, and increasing concerns regarding soil conservation (Troeh et al., 2003).
The rhythm of worldwide land use changes and landscape structure modifications have been associated with the loss of biodiversity, depletion of natural resources, and intensification of soil erosion. Some researchers (Kosmas et al., 1997; Islam and Weil, 2000; Yang et al., 2003; Blavet et al., 2009; Cerdà et al., 2009; Cantón et al., 2011; Leh
et al., 2013; Wang and Shao, 2013; Salvati and Colantoni, 2015) have demonstrated that
alterations on vegetation cover and/or farm procedures greatly affect the properties of soil and hydrological processes. In general, cultivated lands show the highest erosion yield (Erskine et al., 2002; Garcıía-Ruiz and Lana-Renault, 2011).
The Mediterranean regions are particularly prone to this phenomenon because they have been subjected to the anthropogenic pressure, due to changes in agricultural technologies and social, political and economic development (Bakker et al., 2008), combined with specific seasonal conditions (Karydas et al., 2009; García-Ruiz et al., 2013). According to Grimm et al. (2001) almost one third of Portugal is in high risk of erosion. Furthermore,
the expected climate change will multiply the forces responsible for soil erosion, increasing the susceptibility of populations and their environments (Lal et al., 2011).
SOIL EROSION ASSESSMENT TOOLS
Over the past few decades, numerous advances have been made to assess soil erosion, in order to overcome the costs and unfeasibility of monitoring in situ. Modelling soil erosion can provide a quantitative and consistent estimation of the phenomenon under various conditions. There is not a most suitable model for all applications. Substantial investigation into soil loss modelling has taken place, and empirical, conceptual and physical based models have been put into practice and applied in specific environments. The most appropriate model depends on a number of factors, such as: the intended use and the characteristics of the catchment considered; the data requirements; the capability, accuracy, validity and reliability of the model; the objectives of the model users; the ease of use of it; the scales at which model outputs are required; and the hardware requirements (Merrit et al., 2003; Bhattarai and Dutta, 2008; Volk et al., 2010). The physics-based models are the most complex, for they are based on physical equations and require and require highly detailed information (e.g. PESERA, Kirkby et al., 2004; WEPP, Flanagan and Nearing, 1995; EUROSEM, Morgan et al., 1998). The conceptual models play an intermediary role and usually include a generalized and aggregated description of catchment processes (e.g. AGNPS, Young et al., 1989; SWAT, Arnold et al., 1998). The empirical models are generally the simplest, based on stochastic relationships which are limited to the conditions for which they have been developed (e.g. USLE, Wischmeier and Smith 1978; RUSLE, Renard et al., 1997; USPED, Mitasova et al., 1996).
The empirical Universal Soil Loss Equation (USLE) and the Revised Universal Soil Loss Equation (RUSLE), are the most widely used models for estimating annual soil loss, becoming the standard technique for soil conservation (Morgan, 2005). USLE was firstly developed to estimate soil loss from specific agriculture fields in the United States of America (USA). The RUSLE was developed with the goal of taking advantage of knowledge and new data obtained, retaining the same factors but changing the way some factors are determined. Furthermore, it allows for the estimation of different crops and management systems (Kinnel, 2010). Significant RUSLE/USLE disadvantages consist of the overestimation of erosive slope lengths and the lack of possibilities for
process-oriented simulations such as sediment transport (Winchell et al., 2008). However, RUSLE still possesses the highest benefit in terms of applicability (less input data requirements) and reliability of soil loss estimates (Desmet and Gooverts, 1996; Ferro, 2010).
Due to the spatial variation in ecosystems, the erosion models often require moderate to elevated amounts of spatial data such as topography, soil and land use, which can be effectively handled through Geographic Information Systems (GIS) (Bhattarai and Dutta, 2007; Mulligan, 2004; Wachal and Banks, 2007). The GIS can be used for the discretization of the catchment/watershed into small grid cells (Bhattarai and Dutta, 2007). GIS is an integrated suite of computer-based technologies and methodologies that link geographic information with descriptive information on different themes and from different sources (Burrough and McDonnell, 1998). It includes a powerful set of tools for collecting, storing, retrieving at will, transforming, analysing and presenting spatial data from the real world for a particular set of purposes (Burrough and McDonnell, 1998; Davis, 2001). The GIS has been used more and more in combination with soil erosion models, because it makes spatial distribution of soil erosion estimations feasible, and it allows the representation of different scenarios from various changing land use conditions and management alternatives in space and time (Fu et al., 2006; Shi et al., 2004; Bühlmann, 2006; Bhattarai and Dutta, 2007; Terranova, 2009; Prasannakumar et al., 2011). Also, the GIS allows for the use of Geostatistics (sub-section 2.3.2).
SEASONALITY OF SOIL EROSION
Because soil erosion is the result of many processes and interactions, it is also time-variant. There is evidence in literature that soil erosion varies not only between years but also throughout the year (between seasons), especially due to intra-annual rainfall and variations in vegetation cover (Van Leeuwen and Sammons, 2003; Lu et al., 2003; Grazhdani and Shumka, 2007; Panagos et al., 2011). These rainfall-runoff and vegetation dynamics are particularly investigated in the Mediterranean regions (Cerdà, 2002; López-Bermudez et al., 1998; Boardman et al., 2009; Diodato and Bellocchi, 2010; Alexandridis
et al., 2013), and their knowledge is essential to successfully delineate specific soil
conservation strategies and sustainable land management throughout the year.
Rainfall-runoff erosivity is determined by the climate region, the seasonal pattern of rainfall and the occurrence of storms (Evrard et al., 2010). In the Mediterranean area,
rainfall has great temporal variability over the years and particularly throughout the year, resulting in a strong seasonality of erosion amounts (Renschler et al., 1999; Cerdà, 2002; González- Hidalgo et al., 2007; Regüés and Gallart, 2004; Lana-Renault et al., 2007; Boardman et al., 2009; Diodato and Bellocchi, 2010).
Vegetation cover is an important factor in protecting the soil against erosion, and the efficiency varies greatly between vegetation types, which are always related to patterns in land use (Zhou et al., 2006). This RUSLE factor is frequently derived from satellite images; however, because of the lack of data, very few images (or only one image) are used each year, despite being temporally variable according to plant phenology (Alexandridis et al., 2013). Vegetation cover usually presents temporal dynamics due to differences in availability of water in the soil and in temperatures, and it is often induced by management practices. Some investigations have focused on these seasonal changes of vegetation cover (López-Bermudez et al., 1998; Camacho-De Coca et al., 2004; Gallo
et al., 2005).
SUSTAINABLE LAND MANAGEMENT AND DECISION SUPPORT SYSTEM
Soil erosion is a natural process, but it can be reduced to a maximum acceptable level or soil loss tolerance. Because of this, there is a challenge to promptly and efficiently study ecosystem changes, analyze its impacts, and proactively support sustainable land management (SLM) (Schwilch, 2012a).
Land planners and land owners are responsible for soil management actions, but they are often unaware of their role in the larger-scale erosion process. They need support from researches to help them effectively evaluate the social, economic and environmental consequences of alternative management scenarios and to specify the viable SLM strategies for soil erosion control in the region. According to Peterson et al. (2003), decisions based on simulated scenarios provide better flexibility when facing irreducible uncertainty.
Appropriate instruments are required for the exchange of knowledge. Decision support systems (DSS’s) have been created to improve the decision-making process for sustainable land management and to help developing dynamic soil conservation plans
(Pertiwi et al., 1998; Bathurst et al., 2003; Dragan et al., 2003; Manos et al., 2010). A DSS has been defined in many different ways, but can be regarded in general as an interactive computer-based system that helps people use computer communications, data, documents, knowledge and models to solve problems and make decisions (Matthies et
al., 2007). Some environment DSS’s allow for the simulation of future alternative
scenarios and can suggest alternative options for decision-makers (Manos et al., 2010; Panagopoulos et al., 2014).
STUDY RATIONALE AND OBJECTIVES
The management of reservoirs is of major importance when it comes to water supply in Portugal, not only for consumption but for energy proposes as well. The construction of the Alqueva dam in 1998, whose main propose was the creation of a water reserve in the Alentejo region, has generated the largest artificial reservoir in Portugal and in Western Europe.
Erosion has a particular influence when dams are built. Dams trap the incoming sediment in their reservoir while also changing the natural stream flow and sediment load downstream. Furthermore, an increased rate of erosion in the surrounding area can lead to problems related to the decrease in the reservoir’s life time (Julien, 2010).
With the construction of the Alqueva dam, its surroundings have faced new challenges, and land use changes have taken place as a consequence of water availability. Some of these land use changes include the conversion from the native Montado grassland to intensive agricultural uses with irrigation. Furthermore, several developments were projected around the large lake in order to build rural tourism and golf resorts, and there are plans to produce biomass for bioenergy.
During the impacts assessment of the Alqueva dam, insufficient attention was paid to soil erosion problem despite the challenges created with the project. Consequently, no adequate soil conservation plan was delineated for the region in order to protect the resource soil and the reservoir. The increase of sediment transport in the surrounding area means more sedimentation in the reservoir, which is an environmental and economic threat, for it can create water quality problems and decrease financial benefit. In sum, soil
erosion has to be carefully evaluated to adequately delineate a sustainable land management strategy.
Different projects at large scales have been created with the contribution of the European Commission, in which the risk of soil erosion was estimated for many European countries, including Portugal (e.g., PESERA, Kirkby et al., 2004) and vulnerable areas that were identified in the Mértola municipality (Alentejo) (e.g., MEDALUS, Kosmas et al.,1999). Furthermore, actual soil loss was measured for a period of 44 years at plots of approximately 166.7 m2, at the Vale Formoso experimental center (Roxo and Casimiro, 2004).
Nevertheless, the knowledge regarding soil erosion rates and processes at a smaller scale, namely on the surrounding area of the Alqueva reservoir, considering different regional directions and conditions, is essential in order to promote soil conservation, ecosystem sustainability, and to protect the reservoir. Facing that, the main goals of the present research were:
- To predict soil erosion rates under current cropping conditions using the RUSLE modelling combined with GIS tools;
- To study erosion processes and each factor considered by RUSLE, and their spatial distribution;
- To investigate the effect of different land uses on soil erosion;
- To apply geostatistic and HJ-biplot tools for a better spatial variability analysis of soil properties, finding connections with management practices and erosion processes;
- To investigate seasonality of soil erosion due to intra-annual variations in rainfall-runoff and vegetation cover;
- To construct future soil erosion scenarios, accounting the land use trajectories in the region and climate change;
- To develop desirable scenarios to decrease soil loss by applying local sustainable land management (SLM) innovations in specific fields at the study area;
- To develop a dynamic simulation model of soil erosion connected to a decision support system (DSS).
THESIS OUTLINE
This thesis is divided in four main chapters following a typical outline, namely the introduction, the methodology, the results/discussion, and the conclusion. Chapters are divided into additional subchapters.
The general introduction was presented previously in this chapter (Chapter 1), allowing the familiarization with the main themes of this thesis, and the central motivations and objectives of the investigation.
Chapter 2 corresponds to the methodology. The first section characterizes the study area, describing the Alqueva project, providing details about the surrounding reservoir area and specific aspects about the Alentejo region, and presenting experimental study land uses. In the second section it reviews and discusses the methodologies used to investigate soil erosion by RUSLE, giving calculation details about each factor and its estimation using the GIS. An approach about spatial variability analysis used in the study was explained in section 2.3, mentioning each of the methods used, namely normal statistics, geostatistics and HJ-Biplot. Section 2.4 presents the methodology used to study the future scenarios of soil erosion for the entire surrounding Alqueva area and the Section 2.5 explains the method used to estimate the sediment yield and amount values associated to these scenarios, to better realize the significance of soil erosion. The last section of this chapter presents the methodology used to create a simple and alternative simulation model connected to a DSS to be used by planners and decision makers in the region.
The results obtained with the methodology described in Chapter 2 are presented and debated in Chapter 3. Furthermore, the results from a specific analysis of soil erosion seasonality are accessible in the sub-section 3.1.6.
Conclusions about research questions, limitations and considerations about future research and possible trends are presented in the last chapter (Chapter 4).
METHODOLOGY
STUDY AREA
2.1.1. Alqueva Project
The study area is located in the south-central part of Portugal, a region called the Alentejo, known as a semi-arid area experiencing a long term process of biophysical and human desertification. In the 50s, the idea of unproductivity in that region was related to the predominance of non-irrigated agriculture, and the solution plan was the construction of the Alqueva dam (7º30' W, 38º15' N), on the Guadiana river (Sanches and Pedro, 2007). The pros and cons were discussed for decades and the Alqueva dam project began in 1998, and was finished by 2002, when the dam’s floodgates were shut. On the 12th of January
2010, the lake was complete to its planned level, generating the largest artificial reservoir in Western Europe. The reservoir has a surface area of 250 km2 (from which 35 km2 is in Spain), a total capacity of 4.15 km3, a total shoreline of approximately 1100 km, and is 83 km in length (EDIA, 2012).
The Alqueva reservoir is the main water source of a strategic multi-propose system (Alqueva Multi-purpose Undertaking - EFMA), which is a responsibility of EDIA – Empresa de Desenvolvimento e Infra-estruturas do Alqueva, SA. The main objectives of the strategic project were (Sanches and Pedro, 2007):
Creating a water reserve for agriculture;
Ensuring the water consumption for nearby populations;
Producing electric energy;
Developing tourism and leisure activities;
Promoting the region’s economic development and fight the effects of desertification.
The Alqueva Project is a system that ensures the transport of water, consisting of 68 reservoirs and dams, 300 km of primary network - which connect the main dams of the system -, 1577 km of buried pipelines on the secondary network, 52 pumping stations and 5 mini hydro plants (EDIA, 2012). It is through the Alqueva reservoir that other dams
interconnect to ensure water supply even in periods of extreme drought to an area of around 10,000 km2 in a total of 20 municipalities in the districts of Beja, Évora, Portalegre and Setúbal (200 000 inhabitants). Its hydroelectricity infrastructures produce enough energy to supply a city with more than 500 000 inhabitants (EDIA, 2012).
The Alqueva general irrigation system is projected to serve an area of about 120,000 ha and is divided into three subsystems based on the water’s origin: Alqueva, Pedrogão and Ardila. Almost all of the irrigation area is projected downstream (about 92%) from the Alqueva dam or in the neighborhood watershed, and around 8% (about 10 000) in the upstream area.
2.1.2. Surrounding Area of Alqueva Reservoir
Beside the irrigation area defined by the EDIA (in the Alqueva project), the adjacent upstream area has an increasing number of irrigated cultures, not accounted for in this project, due to the water being pumped directly from the Alqueva Lake or other small reservoirs. According to Ilhéu et al. (2011), in 2011 about 5400 ha (declared) of surrounding areas were irrigated through direct pumping. However, the irrigated area is expected to increase in the upstream surrounding area of the Alqueva reservoir. Additionally, most of the tourism projects (such as golf areas) have been projected for the surrounding area (Ferreira and Panagopoulos, 2012; Espada, 2011).
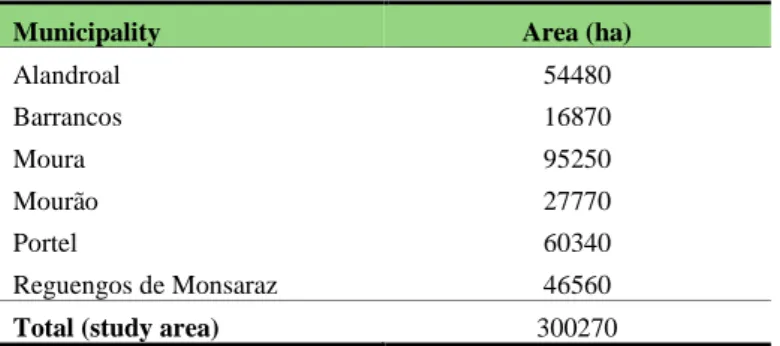
Since the objective of the investigation is the assessment of soil erosion and its effects (direct runoff and sedimentation into the reservoir) particularly due to land use changes derived from the implementation of the Alqueva project, the study area involves the adjacent surrounding area of the Alqueva reservoir, presented on the Figure 1. This area was defined according to the limits of landscape management plan specifically focused on this territory, namely the Regional Plan for the Surroundings of Alqueva lake (PROZEA) (CCDRA, 2001). The PROZEA delineates some strategies and potentialities for agriculture, tourism, and also sustainable and urban development in the region, which are then used to create future land-use/cover change scenarios (sub-section 2.4.1.1). Excluding the area submerged by the lake, the research area integrates six municipalities of the Alentejo region: Alandroal, Barrancos, Moura, Mourão, Portel and Reguengos de Monsaraz (Figure 1 and Table 1). The total study area corresponds to 300 270 ha (as shown in Table 1), including the reservoir.
Figure 1 – Study area location.
Table 1 - Total extent for the study area and for each municipality (in hectares).
Municipality Area (ha)
Alandroal 54480 Barrancos 16870 Moura 95250 Mourão 27770 Portel 60340 Reguengos de Monsaraz 46560
Total (study area) 300270
The study area region is demographically characterized by low population densities and has experienced a decline of its population due to rural exodus. The total Alentejo region (which corresponds to the districts of Beja, Évora, Portalegre and part of Setúbal, a total of 2 727 600 ha) lost 25% of its population between 1950 and 1970. Currently, the population loss continues at a 5% rate for the 2001-2011, with a population density of 18.5 hab/km2 for 2011 (INE, 2014).
The climate is continental Mediterranean (type Csa, according to Koppen classification), with mild winters and very hot and dry summer. The average temperature ranges from 24 to 28°C in hot months (July/August), and from 8 to 11°C in cold months
(December/January). The average annual precipitation for the last 30 years is approximately 500 mm. The region experiences long dry periods, given that 80% of the precipitation occurs from October through April (Ferreira and Panagopoulos, 2014). The soils are mainly leptosols and luvissols as shown on the Figure 2 (CNA/SROA, 1978). These soil are usually characterized by low percentage of organic matter. The landscape is characterized by its hilly topography with significant altitude variations (mainly between 50 and 570 meters), as shown on Figure 3.
Figure 2 – Soil classification in the study area (adapted from CNA/SROA (1978)).
Before the Alqueva dam implementation, the landscape was characterized by dryness and immensity, reflecting the predominance of non-irrigated cultures, olive groves, vineyards and a typical agro-silvo-pastoral system called “Montado” (Portugal) and “Dehesa” (Spain). The traditional “Montado” is comprised of low density woodlands of cork oak (Quercus suber) and holm oak (Quercus ilex), combined with a rotation of crops/fallow/pastures (Borges et al., 2010). In some montado areas, oaks are mixed with olive trees. According to the CCDRA (2001), before the Alqueva project, the Montado grasslands occupied about 54.4% of the surrounding area (study area), the olive groves around 12.6% and the vineyards less than 1%.
In the beginning of the 20th century, there was an intensification of agriculture for cereal production combined with extensive livestock breeding. This intensification led to numerous environmental impacts particularly increased soil erosion. Especially since Portugal joined the European Community in 1986, due to socioeconomic aspects presented by Jones et al. (2011), the abandonment of agricultural land has increased with the transition of some “Montado” systems to silvo-pastoral or total forestry systems. This change left the ecosystems more vulnerable to fires that increased its susceptibility to soil erosion (Jones et al., 2011); however, in some areas it resulted in the decrease of soil erosion (Bakker et al., 2008). Nowadays, the Alqueva landscape has been rapidly changing as a consequence of water availability, inducing land use change dynamics due to intensification of irrigated farming, despite the restricted area with potential for intensive agriculture (12.5%) (CCDRA, 2001). Furthermore, several tourism developments were projected around the large lake in order to build rural tourism and golf resorts, and there are plans for biomass production for bioenergy as well. Additionally to land use changes, the ongoing climate change is expected to modify vegetation patterns in this region.
2.1.3. Experimental Land Uses
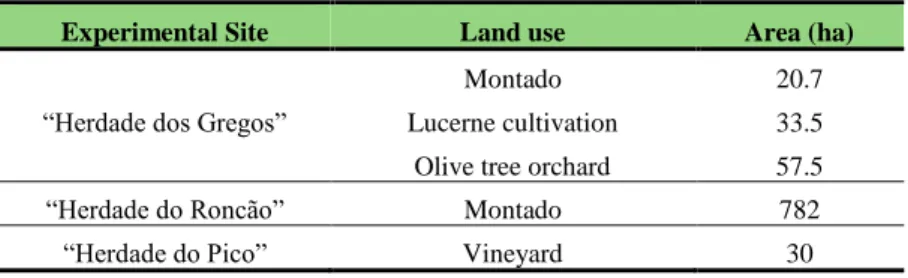
In order to investigate soil erosion, using the RUSLE model in different types of land use, three experimental areas (“herdades” in Portuguese) were selected: “Herdade do Roncão”, “Herdade dos Gregos” and “Herdade do Pico”. As exposed in Table 2, four different land uses were identified in these areas: montado grassland, vineyard, lucerne cultivation, and olive tree orchard.
Table 2 - Experimental study sites, respective land uses and areas (in hectares). Experimental Site Land use Area (ha)
“Herdade dos Gregos”
Montado 20.7 Lucerne cultivation 33.5 Olive tree orchard 57.5 “Herdade do Roncão” Montado 782 “Herdade do Pico” Vineyard 30
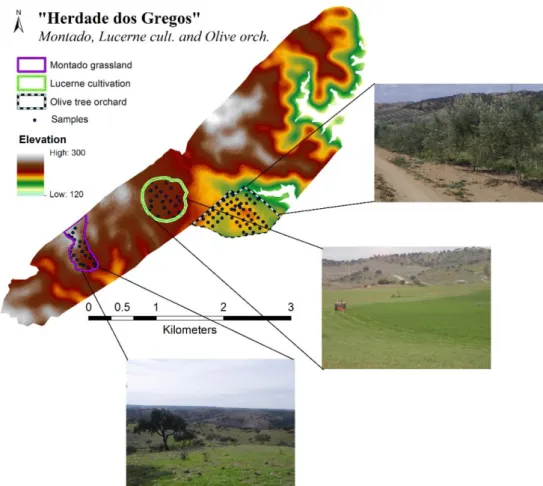
The “Herdade dos Gregos”, shown in Figure 4, is located in the west part beside the Alqueva reservoir (Figure 1), in the Portel municipality. The landscape is characterized by its hilly topography with significant altitude variations (mainly between 100 and 250 meters) (Figure 4). According to the World Reference Base for Soil Resources (CNA/SROA, 1978), the types of soil in this area are: ferric luvisols (LVf), chromic luvisol (LVch) and eutric leptosols (LPeu) (Figure 2). Direct pumping from Alqueva reservoir occurs in this private property since it is near the reservoir. This farm was selected to include a diversity of land uses, including:
- A native Montado grassland (20.7 ha) characterized by a silvo-pastoral system with low density holm oaks, used as a permanent pasture for the cattle. This small area is located in the high altitudes of the “Herdade dos Gregos” (from 200 to 240 m) with a slope that varies from 1.4 to 20.9 %. Tillage (at depths of about 15 cm) took place only once every 10 years in order to decrease shrub competition, and the soil is not subjected to any fertilizer. Four years prior to the investigation, there was a fire on this farm.
- An intensive cultivation of Lucerne (33.5 ha) with irrigation (Pivot Sprinkler Irrigation System), tillage and fertilization. Direct pumping from the Alqueva reservoir takes place in this private property since it is near the reservoir. Lucerne (Medicago sativa) is sown four times a year and once dried is nutritional for cattle, and it incorporates nitrogen in the soil. Conventional tillage is used, involving multiple aspects: plough (at about 20 cm of depth) in the fall, fallowing cultivator (depths of about 15 cm) and disc harrow (10 cm depths) after soil tillage. Inorganic fertilizers were applied to the cultivated field at a rate of 100 kg ha-1 NPK. This land use is placed in the midland (194-220 m), and the slope varies from 0 to 9%.
- An olive tree orchard (57.5 ha) with irrigation, which is done in strips. This cultivation has a drip irrigation system, is fertilized once every two years and is ploughed once a year
to decrease weed competition. The Olive orchard is located in the low elevations of the farm (150-186 m) and the slope varies from 0 to 14.2%.
Figure 4 – “Herdade dos Gregos” experimental area.
“Herdade do Roncão”, represented in the Figure 5, is comprised of 739 ha and liesbeside the reservoir in the west part, near Regengos de Monsaraz (Figure 1). The area includes a typical “Montado” characterized by a silvo-pastoral system with low density holm oaks and some olive trees; farming in this area ceased about 6 years ago. A tourism project (with golf areas, hotel and marina) is being created for this site, thus taking advantage of the attractive landscape and water availability. The altitudes in this area range between 136-215 meters and the slope from 0 to 30%, with an average of 7.5%. The soil is Eutric leptosol (LPeu) (CNA/SROA, 1978) (Figure 2).
The “Herdade do Pico” (30 ha), shown in the Figure 6, consists of only one land use, a vineyard with irrigation, ploughed between lines and fertilized. This farm is located in the eastern part of the Alqueva reservoir, in the Mourão municipality (Figure 1), and it is
situated in the high altitudes (203-238 m) with a slope ranging from 0 to 17%. The soil in this area is Gleyic Luvisol (LVgl) (CNA/SROA, 1978) (Figure 2).
Figure 5 – “Herdade do Roncão” experimental area.
SOIL EROSION BY RUSLE
The model structure of the Revised Universal Soil Loss Equation (RUSLE) by Renard et
al. (1997) was applied as a basis for soil loss computation in this study. The basic form
of the RUSLE calculation (Equation 1) (Wischmeier and Smith, 1978; Renard et al., 1997) is defined as follows:
𝐴 = 𝑅 ∙ 𝐾 ∙ 𝐿 ∙ 𝑆 ∙ 𝐶 ∙ 𝑃 (1)
where,
A - potential soil erosion (computed annual average soil loss in t ha-1 year-1);
R - rainfall and runoff erosivity factor (MJ mm ha-1h-1);
K - soil erodibility factor (t ha h ha-1 MJ-1 mm-1);
LS - slope length and gradient factor (dimensionless ratio); C - vegetation cover factor (dimensionless ratio);
P - conservation/support practice factor (dimensionless ratio).
In this research, some adjustments in the RUSLE model were necessary to account for the effect of rainfall and vegetation seasonality. Because of this, and in order to investigate seasonal soil erosion, the rainfall-runoff erosivity (R) and vegetation cover (C) factors were analyzed on a seasonal basis, and the topographic (LS), support practice (P) and soil erodibility (K) factors were aggregated as ‘‘static’’. Soil erodibility (K factor) was considered invariant because soil properties are invariant or change very slowly throughout the year (Song et al., 2005), especially in constant soil conditions (Bryan, 2000).
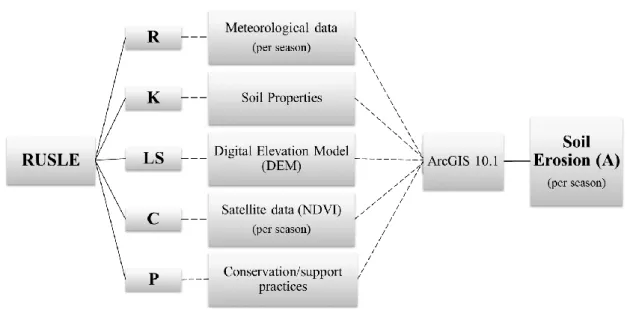
This section describes the RUSLE factors, provides details on the input information collected, and presents the equations to derive each factor. The methodology, which is summarized and structured in Figure 7, was used to investigate current scenarios of soil erosion. All the data necessary to obtain factors and soil erosion rates was processed with geographic information systems (GIS) (using ArcGIS software), in order to easily obtain the spatial distribution that is essential for decision making. For this study, ArcGIS version 10.1 was utilized.
Figure 7 – Scheme of RUSLE’s input factors to estimate soil erosion using ArcGIS.
2.2.1. Rainfall-Runoff Erosivity (R factor)
The rainfall–runoff erosivity (R factor) is typically recognized as one of the main indicators for the erosive potential of the impact of raindrops, also reproducing the potential of runoff generated by erosive rainstorms. In other words, it represents the energy and the intensity of rainfall as the driving force behind soil erosion.
According to Renard et al. (1997), the rainfall–runoff factor is estimated through the sum of erosive storm values EI30 occurring during a mean year (Equation 2):
𝑅 = 1𝑛∑ ∑𝑚 (𝐸𝐼30)𝑘
𝑘=1 𝑛
𝑗=1 (2)
where,
R - the average of the annual rainfall-runoff erosivity (MJ mm ha−1 h−1 yr−1 ); E - the total storm kinetic energy in a single event k (MJ ha-1);
I30 - the maximum 30-minutes intensity in a single event (mm h-1);
n – the number of years of records;
m – the number of erosive events in a given year j.
The accurate computation of each storm EI30 demands for high resolution measurements
on a small period time. Detailed information about rainfall for a period of 15 or 30 minutes at a time is not usually available for all locations, as only monthly or daily data or available for study. Some authors have found good correlations between EI30 and Modified
Fournier Index (Fmod) (Arnuldus, 1977; Coutinho et al., 1994; Ferro et al., 1999) or between EI30 and rainfall rates (Tomás, 1997; Loureiro, 2000; Goovaerts, 1999a). Some
of these correlations use annual rainfall and disregard seasonal fluctuations.
Goovaerts (1999a) presents a calibrated regression with high correlation values (r2 =
0.92). The regression (Equation 3) establishes the relationship between the monthly EI30 values with monthly rainfall for days where precipitation exceeds 10 mm (rain10) and
monthly number of days where precipitation exceeds 10 mm (days10):
𝐸𝐼30𝑚𝑜𝑛𝑡ℎ = 6.56 × 𝑟𝑎𝑖𝑛10− 75.09 × 𝑑𝑎𝑦𝑠10 (3)
This relation was calibrated from parameter measurements recorded at 17 tipping-bucket raingauges (time resolution = 1 min) in the south of Portugal, between October 1992 and March 1995. EI30 values were computed for each raingauge as per the instructions
provided by the RUSLE handbook (Wischemeier and Smith, 1978). Monthly EI30 values were obtained by the sum of EI30 for each erosive storm that occurred during the month. The rainfall parameters rain10 and days10 were derived from the raingauge recorded data.
It is through this type of correlation that it’s made possible to take into account seasonal fluctuations. In the study area, the monthly EI30 values were estimated using daily and monthly values of precipitation from 25 meteorological stations in the region. Daily precipitation values for a 30 year period (1979/80–2008/09) were used. A period of 20– 25 years is mentioned by Wischmeier and Smith (1978) to compute the average R factor, in order to account for cyclical rainfall patterns. The data was processed over different seasons, considering autumn (October to December), winter (January to March), spring (April to June), and summer (July to September).
Using interpolation techniques (geostatistics), in this case the ordinary kriging (OK) described in sub-section 2.3.2, rainfall-runoff erosivity maps (annual and per season) were created for the study area, and the means for each experimental area were estimated.
2.2.2. Soil Erodibility (K factor)
Soil erodibility (K factor) reflects how susceptible a soil is to experience erosion. It is defined as the average rate of soil loss per unit of rainfall-runoff erosivity index from a cultivated continuous fallow plot, on a 9 % slope 22.1 m long (Renard et al., 1997). The
K factor is a quantitative value, which is a function of soil properties, such as soil texture, content of organic matter, soil structure and permeability. According to USLE literature, it is experimentally determined using an algebraic approximation (Wischmeier and Smith, 1978) (Equation 4):
𝐾 = [2.1 × 10⁻⁴(12 − 𝑂𝑀) × 𝑀1.14+ 3.25(𝑠 − 2) + 2.5(𝑝 − 3)]/100 (4)
where OM is organic matter content, s is soil structure, and p is permeability class. M is the product of the primary particle size fractions (%MSilt) × (%MSilt + %MSand), where %MSilt is percent modified silt (0.002–0.1 mm), and %MSand is percent modified sand (0.1–2 mm). Modified silt is the amount of silt particles and very fine sand, considered the most susceptible particles to erosion because they can be easily removed by the raindrop splash and runoff water. K factor is expressed with U.S. units and division with the factor 7.59 will yield values expressed in SI units of t ha h ha-1 MJ-1 mm-1.
In this study, the soil erodibility factor was estimated using Equation 4. In order to obtain necessary soil property values, soil samples of about 1 kg from depths between 0 to 20 cm were collected in different experimental areas (presented in the previous section), with different land uses. To estimate the permeability, the field-saturated hydraulic conductivity (HCsat) was measured in situ using a double-ring infiltrometer.
The total number of samples and HCsat measurements per land use, in each experimental field, are shown in Table 3. The sample locations in situ were recorded using Global Positioning System (GPS).
Table 3 - The number of soil samples collected and the number of HCsat field measurements per land use in each
experimental area.
Experimental area “H. Gregos” “H. Roncão” “H. Pico” Land use Montado
(20 ha) Lucerne cult. (33.5 ha) Olive Orch. (57.5 ha) Montado (782 ha) Vineyard (30 ha) Soil samples (nº) 25 27 52 82 25
Field HCsat measures (nº) 6 6 6 31 9
Firstly, the samples were air-dried; then, in laboratory, they were dried for about 6 hours at 40ºC using a ventilated oven. In order to remove rocks or gravel, the samples were then passed through a 2 mm sieve. The particle-size distribution was determined by the Bouyoucos hydrometer method (Bouyoucos, 1962), and OM, using the Walkley and
Black (1934) method, a wet oxidation procedure. The permeability class and soil structure class were defined in accordance with Renard et al. (1997).
The susceptibility of soil erosion and land degradation depends largely on various inherent soil properties, namely chemical, physical, biological and mineralogical properties (Cambardella et al., 1994; Pérez-Rodríguez et al., 2007), despite the limited soil variables used by the RUSLE model to characterize soil erodibility (K factor). To better understand the complex soil interactions and processes resulted from different land use and management practices, other soil chemical properties were analyzed, namely total nitrogen (N), soil pH and electrical conductivity (EC). The N content was determined according to Kjeldhal digestion, distillation and the titration method (Bremner and Mulvaney, 1982). Soil pH and EC were measured with glass electrode in a 1:2.5 soil/water suspension (Watson and Brown, 2011).
All soil data were introduced in the ArcGIS environment, and geostatistical analysis was performed using the Geostatistical Analyst Tool in order to obtain interpolation distribution maps (geostatistic methods are better explained in sub-section 2.3.2).
2.2.3. Slope Length and Steepness (LS factors)
The effect of the local topography on soil erosion is accounted for by the LS factor in the RUSLE methodology, which combines the effects of a slope length factor (L) and a slope steepness factor (S). The slope length is defined as the horizontal distance from the origin of overland flow to the point where either the slope gradient decreases to the point where deposition begins or runoff becomes concentrated in a channel. The slope steepness determines the influence of slope gradient on soil erosion (Wischmeier and Smith, 1978). Direct measurements in situ of slope and slope length were initially proposed to evaluate these factors (Renard et al., 1997). However, this method is only suitable for small plots and parcels because intensive field measurements are obviously not feasible on a regional scale. At the watershed scale, the use of a digital elevation model (DEM) in GIS for data input is a better approach (Nekhay et al., 2009).
To estimate this factor, a DEM of 30 m resolution (available from ESRI (2009)) was used as input using ArcGIS software. Tools available on the GIS software allow users to define slope steepness and slope length raster covers by a number of different methods. The
combined LS factor (without units) was computed for the entire study area by means of the Raster Calculator under ArcGIS Spatial Analyst extension using DEM, following Equation 5, as proposed by Moore and Burch (1986):
𝐿𝑆 = (𝑓𝑎𝑐𝑐 × 𝑐𝑒𝑙𝑙 𝑠𝑖𝑧𝑒/22.13)𝑝 (sin 𝛼/0.0896)𝑞 (5)
where:
p and q - empirical exponents (p = 0.4 and q = 1.3) (Moore and Wilson, 1992);
𝑓𝑎𝑐𝑐 - flow accumulation;
cell size - size of DEM grid cell (30m for this study); α - slope degree value.
Flow accumulation signifies the accumulated upslope contributing area for a given cell; cells with high accumulation values are usually stream or river channels. Before the extraction of flow accumulation from the DEM, flow direction had to be analyzed. Both steps were done by using the correspondent tools under Hydrology section found under Spatial Analyst Tool Function in ArcGIS 10.1. The slope angles was similarly extracted from the DEM using Surface Analysis under the Spatial Analyst function.
2.2.4. Soil Vegetation Cover (C factor)
According to RUSLE literature, the C factor reflects the effect of vegetation on soil erosion rate (Renard et al., 1997). Vegetation cover protects the soil by dissipating the raindrop energy before it reaches the soil’s surface. As such, soil erosion can be effectively limited with proper management of vegetation, plant residue, and tillage (Lee, 2004). This factor ranges between 0 and 1 (without units), and it is 1 for bare soil and approximates zero as surface cover increases. It bears a close linkage to land use types. The C factor has been one of the most difficult RUSLE coefficients to estimate. According to RUSLE methodology, it is because it is based on soil loss ratios (SLR’s), which are the ratios of soil loss at any given time in the cover management sequence to soil loss from the standard condition. SLR’s are driven from the product of five sub-factors: prior land use, canopy cover, surface cover, surface roughness, and soil moisture (Renard et al., 1997). To estimate these sub-factors, empirical equations can be used. However, the data necessary is usually not available or difficult to obtain (Bühlmann, 2006).
Several methodologies have been developed for estimating vegetation cover as an alternative to C values derived from RUSLE methodologies. Remote-sensing has been one of the most widely used methods for mapping the C factor (De Jong, 1994; Kouli et
al., 2009; Prasannakumar et al., 2011). Vegetation cover can be estimated using
vegetation indexes derived from satellite images, such as the Normalized Difference Vegetation Index (NDVI). The NDVI is an important indicator of vegetation growth and ranges from -1 to 1 (Van der Knijff et al., 1999). This method gives a different perspective on soil erosion studies because it allows the estimation of intra-annual changes in vegetation cover through images for different periods (Ouyang et al., 2010).
In this research, Landsat 5 Thematic Mapper (TM) and Landsat 7 Enhanced Thematic Mapper Plus (ETM+) imagery with 30 m resolution (USGS, 2012) was used to analyze vegetation cover in each land use. Table 4 presents the timeframe and the satellite data set acquired for each experimental area studied. Satellite images were taken each season during the aforementioned period due to the difficulty in retrieving data for each month. For each experimental site, a total of 12 satellite images (corresponding to a 3 year period) were used, in order to obtain the mean NDVI values per season.
Table 4 - Data set and acquisition period of satellite imagery used to obtain NDVI values, for each experimental
study area.
Experimental area Data set Period of Acquisition
"Herdade do Roncão" Landsat 7 ETM+ October 2006 to September of 2009 "Herdade dos Gregos" Landsat 5 TM January 2009 to December of 2011 "Herdade do Pico" Landsat 5 TM January 2009 to December of 2011
Landsat TM images were processed with IDRISI software (Eastman 2006), and NDVI values were calculated utilizing band 3 (red) and band 4 (near-infrared) as follows (Equation 6):
𝑁𝐷𝑉𝐼 = (𝐵𝑎𝑛𝑑4 − 𝐵𝑎𝑛𝑑3)/(𝐵𝑎𝑛𝑑4 + 𝐵𝑎𝑛𝑑3) (6)
Many methods have been developed to estimate the C factor using NDVI information, involving a linear or non-linear regression equation model (De Jong, 1994; Van der Knijff
et al., 1999). The regression equation is derived from the correlation analysis between the
C factor values, measured in the field using the line-point intercept sampling method (Herrick et al., 2005), and a satellite-derived NDVI (De Asis and Omasa 2007). In the