Pedro Rafael Tomé Ferreira
Licenciatura em Ciências de Engenharia Biomédica
Optimization of Breast Tomosynthesis Image
Reconstruction using Parallel Computing
Dissertação para obtenção do Grau de Mestre em Engenharia Biomédica
Orientador :
Nuno Matela, Prof. Auxiliar, FCUL
Co-orientadores :
Pedro Medeiros, Prof. Associado, FCT/UNL
Nuno Oliveira, Investigador, IBEB
Júri:
Presidente: Prof. Doutora Carla Quintão Pereira
Arguente: Prof. Doutor André Damas Mora
iii
Optimization of Breast Tomosynthesis Image Reconstruction using Parallel Computing
Copyright cPedro Rafael Tomé Ferreira, Faculdade de Ciências e Tecnologia, Universi-dade Nova de Lisboa
Acknowledgements
First of all, I would like to express my deep gratitude to my research supervisors: Pro-fessor Nuno Matela, for introducing me to this challenging, but rewarding, project, for all the time spent with my doubts and for his amazing knowledge in medical imaging; Professor Pedro Medeiros, for accepting to supervise me with this project, for guiding me through the defiant world of parallel programming using GPUs and for all the produc-tive meetings we had along this dissertation; Nuno Oliveira, for his great knowledge of IDL, which demonstrated to be of great value to this dissertation and for his advices and suggestions.
I would like to show my appreciation for Professor Pedro Almeida, director of the Instituto de Biofísica e Engenharia Biomédica (Institute of Biophysics and Biomedical Engineering, IBEB), where this dissertation was conducted; I felt like I was home, always assisted by everyone with all the working conditions I needed. My special thanks are extended to the staff of IBEB for providing such a nice work environment.
I wish to express my recognition for everyone who works or has worked on this project. This dissertation is part of a large-scale research project in which several peo-ple developed their work in straight collaboration. Without this collaboration this work would not be as meaningful as it is.
vi
Programming", which I consider the best first introduction anyone can have to this topic, and for the productive conversations we had in Barcelona during the fifth edition of the Programming and Tuning Massively Parallel Systems summer school.
I am particularly grateful for the grant from the Department of Informatics of FCT-UNL, which supported this work besides letting me have my first teaching experience. I would like to thank particularly to: Professor Luis Caires, head of the department, for considering me to this grant; to the other teachers of the "Object-Oriented Programming" course and to my students, that without knowing gave me strengths to keep focused on this work.
To Ricardo Eleutério, this work would not be like this without your support, I am grateful for your companionship, friendship, patience, the long sleepless nights, the "keep up" spirit, wise advices and so on. . . I sincerely have a lot to thank to my other Biomedical Engineering colleagues, mainly Ana Carolina Pádua, Guilherme Coutinho, José Trindade and Margarida Félix, and to the persons I have met due to my extra-curricular courses from Computer Science, specially Farah Mussa and Jacomina Guer-reiro.
To my long-date friends, specially Diana Matos and Raquel Santos: I am grateful to have met you during my lifetime, each of you made me who I am today.
For everything my family have sacrificed to offer me a high-level education, thank you. I hope that I have lived to the expectations and I am proud to be part of this family. To my dad, that God has his soul, to my mother, which is the best and most kind person I know, to my brother and sister-in-law, their support were essential, to my aunt Isaura, for her affection, . . . Without their love and support this effort would not mean the same. . .
Abstract
Breast cancer is the most common cancer among women, being a major public health problem. Worldwide, X-ray mammography is the current gold-standard for medical imaging of breast cancer. However, it has associated some well-known limitations. The false-negative rates, up to 66% in symptomatic women, and the false-positive rates, up to 60%, are a continued source of concern and debate. These drawbacks prompt the devel-opment of other imaging techniques for breast cancer detection, in which Digital Breast Tomosynthesis (DBT) is included. DBT is a 3D radiographic technique that reduces the obscuring effect of tissue overlap and appears to address both issues of false-negative and false-positive rates. The 3D images in DBT are only achieved through image recon-struction methods. These methods play an important role in a clinical setting since there is a need to implement a reconstruction process that is both accurate and fast.
This dissertation deals with the optimization of iterative algorithms, with parallel computing through an implementation on Graphics Processing Units (GPUs) to make the 3D reconstruction faster using Compute Unified Device Architecture (CUDA). Iterative algorithms have shown to produce the highest quality DBT images, but since they are computationally intensive, their clinical use is currently rejected. These algorithms have the potential to reduce patient dose in DBT scans.
A method of integrating CUDA in Interactive Data Language (IDL) is proposed in or-der to accelerate the DBT image reconstructions. This method has never been attempted before for DBT. In this work the system matrix calculation, the most computationally ex-pensive part of iterative algorithms, is accelerated. A speedup of 1.6 is achieved proving the fact that GPUs can accelerate the IDL implementation.
Resumo
O cancro da mama é o tipo de cancro mais comum entre as mulheres, sendo um im-portante problema de saúde pública. Em todo o mundo, a mamografia de raios-X é o
gold-standardda imagiologia de cancro da mama. No entanto, tem associada algumas li-mitações bem conhecidas. A taxa de falso-negativos, até 66% em mulheres sintomáticas, e a taxa de falso-positivos, até 60%, são uma fonte constante de preocupação e debate. Estas desvantagens propiciaram o desenvolvimento de outras técnicas de imagem mé-dica para a deteção de cancro da mama, no qual a tomossíntese aplicada à mama (DBT, do inglêsDigital Breast Tomosynthesis) está incluída. A DBT é uma técnica radiográfica 3D que reduz o efeito de obscurecimento da sobreposição de tecidos e parece resolver ambas as questões das taxas de falsos negativos e falsos positivos. As imagens 3D em DBT ape-nas são obtidas através de métodos de reconstrução de imagem. Estes métodos têm um papel importante num contexto clínico uma vez que há a necessidade de implementar um processo de reconstrução que seja simultaneamente preciso e rápido.
Esta dissertação propõe a otimização de algoritmos iterativos, com computação para-lela através da implementação em unidades de processamento gráfico (GPUs) para tornar a reconstrução 3D mais rápida usandoCompute Unified Device Architecture (CUDA). Al-goritmos iterativos têm demostrado produzir imagens de DBT da melhor qualidade mas, uma vez que são computacionalmente exigentes, o seu uso clínico é atualmente rejeitado. Estes algoritmos têm o potencial de reduzir a dose do paciente em exames de DBT.
Um método de integração de CUDA em Interactive Data Language (IDL) é proposto no sentido de acelerar a reconstrução de imagens de DBT. Este método nunca antes foi tentado para DBT. Neste trabalho o cálculo da matriz do sistema, a parte computaci-onalmente mais exigente dos algoritmos iterativos, é acelerado. Um speedup de 1,6 é conseguido provando o fato de que GPUs aceleram a implementação em IDL.
Contents
List of Figures xiii
List of Tables xvii
Listings xix
Acronyms and Abbreviations xxi
1 Introduction 1
1.1 Objectives . . . 3
1.2 Dissertation Overview . . . 3
2 Background 5 2.1 Physiological Background . . . 5
2.1.1 Outline of the Anatomy and Physiology of the Breast . . . 5
2.1.2 Breast Cancer . . . 6
2.2 Breast Cancer Imaging . . . 6
2.2.1 Breast Tomosynthesis . . . 7
2.3 Image Reconstruction in Tomosynthesis . . . 10
2.3.1 Simultaneous Algebraic Reconstruction Technique . . . 13
2.3.2 Maximum Likelihood – Expectation Maximization . . . 14
2.3.3 Ordered Subsets – Expectation Maximization . . . 15
2.4 Parallel Programming . . . 15
2.4.1 GPU . . . 16
2.4.2 CUDA . . . 18
2.4.3 State of the Art of Image Reconstruction using Parallel Programming 20 3 Materials and Methods 21 3.1 DBT System . . . 21
xii CONTENTS
3.2.1 System Matrix Calculation . . . 25
3.3 Fundamentals of CUDA Programming. . . 29
3.3.1 GPU-Accelerated Libraries . . . 32
3.3.1.1 Thrust . . . 33
3.3.2 Development Tools . . . 34
3.4 CUDA Integration in IDL . . . 35
3.4.1 Hardware & Software . . . 36
3.4.2 CUDA Code . . . 37
3.4.3 Invoke CUDA from IDL . . . 39
3.4.4 Evaluation of the CUDA-IDL Implementation . . . 41
4 Results and Discussion 43 4.1 Expended Time in the System Matrix Calculation . . . 43
4.2 Single-Thread Execution per Kernel Strategy . . . 44
4.3 Full Integration of CUDA in IDL . . . 47
5 Conclusions and Future Work 51 5.1 Contributions . . . 54
A Poster of WBME 69
B Poster of PUMPS 71
List of Figures
1.1 Most common cancer types for women in the United States, 2014. (a)
Esti-mated new cases. (b) EstiEsti-mated number of deaths. Adapted from [1]. . . . 1
2.1 Anatomy of the female breast [54]. . . 6
2.2 Basic principles of breast tomosynthesis. Image data are acquired from various angles as the X-ray tube moves according to the (a) step-and-shoot method or the (b) continuous exposure method. (c) Image data acquired from different angles. Further, these images are reconstructed to provide a 3D image of the breast where the two overlapping structures would be located in different planes. Adapted from [42]. . . 8
2.3 Tissue overlap in X-ray mammography (2D), which hides pathologies (pink lesion). With digital breast tomosynthesis (3D), the cross-sectional slices make the lesion less likely to be obscured [72]. . . 9
2.4 Schematic of iterative image reconstruction algorithm for DBT.. . . 13
2.5 Execution of a CUDA program, using a multidimensional example of a CUDA grid organization. Adapted from [121]. . . 17
2.6 CUDA memory model. Adapted from [121]. . . 18
2.7 An example of barrier synchronization [121]. . . 19
xiv LIST OF FIGURES
3.2 Diagram of the Siemens MAMMOMAT Inspiration system performing DBT.
An X-ray source covers a 50◦arc (-25◦to +25◦,θ) emitting low-dose X-rays
at 25 locations (in this image is only presented 15 locations for simplicity). Twenty five corresponding projections are acquired by the detector. The most relevant dimensions of the system are: 65.5 cm between the X-ray
tube in the initial state (whenθ = 0◦) and the breast support table, 3 cm
between the axis of rotation and the breast support table and 1.7 cm be-tween the breast support table and the detector. The compressed breast in this work is 6 cm and it is related with the number of slices in the 3D
reconstructed image (N slices).yf ocusandzf ocusrepresent, respectively,
the coordinates y and z of the detector, both depending on θ. Adapted
from [133]. . . 23
3.3 Schematic of the iterative image reconstruction algorithms for DBT applied
to the IDL implementation. . . 24
3.4 Two-dimensional example on thexyplane of the ray driven approach. The
−−→
AB ray intersects the horizontal (filled circles) and vertical (open circles)
lines. d5 represents the5th intersection length of the ray within the image
— Euclidean distance between the points with x-coordinate X2 and X3.
The extension to three-dimensional is straightforward. . . 25
3.5 Illustration of a ray i(Ri) from a detector bin ito the X-ray beam focus,
illustrating thatRiis attenuated only by voxels that are crossed by it (green
voxels). . . 26
3.6 Focus positions on (a)xy and (b)yzplanes. . . 27
3.7 Matching of the intersection points of a ray and the voxels on the (a) xz
plane (which has always a positive slope) and (b)yz plane (which in this
case has a negative slope). . . 28
3.8 Execution of an IDL program invoking CUDA and using a
multidimen-sional example of a CUDA grid organization. . . 36
3.9 Illustration of how the data received in IDL from the CUDA code (the
vox-els’ coordinates and distances) are processed to organize it per bin. . . 40
4.1 Reconstructed images of the27thz-plane for a single iteration for System
1 with a bins’ scale factor of 16 using (a)–(c) SART, (d)–(f) ML-EM and (g)–(i) OS-EM. Three different images per algorithm are shown, from left to right: CUDA-IDL implementation using a single-thread execution per
kernel, pure-IDL implementation and difference between both. . . 46
4.2 The NME percentages of the 3D DBT reconstructed image with OS-EM as
a function of the number of subsets for a single iteration for System 1 with
LIST OF FIGURES xv
4.3 Reconstructed images of the27th z-plane for a single iteration for System
1 with a bins’ scale factor of 16 using (a)–(c) SART and (d)–(f) ML-EM. Three different images per algorithm are shown, from left to right: CUDA-IDL implementation using a multi-thread scheme per kernel call, pure-CUDA-IDL
implementation and difference between both. . . 50
5.1 Larger project entitled "Improvements of image quality and dose
reduc-tion in digital breast tomosynthesis using statistical image reconstrucreduc-tion
List of Tables
3.1 Functions used on the host and device to allocate and free memory in CUDA. 30
3.2 Systems used in this work. . . 36
3.3 Devices used in this work. . . 36
4.1 Percentages of the entire computation of a single iteration spent in the
cal-culation of the system matrix. These values are obtained from the pure-IDL implementation performed in two different systems for SART, ML-EM and OS-EM iterative algorithms, with three different bins’ scale factors. Each presented value is an average of five different tests. The standard
devia-tion of each value is not higher than 0.2%. . . 44
4.2 NME percentages of a single iteration obtained through the comparison of
the pure-IDL implementation with the CUDA-IDL implementation using a single thread CUDA kernel. This test was performed in two different sys-tems for SART, ML-EM and OS-EM iterative algorithms and with a bins’
scale factor of 16. . . 45
4.3 Average of five execution times of the pure-IDL and the CUDA-IDL
im-plementations and resulting speedup. These tests were completed for a single iteration of SART and ML-EM for the two available systems and for a bins’ scale factor of 16. The standard deviation of both implementations do not exceed 4 s and 0.04 regarding the execution times and the speedups,
respectively. . . 48
4.4 NME percentages of a single iteration obtained through the comparison of
the pure-IDL implementation with the CUDA-IDL implementation using the standard multiple thread kernel. This test was performed in two dif-ferent systems for SART and ML-EM iterative algorithms and with a bins’
Listings
3.1 Vector Addition — C Code. . . 30
3.2 Vector Addition — CUDA Code. . . 31
3.3 remove_copy_if— Thrust function example. . . 34
3.4 sort_by_key— Thrust function example. . . 34
Acronyms and Abbreviations
API Application Programming Interface
ART Algebraic Reconstruction Technique
CPU Central Processing Unit
CT Computed Tomography
CUDA Compute Unified Device Architecture
DBT Digital Breast Tomosynthesis
DCIS Ductal CarcinomaIn Situ
DM Digital Mammography
FBP Filtered BackProjection
FDA Food and Drug Administration
FOV Field Of View
GDL GNU Data Language
GPU Graphics Processing Unit
IDC Invasive Ductal Carcinoma
IDL Interactive Data Language
ILC Invasive Lobular Carcinoma
LCIS Lobular CarcinomaIn Situ
ML-EM Maximum Likelihood – Expectation Maximization
xxii ACRONYMS AND ABBREVIATIONS
NME Normalized Mean Error
NVCC NVIDIA’s CUDA Compiler
OS-EM Ordered Subsets – Expectation Maximization
PET Positron Emission Tomography
SAA Shift-And-Add
SART Simultaneous Algebraic Reconstruction Technique
SIRT Simultaneous Iterative Reconstruction Technique
SNR Signal-to-Noise Ratio
SSH Secure Shell
STL Standard Template Library
TV Total Variation
1
Introduction
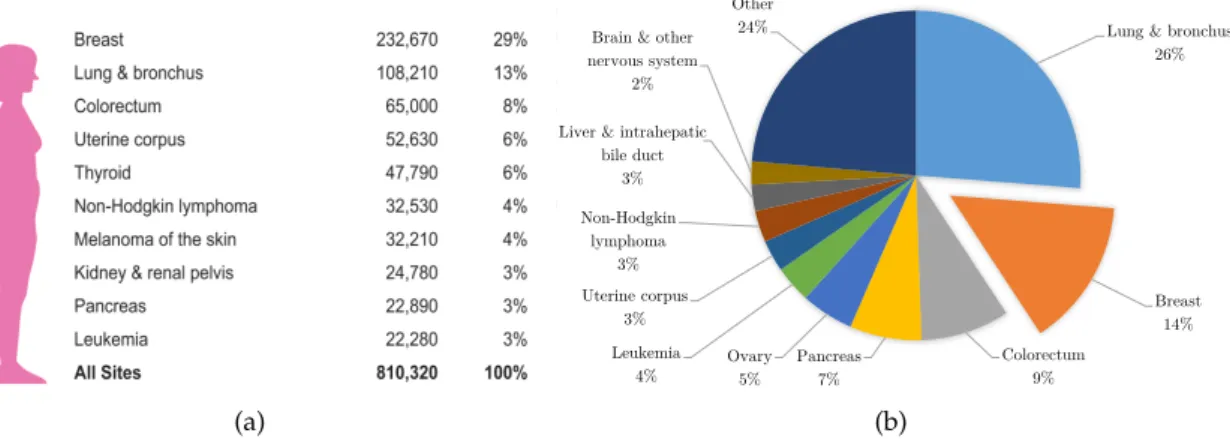
Breast cancer is the most common cancer among women, being a major public health problem. In the United States it is projected [1] that a total of 232,670 new cases and 40,000 deaths will occur in 2014 due to breast cancer (Figure1.1). In Portugal, breast cancer in women is the leading type of cancer, both in terms of new cases and deaths, 6,090 and 1,570 in 2012 respectively [2]. In fact, all countries in Europe showed in 2012 that breast is the most common site for cancer in women [2]. In Portugal alone, the statistics show that one in eleven women are likely to develop breast cancer throughout their lives.
There are several risk factors that are already well-established [3] for the development of breast cancer: age [4], family history [5], [6], early menarche [7]–[9], late menopause [10],
(a)
ng & bronchus 72330 26
Breast 40000 15
lorectum 24040 9
ancreas 19420 7
ary 14270 5
eukemia 10050 4
erine corpus 8590 3 n-Hodgkin lymphoma 8520 3 er & intrahepatic bile duct 7130 3 Brain & other nervous system 6230 2
ther 65130 23
Lung & bronchus 26% Breast 14% Colorectum 9% Pancreas 7% Ovary 5% Leukemia 4% Uterine corpus 3% Non-Hodgkin lymphoma 3% Liver & intrahepatic
bile duct 3% Brain & other nervous system
2%
Other 24%
(b)
1. INTRODUCTION
nulliparity [11], late age at first full-term pregnancy [12] and use of hormone replace-ment therapy [13]. Other risk factors include: geographic location and socioeconomic status [14]–[17], ionizing radiation [18]–[20], diet [21]–[24], alcohol consumption [25]– [27] and body weight [28]–[31].
In the 1990s, the rising trend of death rates due to breast cancer in women has changed in the United States and in most European countries (including Portugal). Over the past 25 years the death rates have been decreasing [32]–[34] as a consequence of improved treatment and early detection through screening and increasing awareness [35].
All over the world, X-ray mammography is the current gold-standard for medical imaging of breast cancer [36]. However, it has associated some well-known limitations. The false-negative rates, up to 66% in symptomatic women [37]–[39], and the false-positive rates, up to 60% [40], [41], are a continued source of concern and debate. These draw-backs prompt the development of other imaging techniques for breast cancer detection, in which Digital Breast Tomosynthesis (DBT) is included. DBT is a 3D radiographic tech-nique that reduces the obscuring effect of tissue overlap and appears to address both issues of false-negative and false-positive rates [42], [43]. Besides being a new tech-nique that was recently approved by the United States Food and Drug Administration (FDA) [44], studies [45]–[47] have been showing that it is subjectively better than con-ventional mammography in highlighting masses and areas of architectural distortion. Therefore, tomosynthesis has great potential to be a valuable tool in routine screening for breast cancer. In fact, the acquisition is performed with the same equipment as dig-ital mammography and it is even possible to obtain a 2D mammography image from tomosynthesis images without the need of an extra acquisition.
1. INTRODUCTION 1.1. Objectives
1.1
Objectives
This work is part of a large-scale two-year research project which is concluding its first year. This larger project is entitled "Improvements of image quality and dose reduction in digital breast tomosynthesis using statistical image reconstruction algorithms", is con-ducted in straight collaboration between multiple people from different institutions — Instituto de Biofísica e Engenharia Biomédica, Campus Tecnológico e Nuclear, Hospital da Luz and Laboratório de Instrumentação e Física Experimental de Partículas — and aims to:
• increase clinical value of tomosynthesis by improving image quality;
• decrease patient dose in DBT scans;
• develop a tool to optimise the exam regarding dose and image quality;
• create a new dosimetry system for mammography screening.
This dissertation, which was conducted at the Instituto de Biofísica e Engenharia Biomédica (Institute of Biophysics and Biomedical Engineering), proposes the develop-ment of a fast and accurate DBT-based image reconstruction method that includes the optimization of three iterative algorithms (SART, ML-EM and OS-EM) with parallel pro-gramming, using NVIDIAR CUDAR1to program GPUs. The time-optimization of such
algorithms can be of great importance since if they have turnaround times compatible with their use in a real clinical setting they could reduce the radiation dose the patients receive per medical examination as suggested by some studies [52], [53]. This is par-ticularly important since nowadays there is an increasing concern about reducing the radiation dose received by patients during a medical examination [20].
1.2
Dissertation Overview
This dissertation is organized in five main chapters, being the first one this introduc-tion. The remainder of the dissertation is organised as follows: Chapter 2 details the background of the work developed in this dissertation, in particular the physiological background related to the breast and tumours, a brief review of the breast cancer imag-ing modalities (focusimag-ing on tomosynthesis), image reconstruction in tomosynthesis and finalizes with a first introduction to parallel programming. Chapter3provides the ma-terials and the methodology followed throughout this work. Chapter 4 is devoted to summarizing the key results of this dissertation and Chapter5presents overall conclu-sions and perspectives of future work.
1
2
Background
In this chapter the background information necessary for the understanding of this work is addressed. First the physiological background is discussed in Section 2.1, followed by the review of the different techniques to access breast cancer, focusing on DBT, in Section2.2. The different algorithms for DBT image reconstruction are described in Sec-tion2.3, and finally in Section2.4an introduction to parallel programming and a state of the art of image reconstruction through the use of parallel programming is provided.
2.1
Physiological Background
2.1.1 Outline of the Anatomy and Physiology of the Breast
In order to understand breast cancer, it helps to have some basic knowledge about the normal structure of the breast, shown in Figure2.1. The female breast is mostly consti-tuted by fibrous, glandular and fatty (adipose) tissue. As women become older, adipose tissue gradually replaces glandular tissue, decreasing the mammographic density [55]. The fibrous and glandular tissues are structured into ducts and lobules, which are sur-rounded by fat. Additionally, within the adipose tissue is a network of nerves, lymph vessels, lymph nodes, and blood vessels.
2. BACKGROUND 2.2. Breast Cancer Imaging
Figure 2.1: Anatomy of the female breast [54].
products, as well as immune system cells [56]. Most lymphatic vessels in the breast con-nect to lymph nodes under the arm (axillary nodes), being the first place a breast cancer will spread to. The understansing of the lymphatic system is therefore essential since breast cancer cells can enter lymphatic vessels and begin to grow in lymph nodes.
2.1.2 Breast Cancer
There are different types of breast cancer, being the most common those that affect the ducts or lobules (Figure2.1). They can bein situ, within the terminal duct lobular unit and adjacent ducts, or invasive, when they penetrate the basement membrane [57]. The earliest form of breast cancer is Ductal CarcinomaIn Situ(DCIS) [58], in which the can-cer cells are confined to the breast ducts; Lobular CarcinomaIn Situ (LCIS) is when it is confined to the lobules. Both DCIS and LCIS can degenerate into invasive carcinoma, also known as Invasive Ductal Carcinoma (IDC) and Invasive Lobular Carcinoma (ILC), respectively, in which IDC is the most common type of invasive breast cancer (approxi-mately 75% [57]).
When a carcinoma is found in the breast there is a need to verify how far the cancer has spread. In order to do that, a sentinel lymph node biopsy can be performed, detecting if and which lymph nodes are cancerous.
2.2
Breast Cancer Imaging
2. BACKGROUND 2.2. Breast Cancer Imaging
The current gold-standard for medical imaging of breast cancer [36] is the X-ray mam-mography despite its well-known limitations. However, due to the different types of cancer, each imaging technique presents a different ability of detecting tumours. Besides X-ray mammography, breast ultrasound and Magnetic Resonance Imaging (MRI) are also established diagnostic techniques.
Breast ultrasound is mainly used in follow-up examination when suspicious masses are initially detected with X-ray mammography — has the capacity of distinguishing tu-mours from cystic masses (fluid in nature and almost always benign) — and also for ex-amination of a palpable breast mass in pregnant women and in women with dense breast tissue (usually younger females) [59]. Ultrasound is a low-cost non-ionising technique, but is a difficult technique to detect and characterise smaller tumours (due to image res-olution), produces very noisy images, depends on the skills of the operator, and do not allow an accurate differentiation between benign and malign pathologies [60].
MRI is well-known for its high contrast and spatial resolution. Nevertheless, the false-positive rates can be a significant problem while interpreting a breast MRI [61]. The use of intravenous contrast, the actual lack of commercially available biopsy systems and its costs, are also some drawbacks of MRI.
Additionally, other techniques have also been investigated for breast imaging, such as scintimammography and Positron Emission Tomography (PET), both nuclear imaging modalities [62] that provide useful complementary information. However, since both these techniques are tuned for whole body imaging, they lack in the detection of small lesions in the breast.
Newer techniques that are now under investigation for breast imaging, where the tests are in the earliest stages of research, include optical imaging [63], [64], positron emission mammography [65]–[67] and microwave imaging [68]–[70].
The current limitations of the breast cancer imaging techniques led to the emergence of a new interest in research on breast tomosynthesis, being this a promising technique.
2.2.1 Breast Tomosynthesis
Systems for Digital Breast Tomosynthesis (DBT), commonly called 3D mammography, are now being used for clinical work in several parts of the world, including the United States, Canada, Asia and Europe [71]. Particularly, in Portugal seven systems for DBT are installed in some hospitals (e.g. Instituto Português de Oncologia de Lisboa and Hospital da Luz), three from SiemensR2 and four from HologicR3. DBT is a new emerging
tech-nique that was in 2011 approved by the United States FDA [44], besides being available for clinical use in several other countries since 2009 [72].
DBT is a method that performs 3D X-ray mammography at doses similar to conven-tional X-ray mammography, being the total radiation dose per acquisition approximately
2Siemens is a registered trademark of Siemens AG.
2. BACKGROUND 2.2. Breast Cancer Imaging
(a) (b)
(c)
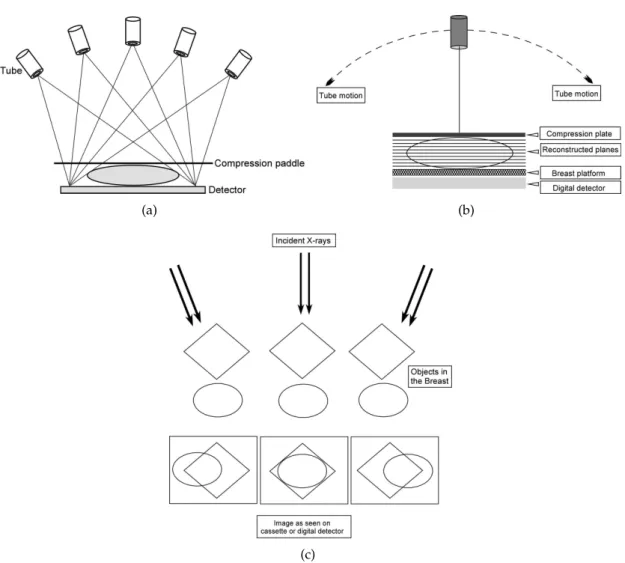
Figure 2.2: Basic principles of breast tomosynthesis. Image data are acquired from var-ious angles as the X-ray tube moves according to the (a)step-and-shoot method or the
(b) continuous exposure method. (c) Image data acquired from different angles. Fur-ther, these images are reconstructed to provide a 3D image of the breast where the two overlapping structures would be located in different planes. Adapted from [42].
2. BACKGROUND 2.2. Breast Cancer Imaging
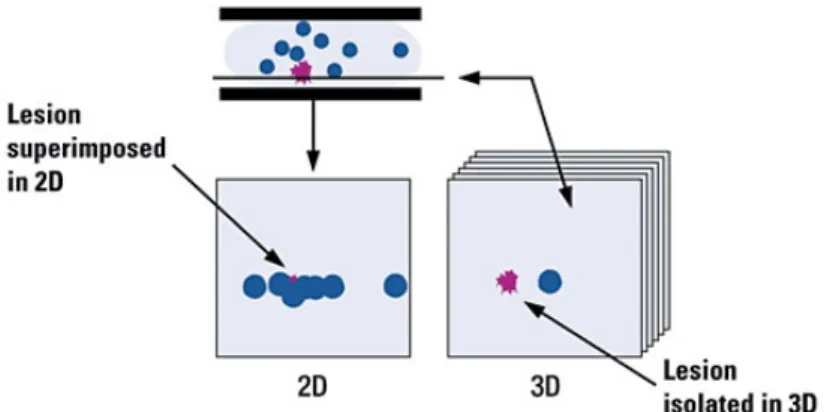
Figure 2.3: Tissue overlap in X-ray mammography (2D), which hides pathologies (pink lesion). With digital breast tomosynthesis (3D), the cross-sectional slices make the lesion less likely to be obscured [72].
together giving the appearance of pathology, resulting in a false-positive reading [40], [41] that leads to unnecessary recalls and biopsies. The overlapping occurs because the signal detected at a location on the detector is dependent upon the total attenuation of all the tissue between the detector and the X-ray beam. The attenuation can be represented by the Beer-Lambert law:
I I0
=e−µx (2.1)
whereIis the measured intensity,I0the incident intensity,xthe thickness of the material the beam travels through and µ the linear attenuation coefficient, which is higher for denser tissues.
Early findings mention that DBT may replace X-ray mammography as the standard tool for screening [71] because of its improved effectiveness (sensitivity and specificity). DBT might be the greatest technological milestone in the field of breast diagnosis by mammography, since the invention of mammography. In particular, DBT may offer the following potential clinical benefits:
• Improved cancer detection (elimination of overlapping tissues) [79]–[81];
• Reduced recalls (fewer biopsies) [80]–[82];
• Less painful compression [83], [84];
• Clearer images [43], [47], [82], [85];
• Faster review and tissue localization (biopsy methods) [86]–[88];
• Improved radiologist confidence [89].
2. BACKGROUND 2.3. Image Reconstruction in Tomosynthesis
limiting effect as with X-ray mammography, additional radiation exposure if used as ad-junct to X-ray mammography, image artefacts and the fact that the appearances of the parenchyma and normal structures on DBT images may vary from those on X-ray mam-mography. For this reason it is suggested [42] for radiologists to have additional training in order to interpret DBT images.
Nowadays, DBT still has several areas for improvement, including the distribution of radiation dose among the projections, the reconstruction algorithm, image processing and the overall user interface. The dose reduction from current levels is a potential benefit that is worth pursuing since it can facilitate the acceptance of tomosynthesis.
2.3
Image Reconstruction in Tomosynthesis
In DBT, as with Computed Tomography (CT), a 3D image is created from a sequence of projection views using reconstructed algorithms. This is an extremely challenging task since the image data are inherently incomplete, mainly with DBT — lower number of projections and limited angle in which the DBT system arcs around the breast.
Mathematically, the reconstruction problem can be thought of as an undetermined linear system. In fact, it is an inverse problem in which one uses the results from the projections to infer the value of the attenuation coefficient of each of the voxels in the 3D image — there will not be a unique solution (even with ideal data). The voxels determine how that portion of the image affects the X-ray intensity. In linear imaging problems, the following model is used:
Y =Ax+η (2.2)
whereY corresponds to the measured data,Ais the system matrix which gives the data measurement process in the image (geometric model of the transmission and detection processes),xis the image to be estimated andηis the additive noise (in DBT it can be for instance X-ray scatter and electronic noise), which is neglected in order to simplify the problem. However, for DBT there is multiple projections, therefore:
Y1 .. . Yn .. . YN = A1 .. . An .. . AN x (2.3)
2. BACKGROUND 2.3. Image Reconstruction in Tomosynthesis
Furthermore, considering that each projection hasIpixels and thatxhasJ voxels:
h
y1 · · · yi · · · yI
i =
a11 · · · a1j · · · a1J
..
. . .. ... ... ... ai1 · · · aij · · · aiJ
..
. . .. ... ... ... aI1 · · · aIj · · · aIJ
x1 .. . xj .. . xJ (2.4)
whereyi is the ith pixel ofYn,aij is the system matrix value for the combination of the
pixeliand the voxeljandxjis thejthvoxel ofx. Finally, for a pixeliof a single
projec-tion:
yi =
X
j
aijxj (2.5)
In order to obtain the attenuation coefficient for each voxel j, it is important to take into consideration the DBT system, the inhomogeneity of the breast and the Beer-Lambert law (Equation2.1), that is:
ln I0 I i =X j
µjxij (2.6)
for each projection, where:ln I0 I
irepresents the X-ray beam attenuation in the direction
i, which is the direction defined by the focal point of the emission and the ith bin of the detector (from now on this direction will be called ray i, Ri); µj is the attenuation
coefficient in the voxelj andxij represents the probability that a photon inRi has to be
absorbed in the voxelj. From Equation2.6it is possible to conclude that the attenuation coefficient for a voxeljis not possible to identify with only one measurement, due to the high number of unknown values in the equation. The attenuation coefficients can only be separated with multiple projections. Through the assignment of gray levels to different ranges of attenuation coefficients, the 3D gray-scale image can be produced, representing the different structures in the breast with different X-ray attenuation characteristics.
Every image reconstruction algorithm should fulfil Equation2.2. This equation can be adapted to DBT by comparing Equation2.5with Equation2.6:lnI0
I
icorresponds toyi;
P
jµjxij corresponds toPjaijxj, whereµj corresponds toxj andxij toaij, depending
the system matrix only on the scanner’s geometry.
2. BACKGROUND 2.3. Image Reconstruction in Tomosynthesis
of the reconstructed images. Several analytic algorithms have been employed in DBT, including:
• Shift-And-Add (SAA)[90], [91] — algorithm based on shifting and adding projec-tions to sharpen the plane focus. It is frequently used in DBT [73] due to its simplic-ity and speed, being the initial idea for DBT image reconstructions [92]. However, due to the characteristics of the reconstruction, a considerable amount of out of fo-cus slice blur occurs. This algorithm has been modified by several research groups (e.g. image stretching shift-and-add [93]).
• Filtered BackProjection (FBP) [94]–[96] — most used and common known algo-rithm in medical image reconstruction [97]–[100], due to the fast execution time and easy implementation. Despite its efficiency, FBP tends to yield conspicuous artefacts [48], [99], [101]. Therefore, the limited number of projections in DBT makes the reconstruction with FBP inexact. FBP performs better with wider angles [74], [102].
Analytic algorithms present multiple problems that iterative algorithms can improve. The fact that iterative algorithms include accurate physical and statistical models usu-ally results as an improved image accuracy, which is an advantage upon analytical al-gorithms that employ simplifications in the reconstruction model (e.g. unable to handle scatter) [48]. However, since iterative algorithms frequently have to solve large sets of nonlinear equations, they take much more time when compared to the analytical algo-rithms [49]–[51], which explains the default clinical choice of analytical algorithms. Nev-ertheless, with the recent improvements made in the computers’ hardware field, iterative reconstruction algorithms must now be considered in order to improve image quality and, consequently, the diagnosis and treatment. In fact, with the rise of parallel com-puting in the medical physics field, it is now possible to accelerate several processes that could not be done a couple of years ago. Furthermore, by using iterative algorithms, the reduction of radiation dose that is induced to patients in these exams becomes a possibil-ity [52], [53], since these algorithms deal better with noise than the analytical ones.
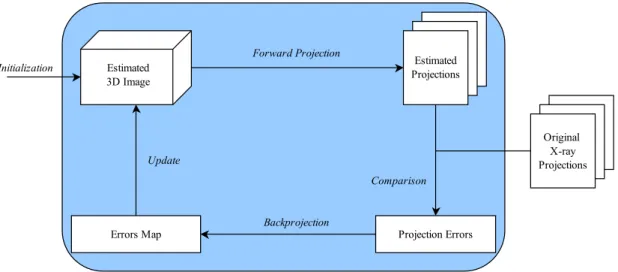
Generally, every iterative image reconstruction algorithm can be explained using the scheme presented in Figure2.4(being this scheme adapted to DBT). The reconstruction process begins with an initial image estimate (Initizalization),bx(0), usually a constant. A
Forward Projectionoperation — to estimate each bin value from the linear attenuation co-efficients stored in voxels — is then applied to the current "Estimated 3D Image", xb(k), yielding a set of "Estimated Projections". After, aComparisonis completed between those projections and the "Original X-ray projections" (Y), obtaining "Projection Errors". Next, with the process ofBackprojection— to update voxels based on differences between esti-mated and measured bin values — an "Errors Map" is obtained which is used toUpdate b
x(k), obtainingxb(k+1). In both theForward Projectionand theBackprojectionprocesses, the
2. BACKGROUND 2.3. Image Reconstruction in Tomosynthesis
Figure 2.4: Schematic of iterative image reconstruction algorithm for DBT.
process for DBT. The method used for the calculation ofA is independent of the algo-rithm used — the same Acan be used in all iterative algorithms. To sum up, iterative algorithms in DBT can be seen as a step-by-step procedure to determine a 3D imagexbas close as possible to the real attenuation coefficients that originated a certain set of X-ray projections,Y. In Figure2.4each loop represents one iteration. Each step of the diagram will be exposed in detail, for the relevant algorithms for this work, since it is essentially here where they differ.
In iterative algorithms each successive estimation should converge to the solution of the problem. However, due to the noise present in the "Original X-ray projections", as the iterative procedure proceeds, firstly the reconstruction converges to an image that can be recognized and then diverges to noise [94]. Therefore, in order to obtain the best results, it is important to know when to stop the iterations.
In this work, three different iterative algorithms will be implemented, one algebraic algorithm, SART, and two statistical algorithms, ML-EM and OS-EM.
2.3.1 Simultaneous Algebraic Reconstruction Technique
2. BACKGROUND 2.3. Image Reconstruction in Tomosynthesis
combines the high convergence speed of ART with the noise suppression of SIRT, pro-ducing a superior reconstruction result. Moreover, ART is not suitable for the GPU, since each iteration only processes a single projection line.
For SART, an update is performed after all rays in one projection have been processed. The update step is given by:
b
xkj+1 =xbkj +λ P
yi∈Yn aij
yi−P j
aijbxkj
P
j
aij
P
yi∈Yn
aij (2.7)
whereλis known as the relaxation parameter and its value is chosen in order to maximize Signal-to-Noise Ratio (SNR).
It is possible to relate Equation2.7to the scheme presented in Figure2.4. By multiply-ing the estimate resultmultiply-ing from the previous iteration by the system matrix, we are calcu-lating the "Estimated Projections" (Forward Projectionprocess). Further, these "Estimated Projections" are compared with the "Original X-ray Projections" (Comparisonprocess) by subtraction. The next step consists in multiplying the difference obtained by the equiv-alent system matrix element, performing theBackprojectionoperation. Finally, anUpdate
of the estimate from the previous iteration is performed by adding the correction factor obtained from theBackprojectionoperation.
2.3.2 Maximum Likelihood – Expectation Maximization
In the Maximum Likelihood – Expectation Maximization (ML-EM) method it is assumed that the measurements follow Poisson stratistics. The ML-EM formula for emission to-mography [106] is given by:
b
xkj+1= xb
k j P i aij X i aij Yi P t
aitxbkt
(2.8)
In [107] an algorithm for transmission tomography is proposed. However, an exact analytical solution for this problem cannot be specified, being a mathematically more dif-ficult problem than for emission tomography. Thus, and since the algorithm for emission tomography has become much more popular than the one for transmission [108], [109], we chose to focus our work on the emission tomography formulation.
Similarly to SART, Equation2.8of ML-EM can be related to the scheme presented in Figure2.4 in the following way: Forward Projection— Ptaitxbkt; Comparison— dividing
Yi by the result from the Projection; Backprojection — the results of the Comparison are
summed and weighted by the system matrix elements;Update— multiplying the result of theBackprojectionby the estimation obtained from the previous iteration.
2. BACKGROUND 2.4. Parallel Programming
will reach a convergence point that corresponds to a noisy solution. The latter problem has two possible solutions: using a filter to the reconstructed image aiming to smooth the solution, or stopping the algorithm before it reaches the convergence but while the image is smooth.
2.3.3 Ordered Subsets – Expectation Maximization
In order to overcome the very slow convergence rate of ML-EM algorithm, it is possible to group together multiple projections and update the attenuation coefficients based on each one of the subsets. This is the principle underlying the Ordered Subsets – Expectation Maximization (OS-EM) algorithm [110].
The equation that describes OS-EM iterative process is the following:
b
xkj+1 = bx
k j P i∈Sn aij X i∈Sn aij Yi P t
aitxbkt
(2.9)
being very similar to the Equation2.8of ML-EM with the difference that it is just applied to a specific subset Sn. Thus, each iteration of OS-EM is composed of n subiterations
leading the estimated image to be updated ntimes per iteration. This enables a faster convergence speed but leads to the sooner appearance of significant noise.
2.4
Parallel Programming
Today, all computer architectures include multiple Central Processing Units (CPUs). In order to take advantage of such architectures new programming techniques are needed, sometimes associated with the scientific area of parallel programming. Parallel program-ming aims to mimic the natural world in the sense that many complex events happen at the same time. Thus, parallelism is a known and ubiquitous concept (e.g. in a house construction several workers can perform separate tasks simultaneously). In medical physics, many computing applications can be formulated as data-parallel tasks, which can reduce the processing times. The move from sequential programming to parallel programming has been a major change in the field of computer science.
2. BACKGROUND 2.4. Parallel Programming
GPUs for performing scientific calculations. Particularly, medical physics is increasingly converting its algorithms to parallel computing architectures to exploit the capabilities of the GPUs for practical processing times. Although there is some controversy about this, it is generally believed that GPUs offer a better relationship performance/cost when compared with conventional CPUs; the same applies to the relationship performance/-consumption. Naturally, some problems remain, the most important being the difficulties in programming GPUs, or more specifically the difficulty in achieving the performance levels of the raw hardware. The use of GPUs in irregular problems (those that do not conform to the data-parallel paradigm) is also an open question. Nevertheless, GPU speed grows much faster (2.4 times/year) than the Moore’s law for CPU [112]. In fact, NVIDIA [113] indicated that from 2008 to 2014 the number of university courses on GPU computing increased from 60 to 738.
2.4.1 GPU
The GPU was originally designed for high-speed graphics, having emerged as a plat-form for running massively parallel computing. In fact, the video game industry had extreme importance in the fast-growing of GPUs [112], aiming to advance massive num-ber of floating-point calculations. Thus, this hardware has the advantage of supporting floating-point arithmetic which is an asset for processing medical physics data. Nowa-days, GPU stands as a reference in medical physics, each time with more on-going re-search such as in MRI [114], [115], ultrasound [116], [117] and CT [118], [119].
The reason of the large discrepancy in floating-point capability between the CPU and the GPU lies in the differences in the design of the two types of processors. CPU is opti-mized for sequential code performance, while GPU is specialized for compute-intensive, highly parallel, multithreaded, manycore processor. Therefore, many applications exe-cute sequential parts on the CPUs — when it is not possible to parallelize these portions — and numerically intensive parts on the GPUs. In order to evaluate the maximum ex-pected improvement to an overall system (speedup), the Amdahl’s law [120] provides a theoretical upper limit on parallel speedup:
speedup= 1 rs+ rnp
(2.10)
wherenis the number of processors that run the same portion of code, andrsandrpthe
ratio of the sequential and parallelized portions, respectively. By taking into account that rs+rp= 1and consideringnto tend to infinity, Equation2.10can be reduced to:
speedup= 1
1−rp (2.11)
2. BACKGROUND 2.4. Parallel Programming
that the time spent in the parallel portion should be the vast majority, reducing the com-ponent1−rpto the smallest possible value. However, Amdahl’s law assumes that there
are no costs for CPU-GPU communications, which in reality have an important impact in the degradation of performance and must be taken into account.
Several Application Programming Interfaces (APIs) expose GPUs to the developer in a C-like programming paradigm. These commonly used APIs include, among others, NVIDIA CUDA and OpenCLTM software4[122]. CUDA was the API chosen to be used
in this dissertation, being currently the most popular GPU computing API, released in 2007 by NVIDIA [123]. Nevertheless, all the concepts are rapidly applied to other APIs. In fact, who are familiar with CUDA can pick up OpenCL relatively easy, due to the similarity between the key concepts and features. Therefore, it is fair to compare OpenCL with CUDA since both can be executed on NVIDIA GPUs. However, their goals are rather different, CUDA is specific to NVIDIA GPUs (directly connected to the execution platform) whereas OpenCL promises the key feature of portability (through its abstracted memory and execution model). Moreover, being CUDA more mature than OpenCL, it has been used and optimized more heavily. CUDA provides the best performance [124].
Host (CPU) Device (GPU)
Kernel 1 Grid 1 Block (0, 0) Block (1, 1) Block (1, 0) Block (0, 1) Kernel 2 Grid 2 (0,1,3) Thread
(0,1,0) Thread(0,1,1) Thread(0,1,2) Thread
(0,0,0) Thread(0,0,1) Thread(0,0,2) Thread(0,0,3)
Block (1,1)
(1,0,0) (1,0,1) (1,0,2) (1,0,3)
Serial code Parallel kernel Serial code Parallel kernel Thread Serial code
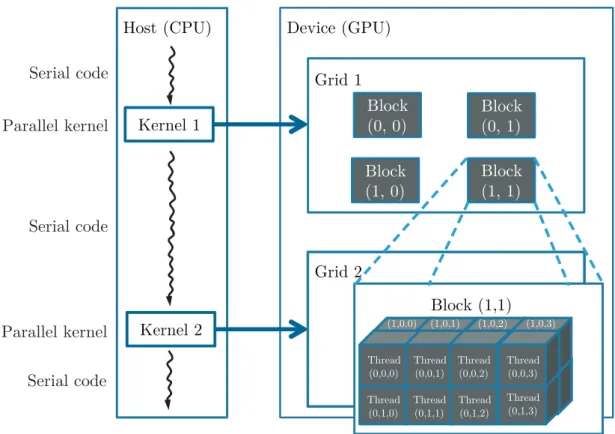
Figure 2.5: Execution of a CUDA program, using a multidimensional example of a CUDA grid organization. Adapted from [121].
2. BACKGROUND 2.4. Parallel Programming
2.4.2 CUDA
Compute Unified Device Architecture (CUDA) is a parallel computing architecture de-veloped by NVIDIA which allows the programmer to use the C programming language (besides the existence of other supported languages such as FORTRAN). CUDA pro-vides, at its core, three key abstractions — a hierarchy of thread groups, shared memo-ries, and barrier synchronization — that are simply exposed to the programmer as a set of language extensions. Furthermore, CUDA has already reached scientists throughout industry and academia [125].
The structure of a CUDA program reflects the coexistence in the computer of a host (CPU), which executes the sequential code, and one or more devices (GPUs), responsible for the execution of the parallelization (Figure2.5). The host launches the kernel, a mul-tithreaded program, in which the parallel task is executed. Kernels are like C functions that instead of being executed once they are executed N times in parallel by N differ-ent threads, which are grouped into a grid of blocks (thread hierarchy). There is a limit number of threads per block and the thread blocks are required to execute independently (must be possible to execute in an arbitrary order), which allows to boost the parallel factor of the GPUs.
The CUDA memory model mimics the hierarchy of the threads, it coordinates the memory access per-thread, per-block and per-grid, dividing the memory between grids, and structuring the memory spaces (Figure2.6). In this memory scheme, the global and constant memory can be written and read by the host (i.e. the host has full access). Global
Grid
Global Memory Block (0, 0)
Shared Memory
Thread (0, 0) Registers
Thread (1, 0) Registers
Host
Constant Memory Block (0, 0)
Shared Memory
Thread (0, 0) Registers
Thread (1, 0) Registers
2. BACKGROUND 2.4. Parallel Programming
memory is randomly accessible for reading and writing by all threads in the application, having the potential of traffic congestion (which prevents all but a few threads from mak-ing progress). Shared memory is an efficient means for threads to cooperate by sharmak-ing data and synchronizing their execution, coordinating memory accesses. Registers and shared memory are located on the GPU chip and can be accessed at very high speed in a highly parallel manner. However, global memory can store far more data and this data persists beyond the lifetime of the kernels. Local memory is allocated to threads for storing their private data. Each thread in this memory model can:
• Read/write per-thread registers.
• Read/write per-thread local memory.
• Read/write per-block shared memory.
• Read/write per-grid global memory.
• Read only per-grid constant memory.
In parallel programming, often all threads need to do their computation before pro-cessing the next phase of their execution. This is known as barrier synchronization (Fig-ure2.7) — point in the program where all threads stop and wait; only when all threads have reached the barrier, they can proceed. However, this ability to synchronize imposes execution constraints. Furthermore, CUDA does not allow barrier synchronization for threads in different blocks. In fact, this explains CUDA being able to execute blocks in any order — none of them have to wait for each other.
In CUDA, conflicts can arise when the same memory location is attempted to be writ-ten simultaneously by multiple threads. In such a case, only one thread succeeds in
Thread 0
Thread 1
Thread 2
Thread 3
Thread 4
Thread N-3
Thread N-2
Thread N-1
Time
2. BACKGROUND 2.4. Parallel Programming
the writing. In order to overcome this major issue, threads must use an atomic opera-tion (operaopera-tion that cannot be interrupted by concurrent operaopera-tions). The GPU processes conflicting atomic writes in a serial manner, avoiding data write problems.
An optimal performance with CUDA can only be achieved with a careful allocation of compute and storage resources. A first priority should be to parallelize as much sequen-tial code as possible. In order to minimize global memory access, GPU codes should use shared memory (e.g. by grouping threads into blocks such that threads work on common data). Constant memory can provide a faster access than global memory when memory is only read. However, for many applications it is not possible to avoid the use of global memory, being necessary to carefully coordinate memory accesses. Additionally, host– device memory transfer should be minimized for high-performance computing.
One concern with parallel programming is the reliability of memory operations. Par-ticularly, in medical physics, image reconstruction can be tampered due to errors intro-duced while reading or writing memory and therefore should be dealt with caution.
2.4.3 State of the Art of Image Reconstruction using Parallel Programming
Several studies have already demonstrated the efficacy of the GPU implementation of reconstruction algorithms. Iterative algorithms are computationally challenging, making GPU acceleration a need. Analytical algorithms are fully parallel whereas the iterative ones are essentially sequential. Thus, methods performing none or almost none com-putation within each iteration should not be implemented on the GPUs — insufficient parallel workload. This is the reason why, for instance, ART is not suitable for GPU (each iteration only processes a single projection line) but SART is. Besides SART, ML-EM and OS-EM, several other iterative algorithms were also adapted to the GPU, including the ordered-subsets convex algorithm [126], [127], and Total Variation (TV) reconstruc-tion [128], [129]. In [130] the authors show that their implementation of both analytical and iterative reconstructions in GPU for CT allow speed-ups of more than one order of magnitude and the quality of the image is comparable. Further, the state of the art of the relevant algorithms for this work is provided:
• SART.Kecket al.[131] implemented SART on the GPU using CUDA, obtaining a higher speed-up than 64.
• ML-EM. ML-EM was already implemented for DBT by Goddardet al. [132] on a GPU, in which they reported a 113-fold speed-up in processing time and verified that the high image quality was maintained. In [133], Schaaet al. accelerated ML-EM on multiple CUDA-enabled GPUs for DBT, reducing the execution time for eight iterations to less than 20 seconds.
3
Materials and Methods
The present chapter presents an overview of the main technical characteristics and the followed methodology in this dissertation. Firstly, the DBT system that was used is de-scribed in Section3.1. Then, in Section3.2an IDLR5implementation already developed
within the group, which is the basis of this work, is exposed, particularly the system matrix calculation that motivates the use of GPUs. In order to familiarize the reader with CUDA programming concepts, Section3.3 addresses this matter and provides the advantages of using GPU-accelerated libraries and development tools. Finally, a new DBT-based image reconstruction method is explained in Section3.4.
3.1
DBT System
The DBT system used in this work was the Siemens MAMMOMAT Inspiration (Fig-ure3.1) installed in Hospital da Luz (Departamento de Imagiologia), Lisbon, Portugal.
The Siemens MAMMOMAT Inspiration system enables both the acquisition of DBT and DM. In DBT, breast positioning and system operation do not change comparing to the DM system, which enables radiologists to easily adapt to the system. For the DBT acquisition, the X-ray tube arcs over the breast with an angular range of 50◦ (-25◦ to +25◦), the widest angle in the industry. It performs pulsed acquisition in the continuous
sweep, avoiding mechanical instabilities when compared to the step-and-shot method, and obtains 25 projections — approximately 2◦ angle increment per image — on a sta-tionary detector, each projection sizing 19.7 MB [136]. The radiation dose is equivalent to two incidences of mammography. Currently, the DBT acquisition takes approximately 20 s [137]. From the 25 projections it is then possible to reconstruct images 1 mm thick.
3. MATERIALS ANDMETHODS 3.1. DBT System
Figure 3.1: Siemens MAMMOMAT Inspiration [135].
The analytical reconstruction algorithms that are used in this system — FBP — take ap-proximately 60 s to reconstruct the 3D image, with a total file size of 2.1 GB for 60 mm thickness [136].
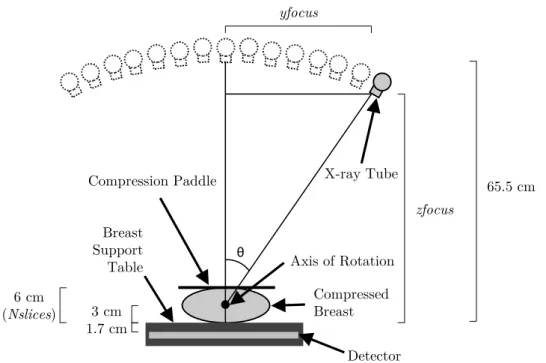
The exact geometry of the DBT system while performing the exam is essential for the reconstruction — Figure 3.2. Thus, the exact angle of each projection is measured on-line during the scan to be used in the reconstruction algorithm. The rotation center is 4.7 cm above the detector surface and the distance between the X-ray tube and the axis of rotation is 62.5 cm. The detector is an amorphous selenium flat panel with an array of 2816×3584 bins in which each bin has 85 µm×85 µm, rendering an active area of approximately 24 cm×30 cm.
This work uses the projections of a DBT examination of a 60 mm compressed breast. The 3D reconstructed image is intended to be 1 mm thick, thus the number of slices, N slices, is 60. The Field Of View (FOV) is defined as the volume irradiated by the X-ray source and its dimension is given by:
DetectorDimx ×DetectorDimy×N Slices= 2816×3584×60 (3.1)
3. MATERIALS ANDMETHODS 3.2. IDL Implementation
Axis of Rotation
Compressed Breast
X-ray Tube Compression Paddle
Breast Support Table
Detector
65.5 cm yfocus
3 cm 1.7 cm
zfocus
θ
6 cm (Nslices)
Figure 3.2: Diagram of the Siemens MAMMOMAT Inspiration system performing DBT. An X-ray source covers a 50◦arc (-25◦to +25◦,θ) emitting low-dose X-rays at 25 locations (in this image is only presented 15 locations for simplicity). Twenty five corresponding projections are acquired by the detector. The most relevant dimensions of the system are: 65.5 cm between the X-ray tube in the initial state (whenθ= 0◦) and the breast support
table, 3 cm between the axis of rotation and the breast support table and 1.7 cm between the breast support table and the detector. The compressed breast in this work is 6 cm and it is related with the number of slices in the 3D reconstructed image (N slices).yf ocusand zf ocusrepresent, respectively, the coordinatesyandzof the detector, both depending on θ. Adapted from [133].
3.2
IDL Implementation
An implementation for the DBT image reconstruction made in IDL is the basis of this work. IDL stands for Interactive Data Language and is a vectorized programming lan-guage used for data analysis, in which it is possible to transform complex numerical data into meaningful visualizations. IDL provides support for several operating systems, in-cluding MicrosoftR WindowsR6, MacR OS XR7and LinuxR8. IDL is commonly used in
the field of medical imaging [138]–[142] as it is a simpler and therefore easier program-ming language to be used by non-computer scientists when compared with, for example, CUDA and C which are both lower-level programming languages. IDL development re-quires the purchase of a license thus, the option to use GNU Data Language (GDL), a free alternative, was also taken into consideration but discarded due to the fact that it does
6Microsoft and Windows are registered trademarks of Microsoft Corporation in the United States and
other countries.
7
Mac and OS X are registered trademarks of Apple Inc., registered in the United States and other coun-tries.
3. MATERIALS ANDMETHODS 3.2. IDL Implementation
Figure 3.3: Schematic of the iterative image reconstruction algorithms for DBT applied to the IDL implementation.
not have yet every needed functionality.
The already existent IDL implementation in the research group provides a DBT re-construction with several algorithms: SART, ML-EM and OS-EM. The TV algorithm is also available in the IDL implementation which can be used in combination with each one of the other three as post-processing to minimize the noise. Every iterative algorithm in this implementation is according to the scheme presented in Figure3.3, in which the system matrix is calculated on the fly due to memory constraints.
IDL’s high-level language prevents programmers to know the details of the internal structures of a computer which can be an issue when one thinks about accelerating com-putational processes. IDL lets programmers avoid several difficult elements of low-level languages (e.g. memory management), but has the drawback to tend to run slower. In fact, compiled languages like C and CUDA have several advantages over interactive lan-guages, as compilers can often organize the object code so that it is optimized to execute very quickly. In this work, a simple IDL application is not a viable solution since the im-plementation of the DBT reconstruction requires optimisations that only lower-level lan-guages allow. Multi-threading capability is available in IDL [143] to accelerate specific numerical computations on machines with multiple processors (including binary and unary operators, array manipulation and type conversion routines), which was tested in this work for the already existent IDL implementation. However, when top-notch effi-ciency is required, developers are turning to the use of GPUs (despite its difficulty).
As seen in Sub-section2.4.1, two different APIs were considered (CUDA and OpenCL). With IDL, there is other possibility called GPULibR9 [144] which enables to access high
performance computing with minimal modifications to the existing IDL programs and without required knowledge about GPU programming. This possibility was disregarded
3. MATERIALS ANDMETHODS 3.2. IDL Implementation
for two different reasons: cost and maladaptation between the GPULib computing model and the algorithm used for the system matrix calculation. This led us to choose the most popular option: CUDA.
Multiple parts of the DBT iterative reconstruction process (Figure3.3) can be consid-ered when thinking about parallelization, mainly:
1. The system matrix calculation.
2. The forward projection.
3. The backprojection.
In this work the calculation of the system matrix, detailed in the next Sub-section, is parallelized using CUDA as it is the most computationally intensive part.
3.2.1 System Matrix Calculation
As noted in Section2.3, the system matrix describes the geometric model of the transmis-sion and detection processes being the very core of all iterative algorithms (regardless if algebraic or statistical). The system matrix calculation is independent of the type of iterative algorithm and depends only on the geometry of the DBT system.
y
x
A
B
d
5
X0
X1
X2
Y1
Y0
Y2
X3
X4
X5
Y3
Figure 3.4: Two-dimensional example on thexy plane of the ray driven approach. The −−→
AB ray intersects the horizontal (filled circles) and vertical (open circles) lines. d5
rep-resents the5thintersection length of the ray within the image — Euclidean distance
be-tween the points withx-coordinate X2 and X3. The extension to three-dimensional is
3. MATERIALS ANDMETHODS 3.2. IDL Implementation
The calculation of the system matrix in the IDL implementation uses a ray driven approach [145], [146]. This approach efficiently calculates the distances between inter-sections by following the path of each ray through the volume. Without loss of gen-erality, Figure3.4 illustrates a two-dimensional example (xy plane) of a single ray path with its intersections with the vertical and horizontal lines. An example of intersection length is shown by d5, the 5th intersection length of the ray within the image, which is
calculated through the Euclidean distance between the points withx-coordinateX2and
X3. The generalization to three-dimensional is straightforward as the ray from pointA (Ax, Ay, Az) to pointB(Bx, By, Bz) may be represented parametrically as
X(α) =Ax+α(Bx−Ax)
Y(α) =Ay+α(By−Ay)
Z(α) =Az+α(Bz−Az)
(3.2)
where0≤α≤1, being zero at pointAand unity at pointB.
The ray driven approach applied to the DBT system consists on drawing rays from each detector’s binito the X-ray beam focus, determining the intersections of each ray Ri with the FOV (Figure 3.5). The intersection lengths are then calculated, which after
normalization represent the relative contribution of the voxels to the attenuation of the corresponding ray. This means that, for a specificRi:
X
j
aij = 1 (3.3)
where aij is a system matrix element which gives the influence of the jth voxel in the
X-ray Tube
Detector’s Bin i
Ray i
Field Of View
Figure 3.5: Illustration of a rayi(Ri) from a detector binito the X-ray beam focus,
3. MATERIALS ANDMETHODS 3.2. IDL Implementation
ith ray. For each projection, a different system matrix is required so that it is possible to reproject or update with the correct model.
In order to compute the intersections, it is necessary to solve Equation3.2. For this process several specific geometric considerations of the system must be considered, mainly the position of each bin of the detector, pointA, and the position of the X-ray source focus, pointB.Ais calculated as follows:
Ax = (nx+ 0.5)×xbinsize
Ay = (ny+ 0.5)×ybinsize
Az =−17 mm
(3.4)
in whichxbinsize=ybinsize = 85µmandnx,ny ∈Nsuch that0≤nx < DetectorDimx and0≤ny < DetectorDimy. Regarding to the calculation ofB:
Bx=
DetectorDimx
2 ×xbinsize=
2816
2 ×0.085 mm = 119.68 mm
By =d1×sin(θ) +
DetectorDimy
2 ×ybinsize
= 625 mm×sin(θ) + 3584
2 ×0.085 mm = 625 mm×sin(θ) + 152.32 mm Bz =d1×cos(θ) +d2
= 625 mm×cos(θ) + 30 mm
(3.5) y x X-ray Tube Compressed Breast Detector’s Bin 0 (a) X-ray Tube Compression Paddle Breast Support Table Detector z y Compressed Breast Bins’ Row (b)
3. MATERIALS ANDMETHODS 3.2. IDL Implementation
whered1is the distance between the axis of rotation and the X-ray tube andd2 is the
dis-tance between the breast support table and the axis of rotation.Bxis constant throughout
the DBT acquisition which implies geometrical symmetry (Figure3.6). Thus, there is no need to calculate the system matrix on the right-half of thex-dimension. Therefore, every ray drawn from the bins with coordinates (Bx±xbin,ybin,0) are processed equally.
With the calculation of A and B it is now possible to find the intersections of the ray with the grid of voxels. Firstly, we assume thatRi always intersects a given axis (x,
y or z) when a point of the ray is equal to a natural number times the bin size along that direction. Secondly, for each intersection coordinate in an axis, the parameter αis calculated which allows to determine the coordinates of the remaining two axis. For instance, from Equation3.2for the intersections with thex-coordinate:
α= X(α)−Ax Bx−Ax
Y(α) =Ay+α(By−Ay)
Z(α) =Az+α(Bz−Az)
(3.6)
being α first calculated, followed by Y(α) andZ(α). Thirdly, the FOV dimensions are considered in order to remove extra intersections that occur outside of the FOV — the breast thickness to be reconstructed is much smaller than the detector to X-ray tube dis-tance, which results in obtaining many ray intersections in planes above the reconstruc-tion volume. Finally, the calculareconstruc-tion of the Euclidean distances between consecutive in-tersections is performed (N intersections lead toN −1 distances) and each distance is attributed to its specific voxel. In order to identify the voxel coordinates to which a dis-tance is associated, each ray is considered to be in the direction from the bin to the X-ray tube and the coordinates from the exit intersection of the voxel is considered. The ray
z
x
(a)
z
y
(b)
![Figure 2.1: Anatomy of the female breast [54].](https://thumb-eu.123doks.com/thumbv2/123dok_br/16542082.736779/28.892.149.705.143.503/figure-anatomy-of-the-female-breast.webp)
![Figure 2.6: CUDA memory model. Adapted from [121].](https://thumb-eu.123doks.com/thumbv2/123dok_br/16542082.736779/40.892.197.648.707.1099/figure-cuda-memory-model-adapted-from.webp)
![Figure 2.7: An example of barrier synchronization [121].](https://thumb-eu.123doks.com/thumbv2/123dok_br/16542082.736779/41.892.267.667.769.1096/figure-an-example-of-barrier-synchronization.webp)
![Figure 3.1: Siemens MAMMOMAT Inspiration [135].](https://thumb-eu.123doks.com/thumbv2/123dok_br/16542082.736779/44.892.211.640.129.611/figure-siemens-mammomat-inspiration.webp)