REPORT
Climatic and geologic controls on the piezometry
of the Querença-Silves karst aquifer, Algarve (Portugal)
Maria C. Neves1,2&Luis Costa1,3&José P. Monteiro1,3Received: 4 August 2015 / Accepted: 13 December 2015 / Published online: 5 January 2016 # Springer-Verlag Berlin Heidelberg 2015
Abstract Karst aquifers in semi-arid regions, like Querença-Silves (Portugal), are particularly vulnerable to climate vari-ability. For the first time in this region, the temporal structure of a groundwater-level time series (1985–2010) was explored using the continuous wavelet transform. The investigation fo-cused on a set of four piezometers, two at each side of the S. Marcos-Quarteira fault, to demonstrate how each of the two sectors of the aquifer respond to climate-induced patterns. Singular spectral analysis applied to an extended set of pie-zometers enabled identification of several quasi-periodic modes of variability, with periods of 6.5, 4.3, 3.2 and 2.6 years, which can be explained by low-frequency climate patterns. The geologic forcing accounts for ~15 % of the differential variability between the eastern and western sectors of the aqui-fer. The western sector displays spatially homogenous piezo-metric variations, large memory effects and low-pass filtering characteristics, which are consistent with relatively large and uniform values of water storage capacity and transmissivity properties. In this sector, the 6.5-year mode of variability ac-counts for ~70 % of the total variance of the groundwater levels. The eastern sector shows larger spatial and temporal heterogeneity, is more reactive to short-term variations, and is less influenced by the low-frequency components related to climate patterns.
Keywords Karst . Portugal . Spectral analysis . Continuous wavelet transform . Climate change
Introduction
The impact of climate variability on groundwater systems is central to the successful management and sustainability of water resources. The issue is even more important in semi-arid regions like the Algarve (Portugal), where climate models predict a progressive reduction in water availability during the 21st century, due to diminished precipitation and increased potential evapotranspiration (Santos and Miranda 2006). Strong changes in the seasonal distribution of precipitation, with a concentration of rainfall during the winter season and an increase in the frequency and intensity of droughts, in con-junction with warming, are expected to have a profound im-pact on water resources (Santos and Miranda 2006; Stigter et al.2011). In fact, a reduction in aquifer recharge of ~25 % is expected towards the end of the century in Mediterranean semi-arid areas, as shown by Stigter et al. (2014) for case studies in south Portugal, Spain and Morocco. Nonetheless, there is still limited knowledge on the potential consequences of climate variability on aquifer levels. In the Algarve, climate scenarios have been included in previous studies that exam-ined the influence of aquifer properties and the spatial and temporal distribution of recharge and abstraction on sustain-able yields (Hugman et al.2012;2013; Stigter et al. 2014). Climate projections were translated into hypothetical distribu-tions of recharge throughout the hydrological year (concen-trated versus spread) which were then input to a numerical groundwater flow model to produce forecasts. The consider-ation of these influences is appropriate for operconsider-ational deci-sions at seasonal to annual time scales, but neglects the long-term effects of climate variability.
* Maria C. Neves mcneves@ualg.pt
1
Universidade do Algarve, FCT, Campus de Gambelas, 8005 139 Faro, Portugal
2
Instituto Dom Luiz, Universidade de Lisboa, 1749-016 Lisbon, Portugal
3 Centro de Ciências e Tecnologia da Água, Universidade do Algarve,
Large-scale atmospheric and oceanic circulation patterns such as, for example, the El Niño Southern Oscillation (ENSO) and the North Atlantic Oscillation (NAO), are re-sponsible for several quasi-periodic modes of variability, with time scales varying from several years to several decades, that are partially coincident with low frequency oscillations ob-served in hydrologic time series (Dettinger et al.1998; Hanson et al. 2004; Dickinson et al. 2004; Gurdak et al. 2007; Holman et al. 2011; Tremblay et al.2011; Kuss and Gurdak2014). Previous studies on the influence of climatic patterns on water resources in Portugal have established a causal relationship between the NAO variability and the ob-served inter-annual variations of precipitation, river flow and surface water storage (Goodess and Jones2002; Trigo et al. 2004; Jerez et al.2013). Gámiz-Fortis et al. (2008) used sin-gular spectral analysis to identify the main oscillatory compo-nents in the streamflow series of the Douro, Tagus and Guadiana rivers. To the authors’ best knowledge, no similar studies have been published involving groundwater data from Portuguese aquifers. In fact, the links between groundwater levels and climate forcings remain largely unexplored in this region. This work presents the first analysis of piezometric levels in a karst aquifer in Portugal aiming to characterize the climate-induced variability.
Climate-induced variability is obviously affected by local geological conditions, particularly in karst aquifers like the Querença-Silves (QS), characterized by spatially heteroge-neous geomorphologic and hydrogeologic properties (Monteiro et al.2006; Hugman et al.2012). The contribution of internal (geologic) forcings to the spatio-temporal variabil-ity of piezometric levels in karst aquifers has been previously quantified in the Upper Normandy, France (Slimani et al. 2009; El Janyani et al.2012). As pointed out in those studies, a common feature of karst aquifers is the co-existence of a dual flow system, assisted by the fissured matrix (responsible for the capacitive function) and the conduit drainage network (responsible for the transmissivity function). In the QS aqui-fer, these properties have been mapped by inverse calibration of a finite element model (Monteiro et al.2006; Hugman et al. 2012; 2013), but their contribution to the variability of the aquifer water table remains to be determined. The primary goal of this study is to quantify the relative contributions of climate and geology to the spatial and temporal variance of the groundwater levels in this aquifer. These contributions are identified and evaluated by applying wavelet transform methods and singular spectral analysis to the groundwater time series.
Hydrogeological setting
The QS aquifer system (Fig.1a) is the largest (324 km2) and most important groundwater reservoir in the Algarve region
(south Portugal). This region has a temperate climate with dry summer (Csa Köppen classification), monthly average tem-peratures between 12 and 24 °C and a total annual rainfall of about 500 mm/year (1981–2010 climate normal). Most of the annual precipitation occurs during the 3-month winter season, while the summer months (June–August) are extremely dry, contributing to only 6 % of the annual precipitation (Miranda et al. 2002). As typically observed in southern Iberia, the precipitation in the study area is characterized by large values of inter-annual variability, with large disparities between wet and dry years (Santos and Miranda2006).
The QS aquifer is formed mostly by Early and Middle Jurassic (Lias-Dogger) carbonate sedimentary rocks, which span from the Arade River estuary (to the west) to the village of Querença (to the east). It is limited to the north by the Triassic-Hettangian rocks and to the south by the Algibre thrust, a major thrust in the Algarve Basin separating the lower and upper Jurassic formations (Monteiro et al.2006;2007and Terrinha1998). The stratigraphy of the Lias-Dogger forma-tion shows that the aquifer thickness increases from north to south, reaching average values of around 600 m (Manuppella et al.1993). The most important fault in the QS aquifer is the S. Marcos-Quarteira fault (Fig.1), which is a major regional structure inherited from the Variscan Orogeny. This NNW– SSE fault controlled the evolution of the Algarve basin during the Mesozoic, separating it into two blocks that evolved dif-ferently (Dias2001). The fault also plays an important role on the regional groundwater circulation, as it apparently divides the QS aquifer into two compartments with distinct hydrogeological behaviour. The compartments can be identi-fied from the spatial distribution of the piezometric isolines (Fig.1a). The region to the east of the fault is characterized by closely spaced isolines, corresponding to relatively high (~15 %) hydraulic gradients (Almeida1985), with an irregular contour pattern that is largely controlled by the topography. This pattern determines spatially varying groundwater flow directions, which are, on the whole, mainly directed towards the west. In contrast, the compartment to the west of the fault is characterized by small (~1.5 %) hydraulic gradients, smooth piezometric isolines and a predominant E–W flow direction. Given the evidence, the S. Marcos-Quarteira fault has been suggested to act as a low-permeability hydraulic barrier (Andrade1989; Almeida et al.2000).
The aquifer water balance has been thoroughly studied by several authors (e.g. Almeida 1985; Almeida et al. 2000; Vieira and Monteiro2003). The most recent studies obtained a detailed spatial distribution of recharge and estimated that the average annual recharge is 45 % (100 hm3year−1) of the rainfall (Oliveira et al. 2008; 2011). As a result of several monitoring and modelling studies, mainly carried out at the University of Algarve, the groundwater flow pattern of the QS is reasonably well known (e.g. Monteiro et al. 2003; Vieira and Monteiro2003). Groundwater abstraction in the region
has strongly decreased since the 1990s, due to the implemen-tation of a multi-municipal system of urban water supply based on dams. However, the historical piezometric records obtained by the available monitoring system do not display any important changes in the regional flow pattern, as inferred from the spatial distribution and temporal evolution of the observed hydraulic heads, which suggests that, in this aquifer, the impact of anthropogenic processes on groundwater level fluctuations has not been significant. The numerical groundwater flow model presented by Monteiro et al. (2006) was the first to focus on the calibration of the hydraulic parameters, in particular of the transmissivity (cor-responding to an equivalent porous media of a karst system). Stigter et al. (2009) performed simulations of hypothetical extraction scenarios in order to optimize a regional groundwater/surface-water integrated supply system, in which the distribution of the irrigation wells was refined according to their location. Attempts to synthesize the hydraulic behavior of the QS aquifer lead to the definition of 23 transmissivity zones (Fig.1b) estimated by inverse modelling (Hugman et al. 2012;2013). For each one of these zones, a reasonable fitting of field data is obtained using a single value of transmissivity. The discharge occurs mainly through a small number of large springs, called the Estômbar springs, located at the border of the aquifer with the Arade River (Fig.1b).
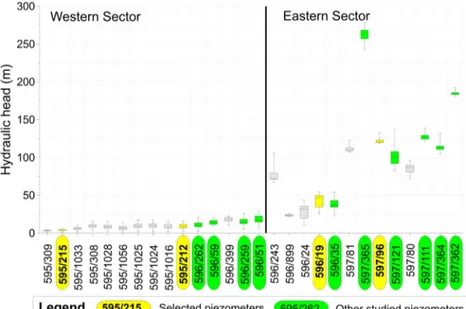
The different hydrogeological behavior in the east and west side of the S. Marcos-Quarteira fault becomes evident when the hydraulic head variations are plotted as a function of lon-gitudinal distance (Fig.2), considering all the 28 piezometers
in the area. The hydraulic head variations are not only larger as they are much more heterogeneous in the eastern sector of the aquifer. These observations provide a qualitative measure of the spatial variability of the system which is indeed much larger in the compartment to the east of the S. Marcos-Quarteira fault.
Data and methods
Time series data
In order to assess the climate forcing, the groundwater level records need to be long enough to capture inter-annual and inter-decadal fluctuations. The QS aquifer has few long-term records that fulfil this requirement, with 1984 being the starting year of the most complete (up to 2013) datasets. The piezometer selection criteria was primarily based on the length and completeness of the water level records, and only second-ly determined by their spatial location: two piezometers lie on the west side of the Quarteira fault (Alcantarilha and Silves) and other two on the east side (Benafim and Paderne). The locations are meant to represent the two kinds of hydrogeological conditions found in the QS aquifer. The monthly groundwater level time series span from January 1985 to December 2010 (26 years long) and were obtained from the Portuguese National System for Water Resources Information SNIRH site (Sistema Nacional de Informação de Recursos Hídricos (SNIRH 2015). Although outside the
Fig. 1 Location of the Querença-Silves aquifer and the S. Marcos-Quarteira fault (red line) which divides the aquifer into two sectors. a Location of the four piezometers selected for analysis and the terrain elevation. The average piezometric isolines are computed from the average hydraulic head observed at the total 28 piezometers using the krigging linear method of interpolation. b Location of the Estômbar springs, among others, the stream network and the equivalent transmissivity distribution of the aquifer as calculated by Hugman et al. (2012)
main scope of this report, the relation between precipitation and groundwater level is succinctly explored using one rain-fall station (Messines). Monthly precipitation data for this sta-tion were also obtained from the SNIRH site, but the available data only spans from January 1985 to December 2009.
Time series analysis
The groundwater time series were investigated using several analytical techniques in order to characterize the temporal structure and the periodic components of their signal. The applied methods were: (1) computation of autocorrelation functions, (2) simple spectral analysis, (3) continuous wavelet transform and (4) singular spectral analysis. Each technique has its own purpose and advantages and their combination provides a more robust estimate of the statistical properties of the aquifer regarding its groundwater level variability. Typical pre-processing steps such as searching for outliers, interpolation for estimating missing values, detrending and normalization by standard deviations were carried out before the analysis.
1. Autocorrelation functions represent the linear dependence of an event on the subsequent values of the time series, and thereby are usually computed to quantify the memory effect. The auto-correlogram is the plot of the correlation of a time series with itself after being shifted by increas-ingly larger time intervals (lags). The time lag correspond-ing to an autocorrelation coefficient of 0.2 is referred to as the memory effect (Mangin1984). Although some au-thors argue that the memory effect should be inferred from the slope (rate of decrease) of the auto-correlogram (Massei et al.2006), rather than from a single value such
as 0.2, the two approaches applied to the QS dataset lead to identical conclusions.
2. Simple spectral analysis is classically used to obtain the energy spectrum, a plot of the variance of a time series as a function of wavenumber or frequency. It is calculated from the Fourier transform of the autocorrelation function normally using a windowing function to reduce spectral leakage. One of the advantages of simple Fourier spectral analysis is that it allows to visualize the global statistics of the time series in terms of scale invariants regimes (e.g. Mandelbrot 1982; Lovejoy and Schertzer 2013). Multifractal behavior can be identified when the log-log plot of the energy spectrum can be broken in more than one interval (range of frequencies), each interval being fitted by a straight line with a different slope (power law exponent). There is a growing body of evidence showing that groundwater levels may show scale-invariant, or frac-tal, behavior over a wide range of time scales (e.g. Zhang and Schilling2004; Little and Bloomfield2010; Liang and Zhang2013). Given the time scale of this study it seems appropriate to investigate if there is one scaling regime in the low frequencies, representing the response to long-term climate variations, and another on the high frequencies, representing the short-term response to the meteorological conditions.
3. A comprehensive review of the applications of the wave-let transform in hydrology time series has recently been made by Sang (2013). This study uses the continuous wavelet transform (CWT) in order to further explore the temporal structure of the groundwater level records. In contrast with classical Fourier analysis, which implicitly assumes that the underlying physical processes are sta-tionary, the CWT is suited to the analysis of signals that have temporal variations in both amplitude and frequency.
Fig. 2 Box and whisker plot of the available piezometric level (m a.s.l.) data between 1985 and 2010. The 28 piezometers on the x-axis are arranged according to their longitudinal distance to the westernmost observation point (Estômbar spring). The black vertical thick line represents the location of the S. Marcos-Quarteira fault. The edges of the boxes are the 25th and 75th percentiles, and the whiskers extend to the minimum and maximum observed groundwater levels
Its main advantage over classical spectral methods is that it is able to reveal the time evolution of the dominant modes of variability, being as such specially tailored for the detection of localized or intermittent events. The CWT is defined as the convolution of the signal with a scaled and translated version of the wavelet function (Daubechies1990). The method is implemented using the Morlet wavelet and the algorithm described in Torrence and Compo (1998). In the case of the Morlet wavelet, the scale and the equivalent Fourier period are practically identical, so the two terms are used synony-mously. The wavelet spectrum, defined as the absolute value squared of the wavelet transform, is constructed to display the distribution of the variance of the time series at each scale, as a function of time. A clear picture of the net changes in variance over the whole recording period is provided by the global wavelet spectrum, which is a time average of the wavelet spectrum.
4. The singular spectral analysis (SSA) is a form of principal component analysis that is used to detect periodic signals and extract the dominant frequencies in short and noisy time series. Following the methods outlined by Dettinger et al. (1995) and Hanson et al. (2004), this technique is applied to decompose the detrended and normalized groundwater level records into principal components (eigenvalues) that represent the projection of the original time series onto empirical orthogonal functions (eigen-vectors). The calculations are carried out by diagonalizing a lagged covariance matrix (Vautard et al.1992; Ghil et al. 2002). The main advantage of SSA is that it allows the reconstruction of the original record using a lin-ear combination of the most statistically significant oscillations. Hanson et al. (2004) showed that the variability in most hydrological time series can be described in terms of the first 10 reconstructed com-ponents (RCs). In this study the chi-square signifi-cant test is applied to isolate the most signifisignifi-cant reconstructed components of the variability modes, and then compute their relative contribution to the total variance of the time series.
The relation between groundwater level and monthly precipitation in the QS area is examined using both linear regression, with a two-tailed significant t test at the 95 % confidence level, and lag correlation analysis. First, the monthly precipitation times series needs to be transformed into cumulative departures, detrended and normalized using the methods described by Hanson et al. (2004). The lag correlation analysis, which gives the correlation coeffi-cient as a function of the lag between the two time series, allows identifying the lag of maximum correlation between the causal process (precipitation) and the system response (groundwater level).
Results
The four raw piezometric time series are displayed in Fig.3 and their main statistical parameters are summarized in Table 1. All piezometers show annual fluctuation superimposed on multi-year periods of high and low ground-water level stands. On the long-term (over 26 years), all pie-zometers show slight negative tendencies on the mean groundwater level, the most significant (−0.018 m/month) be-ing found in Alcantarilha and Paderne. This long-term trend is in agreement with an important, but not statistically signifi-cant, decrease in the regional average total precipitation ob-served in Portugal in the period 1976–2007 (De Lima et al. 2014). The most striking observation is the clearly distinct oscillatory pattern in the western and eastern sectors of the aquifer. Alcantarilha and Silves, in the western sector, present similar regular fluctuations with smoother piezometric varia-tions, while Benafim and Paderne, in the eastern sector, dis-play relatively heterogeneous and sharp head variations, with fast rise and recession events. The eastern compartment of the QS aquifer is thus characterized by a relatively higher tempo-ral and spatial variability than its western counterpart.
Figure 4a shows the raw monthly precipitation data recorded at the Messines rainfall station, which lies exactly in between the two sectors. After transforming the raw precipitation data into monthly cumulative de-partures (Cdep) the linear regression analysis between Cdep and the groundwater level time series (truncated for the 1985–2009 period) was performed for each one of the four selected piezometers. The obtained linear regression coefficients vary between 0.6 and 0.75 re-vealing that, despite the local geological complexities and other potential perturbing factors, there is a strong positive correlation between the groundwater levels and the rainfall in the two sectors of the aquifer. The re-sults of the lag correlation analysis indicate that the time lag of maximum correlation is 1 month in both sectors (Fig. 4b).
The east–west split in hydrogeological behavior of the QS aquifer is confirmed in quantitative terms in several ways. A first quantitative estimate of the timescale of the natural atten-uation, or filtering properties of the aquifer, is provided by the autocorrelograms (Fig. 5). The so-called memory effect ob-tained using this method is 15–16 months in the western sector (Alcantarilha and Silves) and 11–13 months in the eastern sector (Benafim and Paderne). The longer memory effect that characterizes Alcantarilha and Silves is consistent with the smoother variations of the hydraulic head observed in Fig.3. Longer memory effects, which denote high inertia to changes and low-pass filtering properties, often reflect thick surficial formations (longer times of recharge) or significant amounts of water storage/volume in the karst network. In the QS aqui-fer, the longer memory effects in the western compartment are
mainly attributed to larger water storage capacities that have been recognized in this sector in previous studies (e.g. Hugman et al.2012).
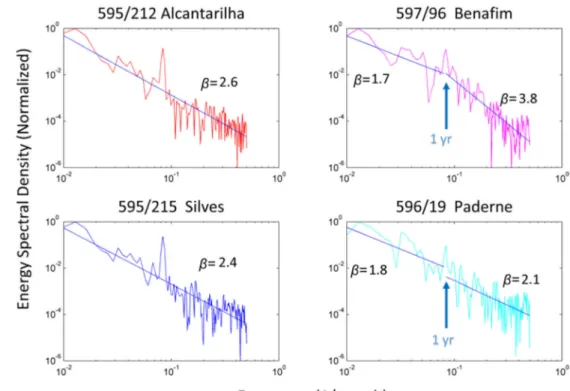
The simple spectral analysis of the four piezometric records (Fig.6) reveals relatively consistent peak frequencies corre-sponding to cycles of 1, 4.3 and 6.5 years. In the eastern sector there is also a peak at 2.5 years, which is not observed in the west. The peaks in the spectrum indicate that a significant amount of the variance of the groundwater level record is contained in these frequencies. The sharpest peak is associated with the annual precipitation cycle (1/12 month frequency). The multi-annual periodicities are related to low-frequency climate signals and will also emerge from the continuous wavelet transform and singular spectrum analysis methods. Their association with large-scale climate teleconnections pat-terns have already been recognized in other Mediterranean aquifers (e.g. Andreo et al. 2006; Massei et al. 2007; Luque-Espinar et al.2008; Slimani et al.2009) and will be analyzed in more detail in the next section.
Figure6also enables the definition of scaling regimes by fitting the energy power spectra with an empirical power law with exponentsβ. In Alcantarilha and Silves, the spectral slope remains unchanged on both sides of the annual peak,
that is, there is only one scaling regime, withβ = 2.4–2.6. In general, the lower the magnitude of the spectral exponent, the higher the variability in the data. As the magnitude of theβ exponent is similar in these two piezometers, these results quantitatively demonstrate that a similar amount of variability is present in Alcantarilha and Silves. In contrast, in Benafim it is possible to detect two scaling regimes, with the break oc-curring at the 1/12 month frequency. In this case, it is possible to separate the short-term response to intermittent meteorolog-ical conditions from the low frequency response to multi-annual climate variations. The scaling behavior of Paderne is not clear. It is similar to Benafim in the long-term range, but in the short-term, like the two piezometers in the western sector, it lacks a distinctive response to high-frequency variations. The difference between the energy power spectra of Benafim and Paderne, despite being in the same sector, re-flects the compartmentalized structure of this part of the Aquifer. Benafim, at relatively high elevation—182 m above sea level (m a.s.l.)—is an upstream site, whereas Paderne (44 m a.s.l.) is close to a spring outlet that defines one of the downstream boundaries of the groundwater basin. The eastern sector is indeed subdivided into a large number of more or less independent units, which result from limitations on flow paths
Fig. 3 Monthly groundwater levels at four piezometers from the two main sectors of the Querença-Silves aquifer: Alcantarilha and Silves (western sector) and Benafim and Paderne (eastern sector)
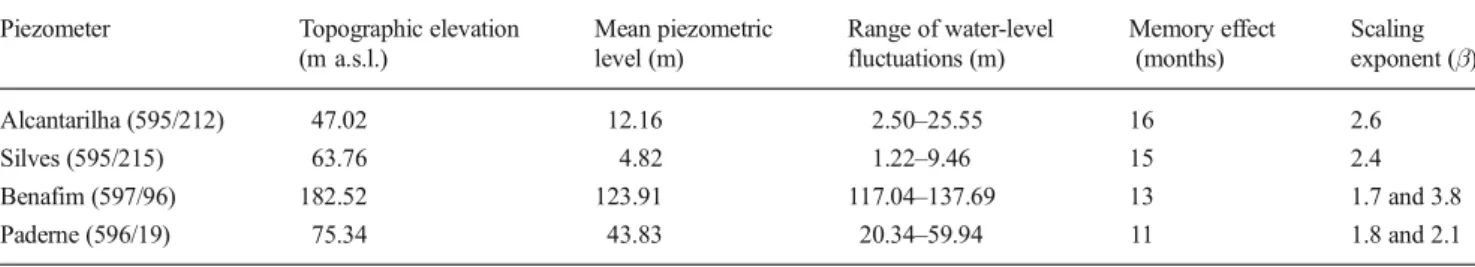
Table 1 Summary of hydrologic and statistical parameters of the data (1985–2010) Piezometer Topographic elevation
(m a.s.l.) Mean piezometric level (m) Range of water-level fluctuations (m) Memory effect (months) Scaling exponent (β) Alcantarilha (595/212) 47.02 12.16 2.50–25.55 16 2.6 Silves (595/215) 63.76 4.82 1.22–9.46 15 2.4 Benafim (597/96) 182.52 123.91 117.04–137.69 13 1.7 and 3.8 Paderne (596/19) 75.34 43.83 20.34–59.94 11 1.8 and 2.1
generated by stratigraphic and lithologic factors and a less developed karst when compared with the western sector.
The normalized wavelet power spectra of the groundwater levels, computed using the continuous wavelet transform method, are displayed in Fig.7. Each diagram depicts the temporal distribution of the power (variance) of the time series
as a function of period, over the 26 years of analysis, in a color scale that goes from blue (minimum) to brown (maximum). The 5 % significant levels, computed using a chi-square test against a red noise spectrum as the null hypothesis, are displayed as white contours. Also shown is the cone of influ-ence (black parabolic lines) which delimits the regions where
Fig. 4 Relation between precipitation and groundwater levels. a The monthly precipitation at the Messines rainfall station. b The monthly values of normalized residuals of cumulative departure of precipitation and the normalized residuals of groundwater level at Alcantarilha and Benafim lagged 1 month
Fig. 5 Autocorrelation functions of the four piezometric time-series (total window of 312 months and lag step of 1 month) truncated in the 0–80 lag range
the edge effects, due to zero padding, make the results less reliable. The comparison of the four spectra immediately ex-poses the east–west division of the aquifer. The most
remarkable difference between the two sectors occurs in the 2–4-year band. These modes of variability are intermittently quite important in the east, the most extreme example being
Fig. 6 Energy (power) spectra of the four groundwater level records in a log-log plot. The slopes of the lines, computed from linear regression, corre-spond to estimates of the empiricalβ exponents defining scaling regimes
Fig. 7 Local wavelet power spectrum of the four time-series computed using a Morlet wavelet and normalized by 1/σ2. The white contours enclose regions of greater than 95 % confidence levels. The black lines delimit the cone of influence, where zero padding has reduced the variance
the peak at ~2.5 years located in Paderne and centered on 1996. The presence of these modes of variability in the east, but not in the west, is discussed in the next section.
Despite the local differences, the most important aspect that emerges from Fig.7is the power concentration in the 5–13-year band, within the 95 % confidence interval, present at all sites. The 5–13-year variance can be mainly attributed the North Atlantic Oscillation (NAO) which is the dominant mode of atmospheric variability at mid-latitudes in the North Atlantic. The spectrum of the winter (December–March) NAO index, is indeed characterized by a slightly enhanced power in the 6–10 year band, particularly on the last quarter of the 20th century (Hurrell and Van Loon1997; Hurrell et al. 2003). At smaller scales, with less amounts of energy, one can observe several scattered peaks at periods of 1 year. The stron-gest patches occur in 1990, 1996 and 2000, which were anom-alously wet years (Miranda et al.2002). It is also interesting to note the strong attenuation of power, or lack of variance, in the 1–2-year band centered on 2004, but extending for almost a decade in the western sector. This anomaly is attributed to the outstanding drought that affected the Iberian Peninsula in 2004–2005 (García-Herrera et al.2007).
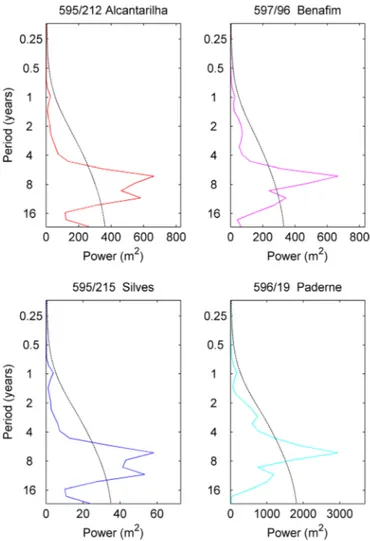
Figure8displays the time-averaged wavelet spectrum over the whole period (26 years) of record, the so-called global wavelet spectrum, computed using the method described in Torrence and Compo (1998). When averaged over time only two variability modes have enough persistence and amplitude to remain statistically significant. The first and more conspic-uous has a period of 6.5 years. The second, with a period of 11–13 years, is also statistically significant at the 5 % level at three (Alcantarilha, Silves and Benafim) of the four sites.
The relative contribution of the 6.5-year mode of variability to the total variance of the time series, along with other leading modes, has been computed using the singular spectral method. The SSA was applied on the lagged-covariance matrix based on the Vautard et al. (1992) algorithm, using an M = 60 month window length, which is approximately 1/5 of the time series length, as recommended by Ghil et al. (2002). The oscillatory modes derived from the SSA corresponding to the first six empirical orthogonal functions (EOFs), are listed in Table2 for Alcantarilha and Benafim. These are enough to represent the western and eastern sector of the aquifer, respectively, since the EOFs of Silves and Paderne (not shown) are the same. EOFs 1 and 2, as well as EOFs 5 and 6 in Alcantarilha, and EOF 4 and 5 in Benafim, are in quadrature. The most robust result is the persistence of the first EOF pair, corresponding to the 6.5 years periodicity, over the whole aquifer. The other leading scales of variability correspond to a set of oscillations with associated periods of 4.3 years (EOF 3), 3.2 years (EOF 4) and 1 year (EOFs 5–6) in Alcantarilha, and 13 years (EOF 3), 2.6 years (EOFs 4–5) and 2 years (EOF 6) in Benafim. Overall, these results are in agreement with those found using the simple spectral analysis and the
continuous wavelet transform. The amount of variance attrib-uted to the 6.5-year mode of variability (EOFs 1–2) is approx-imately 70 % in the western sector (73 % in Alcantarilha and 68 % and Silves). In the eastern sector, the same components explain approximately 55 % of the total variance (59 % in Benafim and 52 % in Paderne). The contribution of the annual cycle component to the total variance is approximately 7 % in both sectors (EOFs 8–9 in Benafim, not shown).
The reconstruction of a set of significant components, the reconstructed components (RCs), is carried out by linearly combining the EOFs and the principal components. The RCs have the property of capturing the phase of the time series and can be superimposed with the original data on the same timescale. Here, only the most important EOF pairs in each one of the piezometers are used: 1–2 and 5–6 in Alcantarilha, and 1–2 and 4–5 in Benafim, (Fig.9). In the terminology of Ghil et al. (2002) each of these two RCs form the robust skeleton of the Lorenz attractor (Lorenz1963). The composite of selected RCs contain 80 and 70 % of the total variance of the groundwater level record, in Alcantarilha and Benafim, respectively. The low frequency components (RCs 1–2 and RCs 4–5) show substantial amplitude modulation. The ampli-tude of the 6.5 years oscillation progressively decreases to-wards the end of the recording period (after year 2000). The amplitude of the 2.6 years component, in Benafim, is much more irregular but also slightly decreases after year 2000. This result is consistent with the wavelet power spectra (Fig.7) which clearly shows that the power concentration in the 5– 13-year band is much weaker in the 21st century than before. Although this band is inside the cone of influence after year 2005, the SSA analysis confirms that these low frequency periodic oscillations have been losing strength in recent years. These results also demonstrate the complementarity of the SSA and continuous wavelet transform methods.
Discussion
Climate forcing
The North Atlantic Oscillation (NAO) is the main large-scale phenomenon controlling winter precipitation over the western Iberian Peninsula (Hurrell and Van Loon 1997; Trigo et al. 2002). Its impact on river flow regimes, with obvious conse-quences for all water resources in the region, has been thor-oughly assessed in recent years (e.g. Trigo et al.2004; Gámiz-Fortis et al. 2008; Lorenzo-Lacruz et al.2011; Jerez et al. 2013). A singular spectral analysis carried out to isolate the main oscillatory components of the streamflow series of the main Iberian Peninsula international rivers (Douro, Tejo, and Guadiana) revealed modulated amplitude oscillations with as-sociated periods in the bands 2–3, 4–5, and 6–8 years (Gámiz-Fortis et al. 2008). The winter Guadiana series (south
Portugal), in particular, was found to be represented by a model containing a decadal variability with a set of oscilla-tions with associated periods of 2, 4.5, 6.5, and 3.4 years, which are remarkably similar to the periods found during this study in the QS aquifer. However, caution is required in ana-lyzing these results as the relation between the NAO and the surface climate has been shown to be non-stationary (Vicente-Serrano and López-Moreno2008).
The NAO index, on the other hand, can be broken down into some modulated amplitude oscillations with periods around 4.8, 7.7, and 2.4 years, along with nonlinear trends (Gámiz-Fortis2002). When trying to match the NAO index and the streamflow main modes of variability in Iberia, previ-ous studies found common oscillations at 7.7 and 4.8 years, but suggested that the overall relationship between the NAO and streamflow is complex and nonstationary (Gámiz-Fortis et al.2008). The complexity was attributed to the role played by other climate variables such as temperature and wind, which have a direct effect on evapotranspiration but are not so clearly related to the NAO. Moreover, it has been recog-nized that the average monthly and seasonal precipitation in the Iberian Peninsula, although mainly influenced by the NAO, also depends on other teleconnections such as the
Scandinavian and Eastern Atlantic patterns (Trigo et al. 2008; Espírito Santo et al.2013).
Groundwater levels have a more complex relation to pre-cipitation than river flow. For example, models of time-varying climate controls on groundwater recharge have shown that groundwater responds more strongly to the comparatively slow trends associated with low frequency climate fluctua-tions than to isolated climate extremes (Dickinson et al. 2004; Dettinger and Earman2007). The relationship between
Fig. 8 Global (or time averaged) wavelet spectrum of the groundwater level records (solid line) as a function of period. The dashed line is the 5 %
significance level, assuming a corresponding red noise process. The power amplitude (σ2) is proportional to the amplitude of the hydraulic head variations in each piezometer
Table 2 Comparative results of the SSA in the western/eastern sectors of the aquifer
EOF (595/212) Alcantarilha (west) (597/96) Benafim (east) Period (years) Variability (%) Period (years) Variability (%)
1 6.5 43 6.5 34 2 6.5 30 6.5 25 3 4.3 8 13 7 4 3.2 5 2.6 6 5 12 4 2.6 6 6 12 3 2 5
groundwater level fluctuations and low frequency (inter-annu-al to multi-decad(inter-annu-al) atmospheric circulation systems has been intensively investigated in recent years (e.g. Gurdak et al. 2009; Holman et al. 2011; Tremblay et al.2011; Kuss and Gurdak2014). In the south of the Iberian Peninsula, periodic-ities of 2.5 and 5 years were reported in a study that focused on the relation between rainfall, temperature and outflow of a karst spring from the Sierra de las Cabras carbonate aquifer, near Gibraltar (Andreo et al.2006). Spectral methods applied to a set of 53 piezometer time series from the Vega de Granada alluvial aquifer, along with rainfall, temperature and river flow data, also identified cycles of 8–11 and 3.2 years (Luque-Espinar et al.2008). In both cases, the authors argued for a clear correlation between the NAO index and the low frequen-cy hydraulic head variations. Another study in a karst aquifer, this time in the Upper Normandy (France), detected the same frequencies, 2–3 and 6–7 years, in piezometric levels (Slimani et al.2009). The results from this study, especially the wavelet power spectra (Fig.7), are remarkably similar to the results of Slimani et al. (2009), most likely because this study analyzed a similar time span (in the Slimani et al. case, 1985–2005). The evidence thus suggests that the 3.2, 4.3, 6.5, and 2.6-year oscillations identified in the QS aquifer are driven by natural recharge rates associated with the NAO climate cycle. The full demonstration of this relation is nonetheless outside the scope of this study.
Geologic forcing
Once the climate forcing has been identified, the question now is to determine the extent to which the geologic factors filter the climate-induced oscillations in the groundwater levels. This section aims to explain the distinct behavior of the pie-zometers in the face of a common climatic input, focusing on the differences between the eastern and western sector of the aquifer. According to the results, the most important differ-ences between the two sectors are: (1) in the western sector the
groundwater level response is spatially homogenous, the memory effects are larger, the high-frequency content is fil-tered out and there is only one scaling regime, meaning there is no distinctive response to short-term variations; (2) in the eastern sector there is greater spatial variability in hydraulic head variations, and there is, at least in some piezometers, two scaling regimes, implying that there is a noticeable response to short-term meteorological conditions. There is also a 2.6-year mode of variability in the eastern sector, probably related to the frequency of depressions and frontal systems affecting western Iberia in connection with the NAO, which was not detected in the western sector.
All these observations are consistent with the regional flow pattern model developed for the QS aquifer (Monteiro et al. 2006;2007; Stigter et al.2010; Hugman et al.2012;2013). The spatial distribution of the porous-karst media equivalent transmissivity in the aquifer has been obtained in previous studies using inverse calibration of finite element model pre-dictions against piezometric and discharge data (Hugman et al. 2012), and considering both autogenic and allogenic recharge (Salvador et al. 2012). In the western sector, the models show a regular distribution of high transmissivity values, indicative of a well-developed karst conduit network that supports high rates of water flow. The main region of water storage, with relatively large storage coefficients, also occurs in the western sector of the aquifer (Hugman et al. 2012). Together, these two properties (high transmissivity and large storage capacity) make the western sector more re-silient to short-term climate-induced variations. In contrast, the eastern sector of the aquifer is characterized by compara-tively less efficient water storage and water transport, owing to the less-developed and discontinuous nature of the karst con-duit network. This explains why the eastern sector is less sensitive to the long-term climate oscillations and more reac-tive to the short-term meteorological conditions. Thus, it be-comes apparent that the 2.6-year periodic oscillations, which are probably related to stormy episodes, have not enough
Fig. 9 Partial reconstruction of the groundwater level records in Alcantarilha, based on EOFs 1–2 (6.5-year cycle) and EOFs 5–6 (1-year cycle) and Benafim, based on EOFs 1–2 and EOFs 4–5 (2.6-year cycle). The black line is the original data and the red line is the composite of the reconstructed components (cRCs)
amplitude to affect the western sector (with large volumes of stored water) but are sufficient to impact the relatively deplet-ed eastern sector of the aquifer.
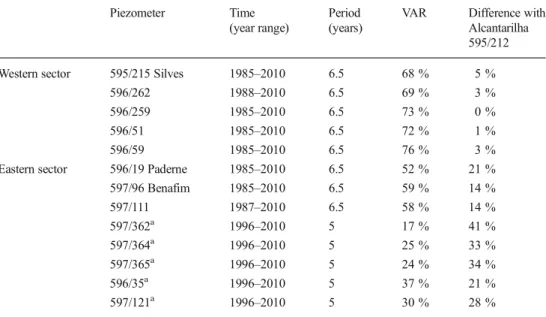
A quantitative measure of internal variability due to geo-logical filtering can be obtained by comparing the contribution of the different modes of variability to the total variance of the groundwater levels (Table 2). For instance, comparing Alcantarilha and Benafim, there a difference of 14 % in the contribution of the 6.5-year mode of variability. The differ-ence in the 2.6-year mode contribution is also of that order of magnitude (12 %). In order to further assess the spatial distri-bution of the geological filtering, the SSA analysis was ex-tended to another 10 piezometers in this aquifer (Table3). Only five of them have records in the time span analyzed so far (1985–2010) and, in this subset, the 6.5-year periodic com-ponent is also significant. The difference in variability with respect to the Alcantarilha piezometer, taken as the reference and considering the same time interval, emphasizes the uni-formity of the response in the western sector. It also confirms the existence of a systematic difference of 15–20 % that can be attributed to geological filtering between the eastern and west-ern sectors of the aquifer. The analysis in the remaining five piezometers (at the bottom of the column) is restricted to the 1996–2010 interval and to the eastern sector. In this time in-terval the SSA indicates a shorter periodic component (5 years) and an even larger spatial variability due to geologic factors.aRestricted to the 1996–2010 interval and to the east-ern sector
Conclusions
The analysis of groundwater time series from the Querença-Silves aquifer, using simple spectral analysis,
continuous wavelet transform and singular spectral anal-ysis, revealed the presence of consistent inter-annual periodicities. The main mode of variability having enough persistence and amplitude to remain statistically significant over the analyzed time interval (1985–2010) corresponds to a period of 6.5 years. Other leading modes of variability correspond to oscillatory compo-nents with periods of 4.3, 3.2 and 2.6 years. A similar set of oscillations has been found in the surface flow of the Guadiana River time series in previous studies, sug-gesting that they have a common climatic origin related to the North Atlantic Oscillation. The differences in the temporal variability of hydraulic head variations are interpreted as a result of geologic forcing. The time series exhibit two distinctive types of modulation of the climate signals, showing that the aquifer is effective-ly divided in two distinct sectors by the S. Marcos-Quarteira fault. The region to the west of the fault is characterized by spatially homogenous periodic oscilla-tions, larger memory effects and only one scaling re-gime. These properties are attributed to a better devel-oped and connected flow network, which in conjunction with a greater water storage capacity, make this part of the aquifer more resilient to short-term variations. The region to the east of the fault is more reactive to high frequency variations and shows a greater spatial and temporal variability in groundwater levels. The results are consistent with previous estimates of hydrogeologic properties (transmissivity and storage capacity) in the region. The 6.5-year mode of variability contains ~70 % (55 %) of the total variance of the groundwater level in the western (eastern) sector of the aquifer. The geologic forcings then account for ~15 % of the differ-ential response among the two sectors.
Table 3 Main mode of variability and contribution to the total variance (VAR) for an extended set of piezometers. Measure of geological variability relative to the Alcantarilha record. The analysis in the five piezometers presented in italic is restricted to the 1996–2010 interval and to the eastern sector
Piezometer Time (year range)
Period (years)
VAR Difference with Alcantarilha 595/212 Western sector 595/215 Silves 1985–2010 6.5 68 % 5 %
596/262 1988–2010 6.5 69 % 3 %
596/259 1985–2010 6.5 73 % 0 %
596/51 1985–2010 6.5 72 % 1 %
596/59 1985–2010 6.5 76 % 3 %
Eastern sector 596/19 Paderne 1985–2010 6.5 52 % 21 % 597/96 Benafim 1985–2010 6.5 59 % 14 % 597/111 1987–2010 6.5 58 % 14 % 597/362a 1996–2010 5 17 % 41 % 597/364a 1996–2010 5 25 % 33 % 597/365a 1996–2010 5 24 % 34 % 596/35a 1996–2010 5 37 % 21 % 597/121a 1996–2010 5 30 % 28 %
Acknowledgements This research contribution is supported by the FCT project IDL-FCT-UID/GEO/50019/2013. The research leading to these results has also received funding from the European Union Seventh Framework Programme (FP7/2007‐2013) under grant agreement No. 619120 (Demonstrating Managed Aquifer Recharge as a Solution to Wa-ter Scarcity and Drought– MARSOL). We thank the constructive com-ments of two anonymous reviewers that helped to improve the manuscript.
References
Almeida C (1985) Hidrogeologia do Algarve Central [Hydrogeology of the central Algarve]. PhD Thesis, Universidade de Lisboa, Portugal Almeida C, Mendonça JL, Jesus MR, Gomes AJ (2000) Sistemas Aquíferos de Portugal Continental [Aquifer Systems in Continental Portugal], Relatório INAG, Instituto da Água, Lisbon Andrade G (1989) Contribuição para o Estudo da Unidade
Hidrogeológica Tôr-Silves [Contribution to the study of Tôr-Silves Hidrogeologic unit]. PhD Thesis, Universidade de Lisboa, Portugal Andreo B, Jiménez P, Durán JJ et al (2006) Climatic and hydrological variations during the last 117–166 years in the south of the Iberian Peninsula, from spectral and correlation analyses and continuous wavelet analyses. J Hydrol 324:24–39. doi:10.1016/j.jhydrol.2005. 09.010
Daubechies I (1990) The wavelet transform time-frequency localization and signal analysis. IEEE Trans Inf Theory 36:961–1004 De Lima MIP, Santo FE, Ramos AM, Trigo RM (2014) Trends and
correlations in annual extreme precipitation indices for mainland Portugal, 1941–2007. Theor Appl Climatol 119:55–75. doi:10. 1007/s00704-013-1079-6
Dettinger M, Earman S (2007) Western ground water and climate change: pivotal to supply sustainability or vulnerable in its own right? Ground Water 4(1):4–5
Dettinger MD, Ghil M, Strong CM et al (1995) Software expedites singular-spectrum analysis of noisy time series. Eos Trans Am Geophys Union 76(12):14–21
Dettinger MD, Cayan DR, Diaz HF, Meko DM (1998) North–south pre-cipitation patterns in western North America on interannual-to-decadal timescales. J Climate 11:3095–3111
Dias RP (2001) Neotectónica da Região do Algarve [Neotectonics of the Algarve Region]. PhD Thesis, Universidade de Lisboa, Portugal Dickinson JE, Hanson RT, Ferré TPA, Leake SA (2004) Inferring
time-varying recharge from inverse analysis of long-term water levels. Water Resour Res 40:W07403. doi:10.1029/2003WR002650 El Janyani S, Massei N, Dupont J-P et al (2012) Hydrological responses
of the chalk aquifer to the regional climatic signal. J Hydrol 464– 465:485–493. doi:10.1016/j.jhydrol.2012.07.040
Espírito Santo F, Ramos AM, de Lima MIP, Trigo RM (2013) Seasonal changes in daily precipitation extremes in mainland Portugal from 1941 to 2007. Reg Environ Chang 14:1765–1788. doi:10.1007/ s10113-013-0515-6
Gámiz-Fortis SR (2002) Spectral characteristics and predictability of the NAO assessed through Singular Spectral Analysis. J Geophys Res 107:4685. doi:10.1029/2001JD001436
Gámiz-Fortis S, Pozo-Vázquez D, Trigo RM, Castro-Díez Y (2008) Quantifying the predictability of winter river flow in Iberia, part I: interannual predictability. J Climate 21:2484–2502. doi:10.1175/ 2007JCLI1774.1
García-Herrera R, Hernández E, Barriopedro D et al (2007) The outstand-ing 2004/05 drought in the Iberian Peninsula: associated atmospher-ic circulation. J Hydrometeorol 8:483–498
Ghil M, Allen MR, Dettinger MD et al (2002) Advanced spectral methods for climatic time series. Rev Geophys 40:1–41. doi:10. 1029/2001RG000092
Goodess CM, Jones PD (2002) Links between circulation and changes in the characteristics of Iberian rainfall. Int J Climatol 22:1593–1615. doi:10.1002/joc.810
Gurdak JJ, Hanson RT, McMahon PB et al (2007) Climate variability controls on unsaturated water and chemical movement, High Plains Aquifer, USA. Vadose Zone J 6:533
Gurdak JJ, Hanson RT, Green TT (2009) Effects of climate variability and change on groundwater resources. US Geol Surv Fact Sheet, FS09-3074
Hanson RT, Newhouse MW, Dettinger MD (2004) A methodology to assess relations between climatic variability and variations in hydro-logic time series in the southwestern United States. J Hydrol 287: 252–269. doi:10.1016/j.jhydrol.2003.10.006
Holman IP, Rivas-Casado M, Bloomfield JP, Gurdak JJ (2011) Identifying non-stationary groundwater level response to North Atlantic ocean–atmosphere teleconnection patterns using wavelet coherence. Hydrogeol J 19:1269–1278
Hugman R, Stigter TY, Monteiro JP, Nunes L (2012) Influence of aquifer properties and the spatial and temporal distribution of recharge and abstraction on sustainable yields in semi-arid regions. Hydrol Process 26:2791–2801. doi:10.1002/hyp.8353
Hugman R, Stigter TY, Monteiro JP (2013) The importance of temporal scale when optimising abstraction volumes for sustainable aquifer exploitation: a case study in semi-arid South Portugal. J Hydrol 490: 1–10. doi:10.1016/j.jhydrol.2013.02.053
Hurrell JW, Van Loon H (1997) Decadal variations in climate associated with the North Atlantic Oscillation. Clim Chang 36:301–326 Hurrell JW, Kushnir Y, Ottersen G, Visbeck M (2003) An overview of the
North Atlantic Oscillation. In: The North Atlantic Oscillation: cli-matic significance and environmental impact AGU Monograph 134, AGU, Washington, DC, pp 1–35. doi:10.1029/134GM01 Jerez S, Trigo RM, Vicente-Serrano SM et al (2013) The impact of the
North Atlantic Oscillation on renewable energy resources in south-western Europe. J Appl Meteorol Climatol 52:2204–2225. doi:10. 1175/JAMC-D-12-0257.1
Kuss AJM, Gurdak JJ (2014) Groundwater level response in U.S. prin-cipal aquifers to ENSO, NAO, PDO, and AMO. J Hydrol 519: 1939–1952. doi:10.1016/j.jhydrol.2014.09.069
Liang X, Zhang Y-K (2013) Temporal and spatial variation and scaling of groundwater levels in a bounded unconfined aquifer. J Hydrol 479: 139–145. doi:10.1016/j.jhydrol.2012.11.044
Little MA, Bloomfield JP (2010) Robust evidence for random fractal scaling of groundwater levels in unconfined aquifers. J Hydrol 393:362–369. doi:10.1016/j.jhydrol.2010.08.031
Lorenz EN (1963) Deterministic nonperiodic flow. J Atmos Sci 20:130– 141
Lorenzo-Lacruz J, Vicente-Serrano SM, López-Moreno JI, González-Hidalgo JC, Mora’n-Tejeda E (2011) The response of Iberian rivers to the North Atlantic Oscillation. Hydrol Earth Syst Sci 15:2581– 2597. doi:10.5194/hess-15-2581-2011
Lovejoy, S. (2013) What is Climate? EOS 94 (1):1–2
Luque-Espinar JA, Chica-Olmo M, Pardo-Igúzquiza E, García-Soldado MJ (2008) Influence of climatological cycles on hydraulic heads across a Spanish aquifer. J Hydrol 354:33–52. doi:10.1016/j. jhydrol.2008.02.014
Mandelbrot B (1982) The fractal geometry of nature. Freeman, San Francisco, CA
Mangin A (1984) Pour une meilleure connaissance des systèmes hydrologiques à partir des analyses corrélatoire et spectrale [For a better knowledge of the hydrological systems starting from the cross-correlation and spectral analysis]. J Hydrol 67:25–43 Manuppella G, Ramalho M, Rocha R, Marques B, Antunes MT, Pais J,
Algarve, folha Ocidental, na escala 1:100 000 [Geologic map of the Algarve region, Western sector on a scale of 1:100 000]. Serviços Geológicos de Portugal, Lisbon
Massei N, Dupont JP, Mahler BJ et al (2006) Investigating transport properties and turbidity dynamics of a karst aquifer using correla-tion, spectral, and wavelet analyses. J Hydrol 329:244–257. doi:10. 1016/j.jhydrol.2006.02.021
Massei N, Durand A, Deloffre J, Dupont J-P, Valdes D, Laignel B (2007) Investigating possible links between the North Atlantic Oscillation and rainfall variability in northwestern France over the past 35 years. J Geophys Res 112:D09121. doi:10.1029/2005JD007000 Miranda PMA, Coelho F, Tome’ AR, Valente MA, Carvalho A, Pires C,
Pires HO, Cabrinha VP, Ramalho C (2002) 20th Century Portuguese climate and climate scenarios. In: Santos FD, Forbes K, Moita R (eds) Climate change in Portugal: scenarios, impacts and adaptation measures. Gradiva, Lisbon, pp 27–83
Monteiro JP, Nunes L, Vieira J et al (2003) Síntese Bidimensional dos Modelos Conceptuais de Funcionamento Hidráulico de Seis Sistemas Aquíferos do Algarve, Baseada em Modelos Numéricos de Escoamento Regional [Bidimensional synthesis of conceptual models of hydraulic behaviour of six aquifer systems in the Agrave region, based on numerical models of regional flow]. In: Ribeiro L, Peixinho de Cristo F (eds) As Águas Subterrâneas no Sul da Península Ibérica [Underground water in the south Iberian Peninsula]. International Association of Hydrologists, Lisbon, pp 159–169
Monteiro JP, Vieira J, Nunes L, Younes F (2006) Inverse calibration of a regional flow model for the Querença-Silves Aquifer System (Algarve- Portugal). In: Proceedings of the International Congress on Integrated Water Resources Management and Challenges of the Sustainable Development. Marakesh, Morocco, May 2006, 44 pp Monteiro JP, Ribeiro L, Reis E, Martins J, Matos Silva J (2007)
Modelling stream-groundwater interactions in the Querença-Silves Aquifer System. XXXV AIH Congress, Groundwater and Ecosystems, Lisbon, IAH, Goring, UK, pp 41–42
Oliveira MM, Oliveira L, Lobo-Ferreira JP (2008) Estimativa da recarga natural no sistema aquífero de Querença-Silves (Algarve) pela aplicação do modelo BALSEQ_MOD [Natural recharge estimate of the Querença-Silves aquifer based on the BALSEQ_MOD mod-el]. In: IX Congresso da Água - Água: desafios de hoje, exigências de amanhã. Cascais,Portugal, 2–4 April 2008
Oliveira L, Leitao T, Lobo-Ferreira JP et al (2011) Água, Ecossistemas Aquáticos e Actividade Humana [Water, aquatic ecosystems and human activity]. Projecto PROWATERMAN, Third thematic report: quantitative and qualitative results of the 2011 campaigns and water balances. Referência do Projecto no. PTDC/AACAMB/105061/ 2008, Laboratório Nacional de Engenharia Civil, Lisbon
Salvador N, Monteiro JP, Hugman R et al (2012) Quantifying and model-ling the contribution of streams that recharge the Querença-Silves aquifer in the south of Portugal. Nat Hazards Earth Syst Sci 12: 3217–3227. doi:10.5194/nhess-12-3217-2012
Sang Y-F (2013) A review on the applications of wavelet transform in hydrology time series analysis. Atmos Res 122:8–15. doi:10.1016/j. atmosres.2012.11.003
Santos D, Miranda P (2006) Alterações climáticas Portugal. Cenários, impactos e medidas de adaptação [Climatic change in Portugal: scenarios, impacts and adaptation measures]. SIAM II project, 1st edn. Gradiva, Lisbon
Slimani S, Massei N, Mesquita J et al (2009) Combined climatic and geological forcings on the spatio-temporal variability of piezometric levels in the chalk aquifer of Upper Normandy (France) at pluridecennal scale. Hydrogeol J 17:1823–1832. doi:10.1007/ s10040-009-0488-1
SNIRH (2015) National Information System of Water Resources.http:// snirh.pt. Accessed 1 May 2015
Stigter TY, Monteiro JP, Nunes LM et al (2009) Screening of sustainable groundwater sources for integration into a regional drought-prone water supply system. Hydrol Earth Syst Sci Discuss 6:85–120. doi: 10.5194/hessd-6-85-2009
Stigter T, Monteiro JP, Nunes L, Ribeiro L, Hugman R (2010) Regional spatial-temporal assessment of groundwater exploitation sustain-ability in the south of Portugal. Groundwater Quality Sustainability. IAH Book Series (IAH Selected Papers), IAH, Goring, UK, 10 pp
Stigter T, Ribeiro L, Samper J et al (2011) Assessing and managing the impact of climate change on coastal groundwater resources and dependent ecosystems. Final report, CIRCLE-Med project. Instituto Superior Técnico, Lisbon
Stigter TY, Nunes JP, Pisani B et al (2014) Comparative assessment of climate change and its impacts on three coastal aquifers in the Mediterranean. Reg Environ Chang 14:41–56. doi:10.1007/ s10113-012-0377-3
Terrinha P (1998) Structural geology and tectonic evolution of the Algarve Basin, South Portugal. PhD Thesis, University of London, London, 430 pp
Torrence C, Compo GP (1998) A practical guide to wavelet analysis. Bull Am Meteorol Soc 79:61–78
Tremblay L, Larocque M, Anctil F, Rivard C (2011) Teleconnections and interannual variability in Canadian groundwater levels. J Hydrol 410:178–188. doi:10.1016/j.jhydrol.2011.09.013
Trigo RM, Osborn TJ, Corte-Real JM (2002) The North Atlantic Oscillation influence on Europe: climate impacts and associated physical mechanisms. Climate Res 20:9–17
Trigo RM, Pozo-Vázquez D, Osborn TJ et al (2004) North Atlantic Oscillation influence on precipitation, river flow and water resources in the Iberian Peninsula. Int J Climatol 24:925–944. doi:10.1002/ joc.1048
Trigo RM, Valente MA, Trigo IF et al (2008) The impact of North Atlantic wind and cyclone trends on European precipitation and significant wave height in the Atlantic. Ann NY Acad Sci 1146: 212–34. doi:10.1196/annals.1446.014
Vautard R, Yiou P, Ghil M (1992) Singular-spectrum analysis: a toolkit for short, noisy chaotic signal. Phys D 58:95–126
Vicente-Serrano SM, López-Moreno JI (2008) Nonstationary influence of the North Atlantic Oscillation on European precipitation. J Geophys Res 113:20120. doi:10.1029/2008JD010382
Vieira J, Monteiro JP (2003) Atribuição de Propriedades a Redes Não Estruturadas de Elementos Finitos Triangulares (Aplicação ao Cálculo da Recarga de Sistemas Aquíferos do Algarve) [Properties assignment to unstructured networks of triangular finite elements, (applications to the recharge of the Algarve’s aquifer systems)]. In: Ribeiro L, Peixinho de Cristo F (eds) As Águas Subterrâneas no Sul da Península Ibérica [Underground water in the south Iberian Peninsula]. International Association of Hydrologists, Lisbon Zhang YK, Schilling K (2004) Temporal scaling of hydraulic head and
river base flow and its implication for groundwater recharge. Water Resour Res 40:W03504. doi:10.1029/2003WR002094