Braz. J. of Develop.,Curitiba, v. 6, n.6, p.36008-36024 jun. 2020. ISSN 2525-8761
Consistency test and prediction of experimental data from binary systems
methanol + acetic acid and methanol + water in vapor-liquid equilibrium
Teste de consistência e predição de dados experimentais dos sistemas
binários metanol + ácido acético e metanol + água em equilíbrio
líquido-vapor
DOI:10.34117/bjdv6n6-228
Recebimento dos originais:08/05/2020 Aceitação para publicação:09/06/2020
Beatriz de Azevedo
Mestranda em Engenharia Química pela Universidade Federal do Rio Grande do Norte Instituição: Universidade Federal do Rio Grande do Norte
Endereço: Av. Senador Salgado Filho, 3000 – Lagoa Nova, Natal – RN, Brasil E-mail: beatrizazevedo26@gmail.com
Cláudia Bezerra Silva
Mestranda em Engenharia Química pela Universidade Federal do Rio Grande do Norte Instituição: Universidade Federal do Rio Grande do Norte
Endereço: Av. Senador Salgado Filho, 3000 – Lagoa Nova, Natal – RN, Brasil E-mail: claudiasilvabe3@gmail.com
Leonete Cristina de Araújo Ferreira Medeiros Silva
Doutoranda em Engenharia Química pela Universidade Federal do Rio Grande do Norte Instituição: Universidade Federal do Rio Grande do Norte
Endereço: Av. Senador Salgado Filho, 3000 – Lagoa Nova, Natal – RN, Brasil E-mail: leonetecristina@ufrn.edu.br
Talita Kênya Oliveira Costa
Mestranda em Engenharia Química pela Universidade Federal do Rio Grande do Norte Instituição: Universidade Federal do Rio Grande do Norte
Endereço: Av. Senador Salgado Filho, 3000 – Lagoa Nova, Natal – RN, Brasil E-mail: talitakenya@gmail.com
Raquel Revoredo Pinheiro de Souza
Mestranda em Engenharia Química pela Universidade Federal do Rio Grande do Norte Instituição: Universidade Federal do Rio Grande do Norte
Endereço: Av. Senador Salgado Filho, 3000 – Lagoa Nova, Natal – RN, Brasil E-mail: raquelrevoredo@hotmail.com
Talison Kennedy Oliveira Costa
Graduando em Engenharia da Computação pelo Instituto Federal da Paraíba Instituição: Instituto Federal da Paraíba
Endereço: R. Tranqüilino Coelho Lemos, 671 – Dinamérica, Campina Grande – PB, Brasil E-mail: talisonkennedy1@gmail.com
Braz. J. of Develop.,Curitiba, v. 6, n.6, p.36008-36024 jun. 2020. ISSN 2525-8761
ABSTRACT
Methyl acetate is generally used as an intermediate in a wide variety of syntheses, it can be produced by esterification of acetic acid with methanol in the presence of an acid catalyst. Methanol and water form azeotropic mixtures along this route, making the separation and purification of methyl acetate difficult and expensive. A thermodynamic study is essential, evaluating the operating conditions and thermodynamic properties of methanol/acetic acid and methanol/water. Therefore, this work aims to perform area and deviations consistency tests of experimental data to these binary mixtures. In addition, perform a prediction of experimental data from the UNIFAC, UNIQUAC and Hildbrand & Scatchard thermodynamic models. The tests provide a predictive behavior on the studied Vapor-Liquid Equilibrium (VLE) systems and its main operating variables, such as temperature, pressure and composition.
Key words: Methyl acetate, thermodynamic properties, binary mixtures.
RESUMO
O acetato de metila é utilizado como um intermediário em uma ampla variedade de sínteses, geralmente, ele pode ser produzido por esterificação do ácido acético com o metanol na presença de um catalisador ácido. O metanol e a água formam misturas azeotrópicas nessa rota, tornando a separação e a purificação do acetato de metila difíceis e de alto custo. É imprescindível um estudo termodinâmico, avaliando as condições de operação e propriedades termodinâmicas do metanol/ácido acético e metanol/água. Sendo assim, esse trabalho tem como objetivo realizar testes de consistência, da área e dos desvios, de dados experimentais dessas misturas binárias. Além disso, realizar uma predição de dados experimentais a partir dos modelos termodinâmicos UNIFAC, UNIQUAC e Hildbrand & Scatchard. Os testes fornecem um comportamento preditivo sobre o sistema de Equilíbrio Líquido-Vapor (ELV) estudado e suas principais variáveis de operação, como temperatura, pressão e composição.
Palavras chave: Acetato de metila, propriedades termodinâmicas, misturas binárias.
1 INTRODUCTION
The quantitative description of processes, involving mass transfer, as distillation, extraction, and absorption, are based on the method of separating mixtures in the occurrence of a thermodynamic balance that can be between different phases: liquid, vapor and/or solid. Vapor-Liquid Equilibrium (VLE) is much needed to evaluate the performance of the separation process submitted to it, as well to evaluate the performance of refrigeration cycles and the ideal compositions for each component present in the binary mixture (Hou and Duan, 2010 ; Zhang et al., 2020).
The system composed by acetic acid, methanol and water is commonly used in the chemical industry for methyl acetate production(MeAc) (Diemer & Luyben, 2010) and can be used as a solvent in glues and nail polishes, in chemical reactions, extraction processes, among
Braz. J. of Develop.,Curitiba, v. 6, n.6, p.36008-36024 jun. 2020. ISSN 2525-8761 others, for yours lipophilic and hydrophilic characteristics, in addition, presenting low toxicity when compared to other solvents such as ethyl acetate, for example.
Bangga et al. (2019) cites the MeAc production as an important industrial reaction process, through the esterification of methanol and acetic acid, and its production is commonly carried out by reactive distillation, being a classic example for research and development.
Reactive distillation combines separation and reaction in one unit and is used in industrial applications that systems have reversible reactions, such as the reaction of acetic acid and methanol in the production of MeAc and water. It can offer significant economic advantages in some systems with the high purity products production (Al-Arfaj & Luyben, 2002).
Due to the molecular interactions and the formation of azeotropic points present in the mixture of this study, there is a difficulty in the prediction of the experimental data, being necessary to carry out consistency tests with predictive thermodynamic models UNIFAC, UNIQUAC and Hildbrand & Scatchard, relating temperature, pressure and composition components.
This work aims to analyze the consistency of the vapor-liquid equilibrium data for binary water/methanol and methanol/acetic acid systems under constant pressure and constant temperature, respectively. Both systems have important roles in the industry, making it necessary to know their thermodynamic properties and thus identify the optimal variables for the process.
2 METHODOLOGY
2.1 AREA CONSISTENCY TEST
The area consistency test relates the activity coefficients of the components of the mixture, it based on correlations derived from the GibbsDuhem equation. The activity coefficients (γ) are evaluated using Raoult's law (Smith & Van Ness, 1959), using the VLE experimental data, as shown in Equations (1) and (2).
𝛾1 = 𝑦1𝑃 𝑥1𝑃1𝑠𝑎𝑡 (1) 𝛾2 = (1−𝑦1)𝑃 (1−𝑥1)𝑃2𝑠𝑎𝑡 (2)
Braz. J. of Develop.,Curitiba, v. 6, n.6, p.36008-36024 jun. 2020. ISSN 2525-8761 Plotting the graph of ln (γ1/γ2) versus x1, there is a curve that can be linear or polynomial. Drawing a line on the “zero axis”, two areas can be calculated, above and below the axis. The ratio of the smallest and largest area (A/B) will indicate a percentage that will be evaluated according to Table 1, to check if the experimental data are consistent or not. Saturation pressures for each component were calculated according to the Antoine equation and the test was performed using Microsoft Office Excel software.
All graphs and fittings presented in this work were performed with Origin v.8 software.
Table 1. VLE data quality criteria based on the area consistency test.
Class A/B Definition
A 0,95-1,00 Accurate data, suitable for any use.
B 0,90-0,95 Good data, applicable for design and correlation (Continuation Table 1.)
C 0,80-0,90 Applicable for works where high precision is not required. D 0,70-0,80 They can be applied, but with great caution.
E <0,70 Unacceptable, it is suggested to estimate VLE in another way.
Source: Adapted by Smith et al. (1982).
2.2 DEVIATION CONSISTENCY TEST
For the deviation consistency test, SPECS v5.63 software was used. This tool calculates the relative deviations from a regression of the experimental data, T-x,y for isobaric systems or P-x,y for isothermal systems. The results obtained are calculation of temperature and/or pressure (depending on the system) and the relative deviations from the calculation of the composition of the vapor phase in relation to the experimental data.
At the end, an average of ΔT or ΔP (difference between experimental and calculated) and an average for the relative deviations of the composition of the vapor phase (yi) is performed. Results are evaluated according to Table 2.
Braz. J. of Develop.,Curitiba, v. 6, n.6, p.36008-36024 jun. 2020. ISSN 2525-8761
Table 2. VLE data quality criteria based on the deviation consistency test.
Class ΔT or ΔP**
(%)
Definition
A <0,25 Accurate data, suitable for any use.
B 0,25-0,50 Good data, applicable for design and correlation
C 0,50-1,00 Applicable for works where high precision is not
required.
D 1,00-2,00 They can be applied, but with great caution.
E >2,00 Unacceptable, it is suggested to estimate VLE in another
way.
* The mean absolute deviation in y must be less than 0,01 for consistent data (Δy1 <0,01).
Source: Adapted by Smith et al. (1982).
2.3 PREDICTIVE MODELS OF EXPERIMENTAL DATA
For the prediction of experimental data, three models were used, UNIFAC, UNIQUAC and Hildbrand & Scatchard. For UNIFAC and UNIQUAC calculations, SPECS software v5.63 was used and for the other model, Microsoft Office Excel.
The first model used to predict VLE data, used the UNIFAC activity coefficient model to represent excess Gibbs free energy, with a gamma-phi approach, combined with the Soave-Redlich Kwong (SRK) equation of state and the quadratic mixing rule with kij interaction parameters (QMR). SPECS v5.63 will generate pressure and temperature results for the isothermal and isobaric systems, respectively, combined with the composition of liquid and vapor. Then, the graphs P-x, y and T-x,y were plotted for comparison with the experimental data.
The second model used to represent excess Gibbs free energy was UNIQUAC. It is different from UNIFAC, uses the experimental data to define the parameter Aij from a regression, which will be extremely important for the calculations, when is needed replacing in the equation. With the Aij parameter defined, the SRK equation was used and the QMR with the kij interaction parameters for the prediction of VLE data and the plotting of P-x,y and T-x,y graphs, for isothermal and isobaric systems, respectively.
Finally, was the Hildebrand and Scatchard model in the Microsoft Office Excel program to predict VLE data. The model is made for nonpolar or polar molecules and uses leakage coefficient and solubility of substances, as well as molar volumes, which are used to calculate or activity coefficient (Smith & Van Ness, 1959), according to Equations (3) to (6). With the calculated activity coefficient, is possible to calculate the composition of the vapor phase in the substance, using Equation (3).
Braz. J. of Develop.,Curitiba, v. 6, n.6, p.36008-36024 jun. 2020. ISSN 2525-8761 𝜙1 = 𝑥1𝑣1 𝑥1𝑣1+𝑥2𝑣2 (3) 𝜙2 = 𝑥2𝑣2 𝑥1𝑣1+𝑥2𝑣2 (4) 𝑅𝑇 𝑙𝑛𝛾1 = 𝑣1𝜙22[𝛿1− 𝛿2]2 (5) 𝑅𝑇 𝑙𝑛𝛾2 = 𝑣2𝜙12[𝛿1− 𝛿2]2 (6)
Being 𝜙 the fugacity coefficient, 𝛿 delta the solubility coefficient, 𝑣 the molar volume and 𝛾 activity coefficient of the substances.
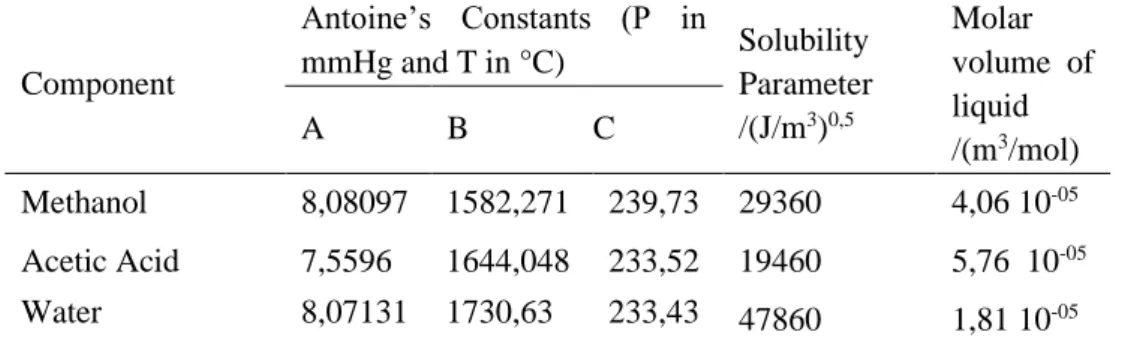
2.4 CONSTANTS USED IN THE SIMULATION
All constants used for the calculations are shown in Table 3. Antoine's constants were taken from the SPECS v5.63 database and the solubility parameters and molar volumes from the DIPPR database.
Table 3. Constants of Antoine, parameter of solubility and molar volume of the liquid for methanol, acetic acid, and water. Component Antoine’s Constants (P in mmHg and T in °C) Solubility Parameter /(J/m3)0,5 Molar volume of liquid /(m3/mol) A B C Methanol 8,08097 1582,271 239,73 29360 4,06 10-05 Acetic Acid 7,5596 1644,048 233,52 19460 5,76 10-05 Water 8,07131 1730,63 233,43 47860 1,81 10-05 2.5 EXPERIMENTAL DATA
VLE data were collected for the following systems: Methanol + Acetic Acid (System 1) and Methanol + Water (System 2).
For System 1, Methanol + Acetic Acid, the experimental data from Rius et. al. (1959) temperature and composition of the liquid and steam phases, at a pressure of 706,03 mmHg (Table 4).
Braz. J. of Develop.,Curitiba, v. 6, n.6, p.36008-36024 jun. 2020. ISSN 2525-8761
Table 4. VLE data for Methanol (1) + Acetic Acid (2) system at 706,03 mmHg.
Texp/K x 1exp y1exp 388,95 0,00 0,00 385,15 0,04 0,11 383,05 0,06 0,17 378,15 0,11 0,30 375,95 0,14 0,35 370,55 0,21 0,49 367,95 0,25 0,56
For System 2, Methanol + Water, we used the experimental data present in Bredig & Bayer (1927) of pressure and composition of the liquid and vapor phases, at a temperature of 312,91 K (Table 5).
Table 5. VLE data for Methanol (1) + Water (2) system at 312,91 K.
Pexp/mmHg x 1exp y1exp 68,10 0,05 0,26 85,60 0,09 0,46 86,30 0,09 0,46 97,60 0,13 0,62 103,40 0,15 0,62 109,80 0,18 0,65 118,40 0,20 0,67 119,10 0,20 0,68 122,40 0,22 0,70 132,00 0,26 0,73 138,20 0,29 0,74 142,70 0,31 0,76 155,30 0,37 0,81 161,50 0,42 0,80 167,40 0,44 0,82 175,40 0,50 0,85 365,85 0,28 0,60 364,85 0,31 0,63 359,95 0,39 0,74 357,85 0,43 0,78
Braz. J. of Develop.,Curitiba, v. 6, n.6, p.36008-36024 jun. 2020. ISSN 2525-8761 354,85 0,49 0,83 353,05 0,52 0,85 349,15 0,60 0,91 346,85 0,66 0,93 344,75 0,71 0,95 342,25 0,79 0,97 340,45 0,84 0,98 339,05 0,88 0,99 336,95 0,96 1,00 336,15 1,00 1,00 336,05 1,00 1,00 188,20 0,59 0,86 202,50 0,69 0,88 206,40 0,69 0,90 244,30 0,93 0,98
3 RESULTS AND DISCUSSION
3.1 AREA CONSISTENCY TEST
Table 6 shows the saturation pressure values calculated by Antoine for each species (Psat,1 e Psat,2); the activity coefficients (γ1 e γ2) and the calculations ln(γ1/γ2) for each experimental data point of the Table 4.
Table 6. VLE calculations for Methanol (1) + Acetic Acid (2) system at 706.03 mmHg.
Psat,1/mmHg Psat,2/mmHg γ1 γ2 ln(γ1/γ2) 4270.34 713.23 - 0.99 - 3822.79 633.10 0.54 1.03 -0.64 3592.19 592.07 0.56 1.06 -0.64 3097.65 504.76 0.65 1.09 -0.53 2894.35 469.15 0.63 1.13 -0.59 2440.95 390.43 0.68 1.16 -0.53 2244.30 356.62 0.70 1.17 -0.52
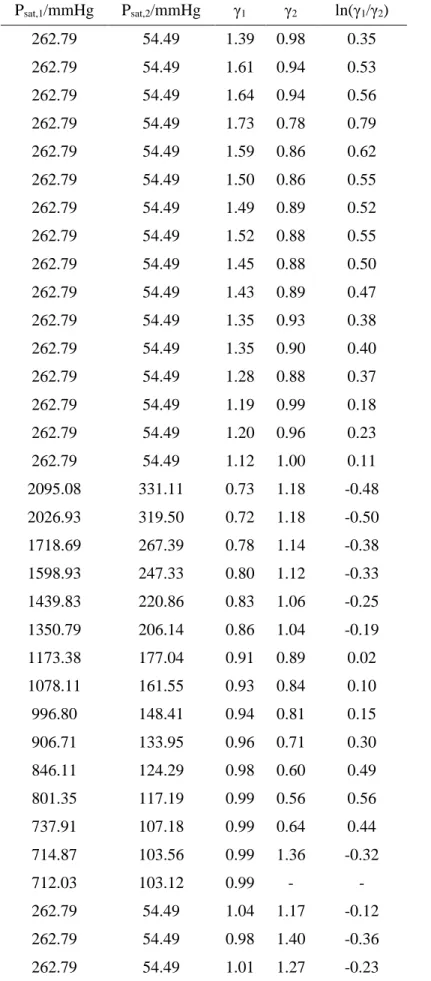
Table 7 shows the calculations already mentioned in the explanation of Table 6, but now for each experimental data point of the Table 5 (system 2).
Braz. J. of Develop.,Curitiba, v. 6, n.6, p.36008-36024 jun. 2020. ISSN 2525-8761
Table 7. VLE calculations for Methanol (1) + Water (2) system at 312.91 K.
Psat,1/mmHg Psat,2/mmHg γ1 γ2 ln(γ1/γ2) 262.79 54.49 1.39 0.98 0.35 262.79 54.49 1.61 0.94 0.53 262.79 54.49 1.64 0.94 0.56 262.79 54.49 1.73 0.78 0.79 262.79 54.49 1.59 0.86 0.62 262.79 54.49 1.50 0.86 0.55 262.79 54.49 1.49 0.89 0.52 262.79 54.49 1.52 0.88 0.55 262.79 54.49 1.45 0.88 0.50 262.79 54.49 1.43 0.89 0.47 262.79 54.49 1.35 0.93 0.38 262.79 54.49 1.35 0.90 0.40 262.79 54.49 1.28 0.88 0.37 262.79 54.49 1.19 0.99 0.18 262.79 54.49 1.20 0.96 0.23 262.79 54.49 1.12 1.00 0.11 2095.08 331.11 0.73 1.18 -0.48 2026.93 319.50 0.72 1.18 -0.50 1718.69 267.39 0.78 1.14 -0.38 1598.93 247.33 0.80 1.12 -0.33 1439.83 220.86 0.83 1.06 -0.25 1350.79 206.14 0.86 1.04 -0.19 1173.38 177.04 0.91 0.89 0.02 1078.11 161.55 0.93 0.84 0.10 996.80 148.41 0.94 0.81 0.15 906.71 133.95 0.96 0.71 0.30 846.11 124.29 0.98 0.60 0.49 801.35 117.19 0.99 0.56 0.56 737.91 107.18 0.99 0.64 0.44 714.87 103.56 0.99 1.36 -0.32 712.03 103.12 0.99 - - 262.79 54.49 1.04 1.17 -0.12 262.79 54.49 0.98 1.40 -0.36 262.79 54.49 1.01 1.27 -0.23
Braz. J. of Develop.,Curitiba, v. 6, n.6, p.36008-36024 jun. 2020. ISSN 2525-8761
262.79 54.49 0.98 1.47 -0.41
Figures 1 and 2 show the behaviors of ln(γ1/γ2) versus x1. After performing second and third order polynomial fit, for systems 1 and 2, respectively, was possible to calculate areas A and B for each system studied using the integral method.
Braz. J. of Develop.,Curitiba, v. 6, n.6, p.36008-36024 jun. 2020. ISSN 2525-8761
Figure 2. Graph of the area consistency test for Methanol (1) + Water (2) system.
The calculated areas, as well as the A/B results for each system are shown in Table 8.
Table 8. Area test results for systems 1 and 2
SYSTEM AREA A AREA B A/B CLASSIFICATIO
N A/B Methanol + Acetic Acid 0.6234 0.98475588 0,633054573 E (<0.70)
Methanol + Water 0.890103 0.7574 0.8509 C (0.80-0.90)
Analyzing Table 8, observed that in Methanol + Acetic Acid system, the A/B result corresponds to Class E in Table 1, suggesting that the experimental data are not consistent, so its suggested to estimate the VLE in another way. This can be justified by the fact that one of the components is very concentrated in the vapor phase (methanol) and the activity coefficients are very close to 1.
For the Methanol + Water system, the A/B result corresponds to class C in Table 1, suggesting that the experimental data may be applicable for jobs where high precision is not required.
3.2 DEVIATION CONSISTENCY TEST
Tables 9 and 10 show the results for deviation tests generated by SPECS for systems 1 and 2, respectively. Δy corresponds to the value of the deviation vapor phase composition
Braz. J. of Develop.,Curitiba, v. 6, n.6, p.36008-36024 jun. 2020. ISSN 2525-8761 calculated in relation to its experimental value. Similarly, ΔT and ΔP correspond to the values of deviations from temperature and pressure, respectively.
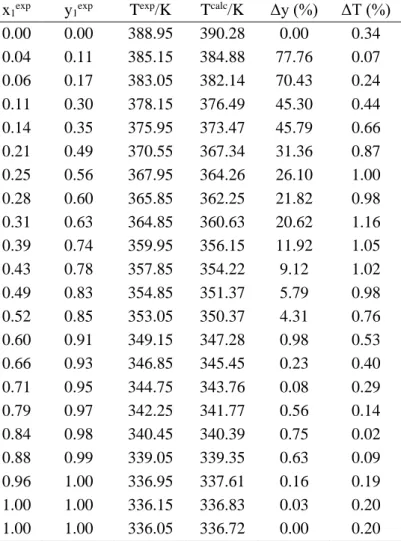
Table 9. Deviation test results generated by SPECS: VLE data for Methanol (1) + Acetic Acid (2) system at 706.03 mmHg.
x1exp y1exp Texp/K Tcalc/K Δy (%) ΔT (%)
0.00 0.00 388.95 390.28 0.00 0.34 0.04 0.11 385.15 384.88 77.76 0.07 0.06 0.17 383.05 382.14 70.43 0.24 0.11 0.30 378.15 376.49 45.30 0.44 0.14 0.35 375.95 373.47 45.79 0.66 0.21 0.49 370.55 367.34 31.36 0.87 0.25 0.56 367.95 364.26 26.10 1.00 0.28 0.60 365.85 362.25 21.82 0.98 0.31 0.63 364.85 360.63 20.62 1.16 0.39 0.74 359.95 356.15 11.92 1.05 0.43 0.78 357.85 354.22 9.12 1.02 0.49 0.83 354.85 351.37 5.79 0.98 0.52 0.85 353.05 350.37 4.31 0.76 0.60 0.91 349.15 347.28 0.98 0.53 0.66 0.93 346.85 345.45 0.23 0.40 0.71 0.95 344.75 343.76 0.08 0.29 0.79 0.97 342.25 341.77 0.56 0.14 0.84 0.98 340.45 340.39 0.75 0.02 0.88 0.99 339.05 339.35 0.63 0.09 0.96 1.00 336.95 337.61 0.16 0.19 1.00 1.00 336.15 336.83 0.03 0.20 1.00 1.00 336.05 336.72 0.00 0.20
Braz. J. of Develop.,Curitiba, v. 6, n.6, p.36008-36024 jun. 2020. ISSN 2525-8761
Table 10. Deviation test results generated by SPECS: VLE data for Methanol (1) + Water (2) system at 312.91K.
x1exp y1exp Pexp/mmHg Pcalc/mmHg Δy (%) ΔP (%)
0.05 0.26 63.08 68.4 38.65 7.78 0.09 0.46 78.28 85.88 9.65 8.85 0.09 0.46 78.28 86.64 8.08 9.65 0.13 0.62 90.44 97.28 6.64 7.03 0.15 0.62 95.00 103.36 1.39 8.09 0.18 0.65 101.84 109.44 0.87 6.94 0.20 0.67 106.4 118.56 1.08 10.26 0.20 0.68 106.4 119.32 2.06 10.83 0.22 0.70 110.96 122.36 1.63 9.32 0.26 0.73 117.04 132.24 2.18 11.49 0.29 0.74 123.12 138.32 0.85 10.99 0.31 0.76 126.92 142.88 2.19 11.17 0.37 0.81 137.56 155.04 3.08 11.27 0.42 0.80 145.16 161.12 0.32 9.91 0.44 0.82 148.2 167.2 1.59 11.36 0.50 0.85 158.84 175.56 0.86 9.52 0.59 0.86 172.52 188.48 1.15 8.47 0.69 0.88 187.72 202.16 2.47 7.14 0.69 0.90 188.48 206.72 1.00 8.82 0.93 0.98 224.96 243.96 0.23 7.79
Table 11 summarizes the results obtained from the means of deviations generated by SPECS for systems 1 and 2.
Table 11. Deviation test results for systems 1 and 2.
Methanol + Acid Acetic Methanol + Water
ΔT 0,007236 ΔP 0,00166
Δy 0,184795 Δy 0,0430
Comparing the average value of ΔT and ΔP present in Table 11 with Table 2, we can see that both are in class A, as their values are less than 0,25. Thus, by observations of deviation testing, the two sets of experimental data are accurate and suitable for any use.
The Δy values for each system are greater than 0,01, indicating that the data are not consistent. In the case of the Δy error of the methanol + water mixture, it can be caused by the hydrogen bonds that hold the water molecules to hinder the phase change, increasing the experimental errors of this magnitude.
Braz. J. of Develop.,Curitiba, v. 6, n.6, p.36008-36024 jun. 2020. ISSN 2525-8761 3.2 PREDICTION OF EXPERIMENTAL DATA
Table 12 shows the values of the Aij iteration parameters (UNIQUAC model) obtained after a regression in SPECS with the experimental VLE data of the systems studied.
Table 12. Iteration parameter values obtained with regression in SPECS using the UNIQUAC model.
SYSTEM Aij Aij
Methanol + Acid Acetic -173.2890 54.7083
Methanol + Water 67.4152 153.338
With the data in Table 12, it was possible to predict the experimental data with the UNIQUAC model. Figure 3 corresponds to the graphs of T – x, y for system 1.
Figure 3. Graph T-x, y for Methanol (1) + Acetic Acid (2) system using the UNIFAC and UNIQUAC models and the experimental data (706.03 mmHg).
Figure 3 shows that the UNIQUAC model was the closest to the experimental data. This can be explained by the fact that the UNIQUAC model uses parameters that are obtained from experimental data, better predicting the results.
Braz. J. of Develop.,Curitiba, v. 6, n.6, p.36008-36024 jun. 2020. ISSN 2525-8761
Figure 4. Graph P-x, y for Methanol (1) + Water (2) system using the UNIFAC and UNIQUAC models and the experimental data (312.91 K).
Figure 4 shows that both the UNIFAC and UNIQUAC models had similar results and the behavior is close to experimental data. The small difference from the calculated to the experimental can be because the experimental data are old, and the experiment may not be performed very well, maybe the equipment used wasn't so precise.
Table 13 shows the results of the mean pressure errors calculated by the Hildbrand and Scatchard model in relation to the experimental data of the systems used.
Table 13. Mean errors of pressure calculated by the Hildbrand and Scatchard model in relation to the experimental data of Methanol (1) + Acetic Acid (2) and Methanol (1) + Water (2) systems.
SYSTEM MEAN ERROR
(%) Methanol + Acid Acetic 66.33
Methanol + Water 345.53
The results presents in Table 13 show that the Hildbrand & Scatchard model is not indicated to predict the experimental data of the studied systems, this is due to the fact that this model assumes the vapor phase as ideal, being indicated for regular systems, where the entropy variation it is the same as that of an ideal solution, that is, zero. As the system under study is a non-ideal solution, this equation does not apply to the calculation of the activity coefficient. Another cause of the high experimental errors is because methanol, acetic acid and
Braz. J. of Develop.,Curitiba, v. 6, n.6, p.36008-36024 jun. 2020. ISSN 2525-8761 water, are highly polar molecules and this predictive model is used for nonpolar and/or slightly polar molecules.
4 CONCLUSIONS
The evaluation of data consistency through the predictive tests performed is essential for the representation of the behavior of thermodynamic systems in obtaining and applying appropriate correlations.
The tests carried out showed that for the area consistency test, the experimental data of the methanol/acetic acid mixture were not consistent, whereas for the methanol/water mixture, it was found that the data can be used in experiments that do not require high precision.
For the deviation test, with respect to the results of ΔP and ΔT it was found that both are consistent, showing themselves to be accurate and suitable for use. Regarding the mean Δy deviation, it was found that the data are inconsistent. The predictive models that best suited the experimental data were UNIFAC and UNIQUAC, in contrast, the Hildbrand & Scatchard model generated large mean errors.
REFERENCES
AL-ARFAJ, M.A; LUYBEN, W.L. Comparative control study of ideal and methyl acetate
reactive distillation. Chemical Engineering Science 57 (2002) 5039 – 5050.
BANGGA, G; NOVITA, F.J; LEE, HY. Evolutional computational fluid dynamics
analyses of reactive distillation columns for methyl acetate production process. Chemical Engineering & Processing: Process Intensification 135 (2019) 42–52.
BREDIG G.; BAYER R. Die Dampfdrücke des binären Systems Methylalkohol-Wasser.
Z. Phys.Chem.(Leipzig) 130 (1927) 1-14.
DIEMER, R.B; LUYBEN, W.L. Design and Control of a Methyl Acetate Process Using
Carbonylation of Dimethyl Ether. Ind. Eng. Chem. Res. 2010, 49, 12224–12241.
HOU, S.; DUAN, Y. Vapor–liquid equilibrium measurement and modeling for the
difluoromethane + pentafluoroethane + propane ternary mixture. Fluid Phase Equilibria
298 (2010) 106–112. Elsevier Science Publishers B.V., Amsterdam.
RIUS A.; OTERO J.L.; MACARRON A. Systèmes méthanol—acide acétique; éthanol—
acide acétique; n-propanol—acide acétique; n-butanol—acide acétique. Chem.Eng.Sci.
Braz. J. of Develop.,Curitiba, v. 6, n.6, p.36008-36024 jun. 2020. ISSN 2525-8761 SMITH, B. D. et al. Evaluation of Binary PTxy Vapor–Liquid Equilibrium Data for C 6 Hydrocarbons. Benzene+Cyclohexane. Journal of Physical and Chemical Reference Data, v. 11, n. 4, p. 1099–1126, out. 1982.
SMITH, J. M., AND H. C. VAN NESS. Introduction to Chemical Engineering Thermodynamics. New York: McGraw-Hill, 1959.
ZANG, X.; HAO, X.; JIAN, C.; WANG, H.; KONG, W.; SHANGGUAN, W.; XIA, M.
Experimental isobaric vapour-liquid equilibrium data for binary systems of {sec-butyl acetate (SBAC) + acetamide} and {sec-butyl alcohol (SBA) + acetamide} and the ternary system of (SBAC + SBA + acetamide) at 101.3 kPa. J. Chem. Thermodynamics 144 (2020)