A
r
t
ic
le
0103 - 5053 $6.00+0.00
*e-mail: [email protected]
Molecularly Imprinted Sol-Gel Silica for Solid Phase Extraction of Phenobarbital
Eduardo J. Pilau, Raquel G. C. Silva, Isabel C. F. S. Jardim and Fabio Augusto*
Instituto de Química, Universidade Estadual de Campinas, CP 6154, 13084-971 Campinas-SP, Brazil
Sílica organicamente modificada e molecularmente impressa foi preparada através de um procedimento sol-gel simples, e avaliada como sorvente específico para extração em fase sólida (Solid Phase Extraction, SPE) de fenobarbital em amostras aquosas e forenses. As propriedades analíticas dessa sílica molecularmente impressa (MIS, molecularly imprinted silica) foram inicialmente avaliadas e o material determinado como específico para as espécies-alvo: o fator de impressão IF, medido como a razão entre o pico do fenobarbital em cromatogramas de MIS e NIS (sílica não-impressa) foi estimado como 58. Este valor é consideravelmente maior que aquele apresentado normalmente para sorventes de impressão convencional baseados em metacrilatos e sugere que interações não-específicas analito/sorvente são insignificantes no MIS. O material foi aplicado no isolamento de fenobarbital de amostras aquosas e plasma; limites de detecção de 10 e 62 µg mL-1, respectivamente, foram encontrados para essas amostras.
A molecularly imprinted organically modified silica was prepared through a simple sol-gel procedure, and evaluated as specific sorbent for solid-phase extraction (SPE) of phenobarbital from aqueous and forensic samples. The analytical properties of the molecularly imprinted silica (MIS, non-imprinted sílica) were initially evaluated and the MIS was found to be specific towards the target species: the imprinting factor IF, measured as the ratio between phenobarbital peak areas in the MIS and NIS chromatograms, was estimated as 58. This value is considerably higher than those usually found for conventional methacrylate-based molecularly imprinted sorbents and suggests that non-specific analyte/sorbent interactions are insignificant in the MIS. This material is applied to the isolation of phenobarbital from aqueous samples and plasma; detection limit of 10 and 62 µg mL-1
was achieved for the former samples, respectively.
Keywords: molecularly imprinted silica, sol-gel, ormosils, phenobarbital, SPE
Introduction
There is a demand for sensitive, accurate and simple analytical procedures. One of the tools to achieve these goals is the incorporation of biomolecules and biological-like processes in the methodologies. However, despite of the specificity achieved on these procedures, natural biomolecules usually are expensive and chemically unstable. Synthetic materials such as molecularly imprinted polymers (MIP) are valid alternatives to these biological
matrices. Molecular imprinting was proposed by Pauling1
as a possible mechanism for the production of antibodies by living systems. According to his model, the synthesis of antibodies was based on the use of the aggressor chemical molecules as templates. Weak intermolecular forces such as hydrogen bonding or van der Waals forces drove
proper monomer units to organize themselves around the antigen. Polymerization of the organized monomers and removal of the template would render macromolecules with cavities where the template or other species with similar structure could be highly selectively bound, due to the morphology of the site. Due to the specific nature of the interaction between the molecularly imprinted materials and selectable molecules, they have been employed in several analytical techniques, including liquid
chromatography,2 capillary electrophoresis 3 and capillary
electrochromatography,4,5 solid phase extraction,6 and
immunoassay determinations.7
Molecularly imprinted polymers can be prepared
following three different imprinting approaches.8,9 The
in a suitable porogenic solvent. In the other alternative, the pre-organized or covalent approach, the template is previously bonded to a functionalized monomer; after polymerization, template removal demands breaking of this chemical bond.
In the last decade, one of the most exciting technical applications of molecularly imprinted materials is as sorbents for solid-phase extraction (MISPE). Most of the studies performed have focused on extracting compounds
from biological studies.10-15 The majority of the sorbents
usually available for SPE, such as modified silicas, styrene-divinylbenzene polymers and inorganic oxides, have low or no specificity towards analytes of interest,16 leading to
difficulties on further steps of the analytical procedures due to dirty extracts and/or low recoveries. The use of molecularly imprinted sorbents is advantageous mainly when a selective extraction must be performed and the commonly used sorbents present lack of selectivity. Then, MISPE allows not only the analyte to be pre-concentrated but also the other compounds present in the sample matrix to be removed. The vast majority of molecularly imprinted media are based on
the use of organic acrylate or acrylic type polymers,17 whose
preparation can be complex and usually has to be carried out on inert atmospheric conditions. Although these materials are well suited for many applications, their limited porosity and lack of modifiable chemical functionality constrain their applications.
Molecularly imprinted silicas (MIS) can be a convenient alternative to acrylic-based MIP as selective sorbents for SPE. Molecularly imprinted silicas were described as
early as 1955,18 but except for isolation of inorganic ions19
their analytical applications have been mostly restricted to
preparation of spectrometric20 or electrochemical21 sensors,
among others.22 Recently, Silva and Augusto23 described
a MIS selective to methylxanthines, prepared using sol-gel process and using 3-aminopropyltrimethoxysilane as funcional reticulant; compared to conventional MIP, this MIS presented better specificity and chemical stability. Also, the procedure for its preparation was very simple, due to addoption of sol-gel synthesis. One of major advances of sol-gel processing is the possibility of synthesizing hybrid materials, combining properties of inorganic and organic
compounds in one material.24 These sol-gel materials
include ormosils (organically modified silicates) ormocers (organically modified ceramics) and polycerams (polymeric ceramics). The use of sol-gel ormosils as non-specific sorbent coatings for SPME (solid phase microextraction)
fibers has been pioneered by Malik and co-workers25 and
has been extensively employed since.26-28
Phenobarbital shares the actions of anticonvulsants and is effective in the management of epilepsy in
sub-hypnotic doses. As an anticonvulsant, phenobarbital is used principally in the management of tonic-clonic and
partial seizures.29 Phenobarbital also shares the toxic
potentials of the barbiturate-derivate anticonvulsants, and the usual precautions of anticonvulsant administration should be observed. For adults, the usual oral dosage of phenobarbital for sedation is in the range of
30-120 mg per day; as an anticonvulsant, the dosage
lies in the 100-300 mg interval. Phenobarbital has a long plasma half-life (2-6 days). Following oral administration, peak blood concentrations are reached
in 8-12 h. Concentrations in plasma of 10-40 µg mL-1
produce anticonvulsant activity in most patients;
concentrations greater than 50 µg mL-1 may produce coma,
and those in excess of 80 µg mL-1 are potentially lethal.30
Only a few papers describe a solid phase extraction of
barbiturates.31-33 In a recent study, Zhao et al.34 developed
a new method for the extraction of barbital, amobarbital and phenobarbital residues in pork. They used a C18 SPE cartridge for clean-up the extracts after an accelerated solvent extraction of the samples. Despite the good results, it was observed that no selectivity of the extracts was obtained.
In this work, a non-covalent organically modified MIS was prepared using barbituric acid as template. This MIS was evaluated as SPE sorbent for determination of phenobarbital in human plasma. A pure sol-gel synthetic route was adopted, using 3-aminopropyltrimethoxisilane (APTMS) as functional monomer, tetraethyl orthosilicate (TEOS) as reticulating agent and without further treatment on the material obtained.
Experimental
Chemicals and materials
The procedure used for the preparation of MIS was
adapted from Silva and Augusto.22 APTMS, TEOS,
heparin mL-1 blood), centrifuged at 2500 rpm for 20 min
and the supernatant plasma transferred to storage bags and frozen at -20 °C until analysis.
Preparation of the sol-gel MIS
APTMS (100 mg) and TEOS (500 mg) were mixed in a vortex with 1.5 mL of saturated aqueous solution of barbituric acid (containing 250 mg of template).
Immediately after, 200 µL of concentrated ammonium
hydroxide (catalyst) were added and the mixture was heated at 40 ºC until turbidity appeared. After the resultant sol was cooled to room temperature, a gel monolith was obtained.
The monolith was dried overnight at 120 °C, ground to a
fine powder and sieved, resulting a powder with particle
size ranging from 75 to 100 µm. The material was flushed
with hot methanol in a Sohxlet-type apparatus for 8 h and dried at room temperature. Another batch was prepared without addition of the template and following the very same procedure, resulting non-imprinted silica (NIS) to be used as reference material. SPE cartridges were prepared by packing, in polyethylene syringes, 300 mg of MIS or NIS between silanized quartz wool plugs. Portions of MIS and NIS were set aside for IR spectroscopy, for micrography and for measurement of surface area.
High performance liquid chromatography
HPLC analysis was performed using a Waters 486 LC fitted with a UV-Vis detector, a Waters 510 HPLC pump and a Rheodyne 8125 injector (Cotati, CA, USA), using
a 5 µL sampling loop. A 3.9 mm × 150 mm Nova Pak
(USA) C18 column was employed, and the mobile phase
was 20 % acetonitrile : 80 % water (v/v) with pH adjusted
to 3.0. Flow rate was maintained at 0.8 mL min-1 and the
UV-Vis detector operated at 210 nm. The chromatographic data was recorded and analyzed by the ChromPerfect software (Justice Laboratory Solutions, Mountain View, CA, USA).
Chemical characterization of the MIS and NIS
The infrared absorption spectrum of the materials in
KBr pellets and between 400 cm-1 and 4000 cm-1 was
obtained in a Bomem MB-102 FTIR spectrometer (ABB, St-Laurent, Canada). Visual evaluation of the coatings was performed by scanning electron micrography with a JSM 6360-LV microscope (JEOL, Tokyo, Japan). BET
surface area was evaluated by N2 adsorption in a constant
volume adsorption apparatus (ASAP 2010, Micrometrics, Norcross, GA-USA)
Optimization of the MISPE-HPLC-UV methods
Test mixtures containing 1 mg L-1 of caffeine,
paracetamol, acetylsalicylic acid and phenobarbital were used as samples in the experiments. The MIS and NIS cartridges were conditioned with 5 mL of methanol, followed by 5 mL of deionized water. With aid of a L-79200-00 vacuum mini-pump (Cole Parmer, Vernon Hills, IL, USA), 10 mL of test samples were eluted through
the cartridges, with a constant flow rate of 2 mL min-1. The
cartridges were eluted with 4 mL of desorption solvent and the extracts obtained were immediately chromatographed. The effects of the nature of desorption and sample solvent (methanol, acetonitrile, chloroform or dichloromethane) and volume of sample were studied. Quantitative figures of merit for the optimized method were determined using analytical curves estimated using aqueous sample solutions
of phenobarbital in the range of 10 to 100 µg mL-1. All
experiments here and in the following sections were performed in triplicate.
Application to blood plasma
For the experiments, the whole plasma samples were
spiked with 30 µg mL-1 phenobarbital. Prior to each
extraction, the MIS cartridges were conditioned with 2 mL methanol and equilibrated with 2 mL water. Before processing, the protein fraction of the plasma was separated
by precipitation: 100 µL of aqueous HClO4 (1.5 mol L-1)
and 500 µL of deionized water were added to 100 µL of
spiked plasma. The mixture was vortexed and centrifuged at 2500 rpm for 5 min and the supernatant solution was employed. The deproteinized plasma was percolated through the cartridge, which was washed with 1 mL of deionized water, dried for 1 min under vacuum and re-eluted with 4 mL methanol. The methanol was evaporated under a gentle stream of nitrogen, the residue redissolved in 1 mL of mobile phase and analyzed by HPLC. As comparison, the same procedure was also applied to raw, non-deproteinized spiked plasma samples.
Results and Discussion
Chemical and morphological characterization of the ormosil
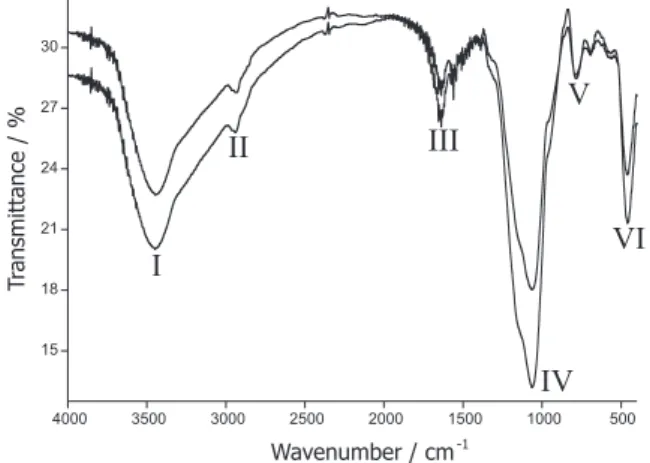
The infrared absorption spectra of the MIS and NIS sol-gel are shown in Figure 1. The broad absorption
bands at ca. 3440 cm-1 (I) can correspond both to the axial
aminopropyl groups linked to the silica network. The band
at 785 cm-1 (V) can be attributed to methyl C-H rocking,
and that located at 2935 cm-1 (II) to C-H stretching. Other
absorption band associated to primary amines is located at
1650 cm-1 (III, N-H bending). Finally, the absorptions at
1075 cm-1 (IV, attributed to Si-O stretching) and 460 cm-1
(VI, Si-O bending).35 For both MIS and NIS IR spectra, the
absorption bands are consistent with aminopropyl-modified silica. It can be seen that there are no substantial differences between the MIS and NIS spectra; any possible difference between these materials, specially the sorptive properties, should be due to the morphological differences caused by the molecular imprinting process.
The morphology of the materials can be assessed from Figure 2, which shows scanning electron micrographies with different magnifications. With 20 k magnification, the materials are apparently lamellar, and there are no visible pores. Slight differences appear when the MIS and NIS particles are examined under 50 k magnification. Both seem to be aggregates of irregular particles; however, inspection of the figures shows that these substructures on the MIS
have diameters ranging from ca. 100 to ca. 500 nm, when in
the NIS the particles are smaller, with diameters from ca. 50
to ca.100 nm. This minor difference between MIS and NIS
aspects can be a consequence of differences in the sol-gel reaction velocity. Considering that the catalyst employed was a base - ammonium hydroxide - and the template a weak acid-barbituric acid, it is possible that the catalyst is partially neutralized by the template, decelerating the initial rates of hydrolysis and condensation of TEOS and APTMS. Also, the amount of water available for the initial hydrolysis of the precursors is smaller in the synthesis of the MIS: in the NIS reaction, pure water is added instead of saturated solution of barbituric acid. Since the silica reticulate grows around
initial condensation nuclei suspended in the sol phase,24
faster initial reaction rates should cause more nuclei to be available to act as starting point for generation of macroscopic silica reticulates, resulting in smaller macroscopic ormosil grains in the final material as observed in the NIS. Although apparently secondary, this differentiation could cause distinction on the behavior of the materials not directly assignable to molecular imprinting. However, the NIS is expected to be more porous, due to the higher number of channels between its smaller nanoparticles. This would result in higher sorption efficiency when compared to the MIS, if the molecular imprinting of the later was not successful. Since this is not what was observed, as shown later in the following paragraphs, it can be assumed that the difference in the microstructures of materials does not have a significant impact on the differences in the sorptive behavior of the MIS and NIS. The BET surface areas of molecularly imprinted and non-imprinted materials were determined. The imprinted silica shows higher values of
BET surface area (58.4 m2 g-1) when compared with
non-imprinted silica (0.43 m2 g-1).
MISPE-HPLC-UV method
Figure 3 compares the phenobarbital peak areas
obtained after extraction of a 10 mL of 10 µg mL-1
aqueous test solution and desorption with varied desorption solvents with a desorption volume fixed at 5 mL. The desorption and sample solvents were chosen by the differences on their polarity. The desorption efficiency
decreases from: methanol > acetonitrile > chloroform ≈
dichloromethane. Barbiturates can be considered as polar organic species, being also weak acids in aqueous solution
(for phenobarbital, pKa1 = 7.3 and pKa2 = 11.8).36 Therefore,
it would be expected for polar solvents such as methanol
(measured through Snyder’s solubility parameter δ = 12.9)37
Figure 1. Infra-red absorption spectra for the MIS (upper plot) and NIS
(lower plot). See text for band assignment.
or acetonitrile (δ = 11.8) to be more effective to remove sorbed phenobarbital than less polar solvents as chloroform
(δ = 9.1) or dichloromethane (δ = 9.6). However, considering
the acidity of barbiturates, the ability of the solvents on accepting protons and forming hydrogen bridges with the analytes also should also be taken into account. This capability can be assessed from the corresponding factors
on Snyder’s system, δa and δh (respectively, proton acceptor
and donor solubility parameters). For the series methanol,
acetonitrile, chloroform and dichloromethane the δa and δh
values are: 7.5 and 7.5; 2.5 and zero; 0.5 and zero; and 5.5 and 0.5. Thus, methanol is both more polar than acetonitrile and more apt to interact with analytes through hydrogen bridging; therefore, it was selected for desorption in the general MISPE method.
The effect of the sample solvent on the efficiency was also studied, using test solutions of phenobarbital in the same solvents studied above and methanol for desorption. The extraction efficiency was maximized in the order
chloroform > dichloromethane > acetonitrile ≈ methanol.
These results can also be interpreted considering the polarity of the solvents. Efficiency is maximized for extractions from samples dissolved in chloroform or dichloromethane, which are less polar then methanol and acetonitrile and do not compete with the MIS for the polar phenobarbital (Figure 3). The overall polarity of both halogenated solvents is similar;
however, as shown by its δa value, dichloromethane is a better
proton acceptor and therefore extractions from chloroform solutions are more efficient.
After selection of the desorption and sample solvent, the desorption solvent volume was also optimized; results are show on Figure 4. For phenobarbital, 4 mL of methanol was enough to reach complete desorption of the analyte. The
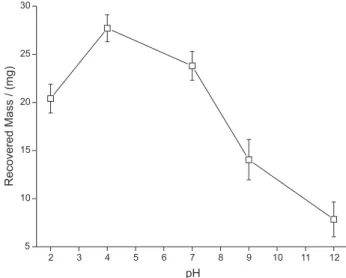
dependence between the pH of the sample and the extraction efficiency can be assessed from Figure 5. For phenobarbital, the extraction efficiency is maximized for sample pH close to 4. Some dependency between extraction efficiency and sample pH would be expected, considering the possible structure of the molecularly imprinted ormosil. The anchor points for the analyte inside the specific nanocavities probably are amino groups incorpored on the network, which can be protonaded or deprotonated, depending on the media pH. Considering that the nature of the interactions between the analyte and the anchor points in the specific cavities are predominantly electrostatic, the charge over binding sites should be an important factor controlling the capability of the material to retain these species. Also, the analytes themselves may also present acid or basic properties and their protonation or deprotonation should also effect is extraction.
Figure 3. Dependence of the extracted amount of phenobarbital (expressed
as peak areas) with the nature of the desorption solvent and with the nature of the sample solvent.
Figure 5. Dependence of the desorption efficiency (in %) with the pH
of the aqueous sample.
Figure 4. Dependence of the desorption efficiency (in %) with the volume
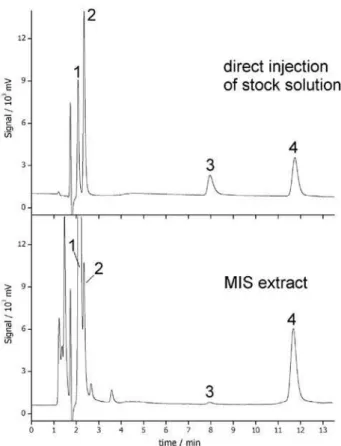
Selectivity of the MIS was assessed extracting aqueous test solutions containing phenobarbital and other drugs (paracetamol, caffeine and acetylsalicylic acid). Figure 6 compares HPLC-UV chromatograms obtained after MIS extraction of the test sample and by direct injection of the methanolic stock solution of the analytes. Apart from phenobarbital, caffeine and paracetamol were also extracted; retention of acetylsalicylic acid was marginal. These results can be discussed in terms of the molecular structures of these species compared to that of the template employed in the preparation of the MIS, as shown on Figure 7. Phenobarbital (b) can be considered a derivative of barbituric acid (a) by substitution of H atoms on position 5 of the heterocyclic ring. The affinity of the barbituric acid-marked MIS by phenobarbital should result from dipole-dipole interactions or H bridges between the amino and carbonyl groups on the pyrimidinetrione ring and the 3-aminopropyl groups specifically positioned inside the nanocavities created in the silica network after the molecular imprinting of the ormosil. However, both paracetamol and caffeine molecules have structural features similar to that of the template. The xanthine ring of caffeine consists of alternated amine nitrogens and carbonyl groups, comparable to the pirimidinetrione base structure of the template. For paracetamol, the binding to the MIS can happen through the acetamido radical on position 4 of the aromatic ring, which is structurally related to the template. Apart from structural similarity, both caffeine and paracetamol have molecular sizes compatible with the barbituric acid-imprinted nanocavities. On the other hand, acetylsalicilic acid does possess neither similar structural fragments nor molecular size compatible with the template, and it is only marginally retained. Therefore, this barbituric acid-marked MIS can be considered as selective towards barbiturates and other species with similar structural features. The imprinting factor for phenobarbital (defined as the ratio between the
amounts of template extracted with the MIS and NIS),23
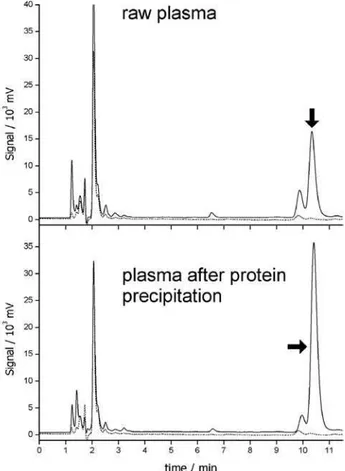
calculated from chromatograms obtained after treated plasma extraction (Figure 8), was estimated as 58; this high value suggests that the retention of this species can be almost completely assigned to specific binding to the MIS.
Along with signals for phenobarbital, paracetamol and caffeine, the chromatogram shows a group of non-identified
peaks with tR up to ca. 4.0 min. Similar peaks also appear
on the chromatograms for extractions from plasma using MIS and NIS (Figure 8). As these peaks appear after extractions with either imprinted or non-imprinted SPE cartridges, they can be associated to species retained by non-specific interactions with polar groups (hydroxyls or aminopropyl) available both in the MIS and the NIS, present as impurities on water or other materials employed as well as unreacted materials from the MIS or NIS preparation. These non-specific sorptive sites are likely to be present on very narrow pores in the materials, accessible only for very small molecules. The presence of a significant number of
Figure 6. HPLC-UV chromatograms corresponding to direct injection
of methanol stock solution containing paracetamol (1), caffeine (2), acetylsalicylic acid (3) and phenobarbital (4) and for the methanolic extract obtained after elution of aqueous test samples.
Figure 8. HPLC-UV chromatograms of methanolic extract of raw (upper plots) and deproteinized (bottom plots) human plasma spiked with 30 mg L-1 phenobarbital, using MIS (full line) and NIS (dotted lines).
Phenobarbital peak assigned with arrow.
surface binding sites would result in non-specific binding of phenobarbital, which does not occur; therefore, they should be unavailable for this analyte. In any case, this non-specific retention does not impair the use of the MIS as selective extraction media, since the undesirable species are easily chromatographically separated from the analyte.
Quantitative figures of merit of the MIS-HPLC-UV method
The parameters for analytical curve were estimated through the optimized extraction method, using aqueous solutions, preparated in the mobile phase, containing 10 to
100 µg mL-1 of the phenobarbital. The curve presented good
correlation coefficient (0.997), and with detection limites
of 10 µg mL-1 (water samples) and 62 µg mL-1, which even
without pre-concentration can be adequate for a series of applications. The limits of quantification were 30 and 186
µg mL-1, respectively.
Application to human plasma
Figure 8 shows chromatograms obtained after
extraction of human plasma spiked with 30 µg mL-1
phenobarbital, with and without previous protein removal. This level was selected considering the therapeutically
effective concentration range of this drug (15 µg mL-1
to 50 µg mL-1.38 In all chromatograms, there is a group
of peaks with tR up to ca. 3.5 min and corresponding to
species extracted through non-specific binding, in the MIS chromatograms, as discussed before. Apart from these peaks, the chromatograms are extremely clean; the only signals in the MIS were for phenobarbital
(tR = 10.40 min) and for two other non-identified species,
with tR = 9.95 min and 6.60 min. Since these later peaks
are higher for the MIS chromatograms when compared to their NIS counterparts, they seem to be species structurally related to the barbituric acid, as discussed above. The extraction recoveries for treated and untreated plasma were,
respectively, 22.5 µg mL-1 and 12.3 µg mL-1 (corresponding
to 75% and 41% recovery); the difference was attributed to the release of the fraction of the analyte bound to plasma proteins, after the deproteinization. The lifespan of the cartridges was 15 extractions for protein-free plasma or 3 extractions for raw plasma. The MISPE cartridges were washed with 20 mL methanol and 10 mL water between each extraction. These result shows the robustness of the MIS towards direct elution of raw plasma, which could result on fast fouling of other conventional materials due to
irreversible adsorption of proteins and lipids.39 However, the
most remarkable property of the MIS is the retention of the almost absence of non-specific retention of the analyte even
when applied to aqueous matrixes, as revealed comparing the MIS and NIS chromatograms. Most of the conventional
MIP does not work under these conditions,40 and specially
designed materials are demanded.
Conclusions
detection limits on clinical samples can be affected by loss of analytes bound to precipitated proteins, which should be checked. However, the most important aspect is that, contrary to other molecularly imprinted materials, this MIS kept its molecular recognition nature even under extremely polar media such as the aqueous samples evaluated here.
Acknowledgments
This work was funded by São Paulo State Research Support Foundation and by the National Councel of Technological and Scientific Developmnet (CNPq). Silva and Pilau thanks the Coordination for Improvement of Higher Level Personnel (CAPES) for scholarships. Authors also thank Prof. Carla B.G. Bottoli for the kind assistance on the HPLC analyses and Prof. Ronei J. Poppi for the plasma samples.
References
1. Pauling L.; J. Am. Chem. Soc.1940, 62, 2643. 2. Sellergren B.; J. Chromatogr. A2001, 906, 227
3. Ogiso M.; Minoura, N.; Shinbo, T.; Shimiz, T.; Biosens.
Bioelectron.2007, 22, 1974
4. Schweitz L.; Spegel P.; Nilsson S.; Electrophoresis2001, 22, 4053.
5. Quaglia M.; Sellergren B.; De Lorenzi E.; J Chromatogr. A
2004, 1044, 53.
6. Adbo K.; Nicholls I. A.; Anal. Chim. Acta2001, 435, 115. 7. Urraca, J. L.; Moreno-Bondi, M. C.; Orellana, G.; Sellergren,
B.; Hall, A. J.; Anal. Chem.2007, 79, 4915.
8. Caro, E.; Masqué, N.; Marcé, R. M.; Borrull, F.; Cormack, P. A. G.; Sherrington, D. C.; J. Chromatogr. A2002, 963, 169. 9. Joshi, V. P.; Karode, S. K.; Kulkarni, M. G.; Mashelkar, R. A.;
Chem. Eng. Sci.1998, 53, 2271.
10. Chassaing, C.; Stokes, J.; Venn, R. F.; Lanza, F.; Sellergren, B.; Holmberg, A.; Berggren, C.; J. Chromatogr. B2004, 804, 71. 11. Martin, P.; Jones, G. R.; Stringer, F.; Wilson, I. D.; J. Pharm.
Biomed. Anal.2004, 35, 1231.
12. Moller, K.; Nilsson, U.; Crescenzi, C.; J. Chromatogr. B2004,
811, 171.
13. Caro, E; Marcé, R. M.; Cormack, P. A. G.; Sherrington, D. C.; Borrull, F.; J. Chromatogr. B2004, 813, 137.
14. Muldoon, M. T.; Stanker, L. H.; Anal. Chem.1997, 69, 803. 15. Chapius, F.; Pichon V.; Lanza F. L; Sellergren B.; Hennion, M.
C.; J. Chromatogr. A2003, 999, 23.
16. Poole, C. F. In Sampling and Sample Preparation for Field
and Laboratory; Pawliszyn, J. ed., Elsevier: Amsterdam, 2002,
p. 341.
17. Kandimalla, V. B.; Hunagxian, J.; Anal. Bioanal. Chem.2004,
380, 587.
18. Dickey, F. H.; J. Phys. Chem.1955, 59, 695.
19. Dai, S.; Shin, Y. S.; Barnes, C. E.; Toth, L. M.; Chem. Mater.
1997, 9, 2521.
20. Makote, R.; Collinson, M. M.; Chem. Mater.1998, 10, 2440. 21. Marx, S.; Zaltsman, A.; Turyan, I.; Mandler, D.; Anal. Chem.
2004, 76, 120.
22. Díaz-García, M. E.; Laíno, R. B.; Microchim. Acta2005, 149, 19.
23. Silva, R. G. C.; Augusto, F.; J. Chromatogr. A2006, 1114, 316.
24. Brinker, J.; Scherer, G.; Sol–Gel Science, Academic Press: New York, 1989.
25. Chong, S. L.; Wang, D. X.; Hayes, J. D.; Wilhite, B. W.; Malik,
A.; Anal. Chem.1997, 69, 3889.
26. Lopes, A. L.; Augusto, F.; J. Chromatogr. A2004, 1056, 13. 27. Zuin, V. G.; Lopes, A. L.; Yariwake, J. H.; Augusto, F.;
J. Chromatogr. A2004, 1056, 21.
28. Silva, R. G. C.; Augusto, F.; J. Chromatogr. A2005, 1072, 7. 29. American Hospital Formulary Service Drug Information
97; McEvoy, G.K., ed., American Society of Health System Pharmacists: Bethesda, 1997.
30. Martín-Biosca, Y.; Sagrado, S.; Villanueva-Camañas, R. M.; Medina-Hernández, M. J.; Biomed. Chromatogr.2000, 14, 113.
31. Feng, C. L.; Liu, Y. T.; Luo, Y.; Chin. J. Chromatogr.1994, 12, 18.
32. Li, Y. L.; Xu, J. Z.; Liu, Y.; Chin. J. Forensic Med.1998, 13, 137.
33. Namera, A.; Yashiki, M.; Iwasaki, Y.; Ohtani, M.; Kojima, T.;
J. Chromatogr. B1998, 716, 171.
34. Zhao, H.; Wang, L.; Qiu, Y.; Zhou, Z.; Li, X.; Zhong, W.;
J. Chromatogr. B2006, 840, 139.
35. Snyder, L. R. In Modern Practice of Liquid Chromatography; Kirkland, J.J., ed., Wiley-Interscience: New York, 1971, p. 125.
36. Penry, J. K.; Newmark, M. E.; Ann. Int. Med.1979, 90, 207. 37. Vintiloiu, A.; Mullett, W. M.; Papp, R.; Lubda, D.; Kwong E.;
J. Chromatogr. A2005, 1082, 150.
38. Dirion, B.; Cobb, Z.; Schillinger, E.; Andersson, L. I.; Sellergren, B.; J. Am. Chem. Soc.2003, 125, 15101.
39. Silverstein, R. M.; Webster, F. X.; Spectrometric Identification
of Organic Compounds, 6th ed.; Wiley: New York, 1997.
40. The Merck Index, 12th ed.; Chapman Hall: London, 1997,
monography 7386.
Received: September 6, 2007 Web Release Date: July 18, 2008